categorisation and recognition
Jo˜ao Rodrigues1 and J.M.Hans du Buf21 University of the Algarve – Escola Superior Tecnologia, Faro, Portugal 2 University of the Algarve – Vision Laboratory – FCT, Faro, Portugal
Abstract. Object recognition requires that templates with canonical views are stored in memory. Such templates must somehow be nor-malised. In this paper we present a novel method for obtaining 2D translation, rotation and size invariance. Cortical simple, complex and end-stopped cells provide multi-scale maps of lines, edges and keypoints. These maps are combined such that objects are characterised. Dynamic routing in neighbouring neural layers allows feature maps of input ob-jects and stored templates to converge. We illustrate the construction of group templates and the invariance method for object categorisation and recognition in the context of a cortical architecture, which can be applied in computer vision.
1
Introduction
The visual cortex detects and recognises objects by means of the “what” and “where” subsystems. The “bandwidth” of these systems is limited: only one object can be attended at any time [8]. In a current model [4], the ventral what system receives input from cortical area V1 which proceeds through V2 and V4 to IT cortex. The dorsal where system connects V1 and V2 through MT to area PP. Both systems are controlled, top-down, by attention and short-term memory with object representations in PF cortex, i.e. a what component from ventral PF46v to IT and a where component from dorsal PF46d to PP. The bottom-up (visual input code) and top-down (expected object and position) data streams are necessary for obtaining translation, rotation and size invariance [4].
Object recognition, from the image hitting the retina to feature extractions in V1 and groupings in higher areas, takes time, typically 150–200 ms. Category-specific activation of PF cortex starts after about 100 ms [1]. In addition, IT cortex first receives coarse-scale information and later fine-scale information. This implies that some information propagates rapidly and directly to “atten-tion” in PF cortex in order to pre-select possible object templates, which are then used in the what and where subsystems until recognition is achieved [2].
In [11] it is shown that end-stopped cells in cortical area V1, which combine outputs of complex cells tuned to different orientations, serve to detect line and edge crossings, singularities and points with large curvature. These cells can be used to construct retinotopic keypoint maps at different spatial scales
coarse plus fine scales.
In the studies mentioned above it was assumed that all input objects and all stored templates are normalised in terms of position, pose and size. This restriction is not realistic in real applications. The invariance problem has been studied in the context of biological vision [3, 7, 12] and computer vision [6]. In this paper we explore the combination of multi-scale keypoints—by means of saliency maps—and the multi-scale line/edge representation, with feedback data streams from higher cortical areas, for obtaining invariance in the framework of a complete cortical architecture.
2
Methods
Object recognition can be seen as a multi-level categorisation task, for example: (a) an animal, (b) one with four legs, (c) a horse and (d) the brown one with short tail called Tom. By using more features, the categorisation becomes more distinct until final recognition is achieved: a specific object within the class of objects [9]. In this paper we also split the processing into three levels, i.e. pre-categorisation, categorisation and recognition, but we focus on invariant processing.
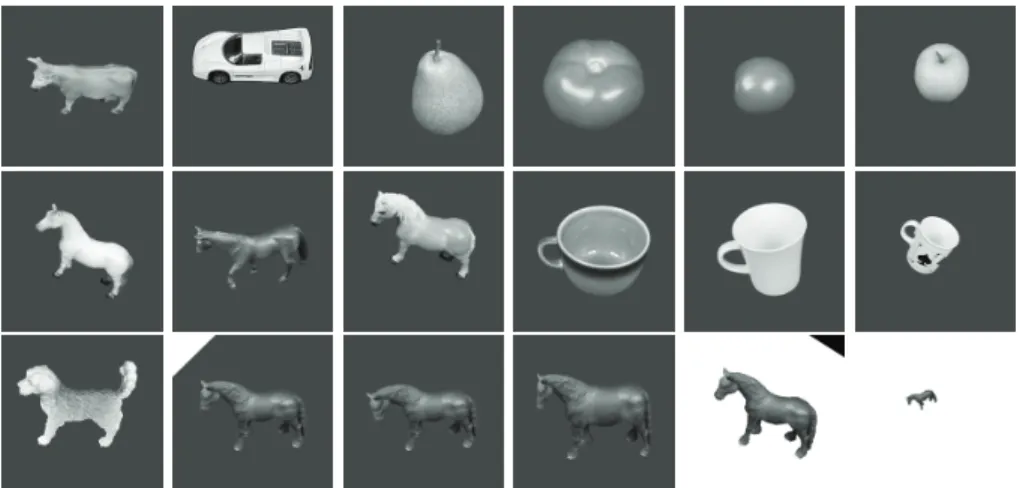
In our experiments we used the ETH-80 database [5] in which all images are cropped such that they contain only one object, centered, against a 20% background. The views of all objects are also normalised, e.g. all animals with the head to the left (in Fig. 5 marked by white triangle). Images were rescaled to a size of 256× 256 pixels. We selected 10 different images in each of 8 groups (dogs, horses, cows, apples, pears, tomatos, cups and cars). The selected images were used at three levels: four types of objects (animals, fruits, cars, cups) for
pre-categorisation. Two of those were subdivided into three types (animals: horses,
cows, dogs; fruits: tomatos, pears, apples) for categorisation. Final recognition concerns the identification of each individual object (horse number 3) within the corresponding group (horses).
Group templates in memory were created using the normalised objects (see Section 2.3), but in order to test invariance processing a set of additional in-put images was created by manipulations like translations, rotations and zooms, including deformations (e.g. the head of a horse moved up or down relative to the body). We created 64 additional input images of the most distinct objects: 20 manipulated horse images (horses were used as a special test case for recog-nition); 6 dogs, 6 cows, 4 tomatos, 4 pears and 4 apples (for categorisation); plus 10 cars and 10 cups (only for pre-categorisation). Typical images are shown
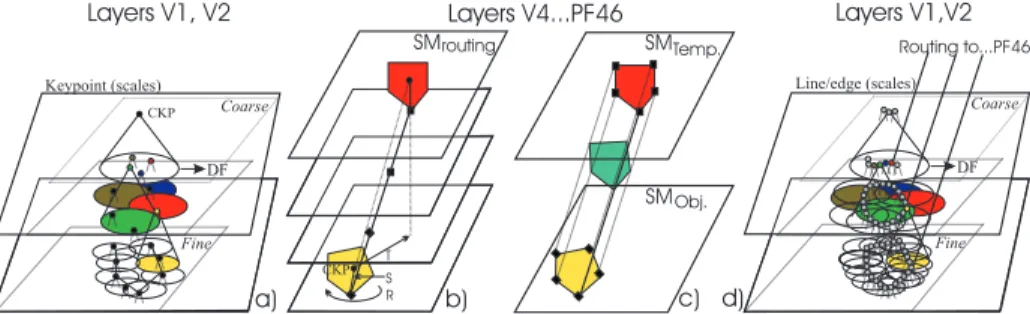
Fig. 1. Dynamic routing scheme (see text).
in Fig. 5: the bottom line shows the same horse normalised (marked by white triangle) and with the head more down, bigger, rotated, scaled against a white background, plus an extreme case. The use of this extended database allows to compare our results with invariance processing to previous results obtained with only normalised objects [9]: mean error (standard deviation) of 3.0(1.0)% in the case of pcategorisation and 9.3(2.1)% in the case of categorisation. These re-sults were obtained by using 8 scales equally spaced on λ = [4, 32] (λ refers to the wavelength of simple cells, modelled by Gabor wavelets, given in pixels).
2.1 Invariance by dynamic neural routing
A saliency map (SM) [11] indicates the most important positions to be analysed, because it is constructed on the basis of the multi-scale keypoint representation where keypoints code local image complexity on the basis of end-stopped cells. Activities of all keypoint cells at each position are summed over all scales by grouping cells. At positions where keypoints are stable over many scales, this summation map will show distinct peaks: at centres of objects (coarse scales), at important sub-structures (medium scales) and at contour landmarks (fine scales). The height of the peaks provides information about their relative im-portance. Such saliency maps are crucial for Focus-of-Attention and are part of the data stream which is data-driven and bottom-up. This data stream can be combined with top-down processing from IT cortex in order to actively probe the presence of objects in the visual field [4]. In our experiments we assume that SMs are also part of object and group templates in memory, and that these are used to project representations of input objects onto representations of templates by dynamic routing in intermediate neural layers (Fig. 1).
In our simulations we explored one possible scenario. Each object template consists partly of significant peaks of the saliency map obtained by non-maximum suppression and thresholding. A grouping cell, with its dendritic field (DF) in the SM, is positioned at the central keypoint that represents the entire ob-ject/template at very coarse scales. This central keypoint is located at or close to the object’s centroid; see Figs 4 and 6 in [11]. Examples of SMs and significant peaks are shown here in Fig. 2(a,b), in the case of a horse image. The invari-ant method consists of steps a to f: (a) Central keypoints at very coarse scales
Again, grouping cells at those peaks and with DFs in the intermediate layers serve to link the peaks by dynamic routing, but this time for compensating ro-tation and size (Fig. 1b; R and S). The resulting routing (translation, roro-tation and size projection) is then applied to all significant peaks (Fig. 1c) because they belong to a single object/template.
(c) All other significant SM peaks of the input object and of the template are
tested in order to check whether sufficient coinciding pairs exist for a match. To this end another hierarchy of grouping cells is used: from many local ones with a relatively small DF to cover small differences in position due to object deforma-tions etc., to one global one with a DF that covers the entire object/template. Instead of only summing activities in the DFs, these grouping cells can be in-hibited if one input (peak amplitude of object, say) is less than half of the other input (in this case of the template).
(d) If the global grouping of corresponding pairs of significant peaks is above
a threshold (we used half of the amplitude of the maximum peak), the invariant match is positive. If not, this does not automatically mean that input object and template are different: the dynamic routing established in step (b) may be wrong. Steps (b-c) are then repeated by inhibiting the most significant peak of the object and selecting the next biggest peak.
(e) If no global match can be achieved, this means that the input object does
not correspond to the template or that the view of the object (deformation, rota-tion or size) is not represented by the template. In this case the same processing is applied using all other templates in memory until the ones are found which could match.
(f ) Until here, only peaks in saliency maps were used to find possibly
match-ing templates, but mainly for dynamic routmatch-ing which virtually “superimposes” the input object and the templates. In this step the dynamic routing of SM peaks is also applied to the multi-scale line/edge representation in order to check whether the input object and a template really correspond (Fig. 1d). Again, this is done by many grouping cells with small DFs (local correlation of line/edge events) and one with a big DF (global object/template correlation); see [9]. The use of small DFs can be seen as a relaxation: two events of object and template count for a match if they are at the same position but also if they are very close to each other. The size of the DFs is coupled to the size of complex cells [2].
The template information used in step (f ) depends on the level of categori-sation. In the case of the first, coarse, pre-categorisation (f.1), only (line/edge) events (Fig. 2d) at 3 coarse scales of the segregated, binary object (Fig. 2c) is
Fig. 2. (a) Saliency map of horse8, (b) SM peaks, (c) segregated image and (d) line/edge coding of segregated image at λ = 24. (e-f) Corresponding SM peaks and line/edge map in pre-categorisation. (g-h) The same with line/edge map at λ = 8 in categorisation. (i-j) The same with line/edge map atλ = 4 in recognition. Input object and matching object are shown in Fig. 5 (marked by a black and white corner triangle).
used, because (a) segregation must be done before categorisation and (b) coarse-scale information propagates first from V1 to higher cortical areas. Global group-ings of events are compared over all possibly matching templates, scale by scale, and then summed over the 3 scales, and the template with the maximum sum is selected [9] (winner-takes-all; Fig. 2f shows a projected and matching line/edge map). In the case of the subsequent finer categorisation (f.2), the process is sim-ilar, but now we use (line/edge) events at all 8 scales obtained from the object itself instead of from the binary segregation [9]. Figure 2g and h show projected peaks and the line/edge map used in categorisation. Final recognition (f.3) dif-fers from categorisation (f.2) in that line and edge events are treated separately: lines must match lines and edges must match edges [10]. This involves three ad-ditional layers of grouping cells, two for local co-occurrences of lines and edges and one global. Figure 2i and j show projected peaks and the line/edge map used in recognition.
2.2 Object and group templates
Good templates are essential for obtaining correct categorisation and recognition results. Templates for categorisation must be generic enough to represent all possible objects of the group to be tested and no objects of other groups. We assume that templates are composed of saliency maps obtained by combining keypoints detected at many scales and the multi-scale line/edge representation. We also assume that templates are constructed on the basis of normalised views. Templates must consist of the same information as used in the processing steps described in the previous sections: saliency maps and their significant peaks for obtaining translation, rotation and size invariance, plus line/edge maps at all 8 scales for categorisation and recognition. Group templates for categorisations were created by combining feature maps of all 10 or 30 normalised (not
manipu-Fig. 3. Top two lines: group templates for pre-categorisation (animal, fruit, car and cup). Bottom three lines: the same for categorisation (horse, cow, dog, tomato, pear and apple). In reality only binary line/edge maps without event types are used.
Fig. 4. Templates used for recognition (two different horses).
lated) images of the selected database. In the case of SMs, all SMs of individual objects were summed. In the case of line/edge maps, events were combined (OR-ed) in a binary map because only event positions and no event types are used in (pre-)categorisation. Event types are only used in recognition, but this concerns individual object templates and not group templates.
Figure 3 (top two rows) shows group templates for pre-categorisation, i.e., saliency maps, their significant peaks and line/edge maps atλ = 32 (one of three scales used). The bottom three rows show the same for categorisation (line/edge map at λ = 8; one of eight scales used). Figure 4 shows two individual object templates used for recognition, i.e. two examples of the ten different horses, with the line/edge representation at λ = 4 (one of eight scales used).
3
Results and discussion
Results obtained with the 64 manipulated images were quite good: pre-categorisa-tion (animal, fruit, car, cup) failed in 12 cases. Of the remaining 52 images, categorisation (animal: horse, cow, dog; fruit: tomato, pear, apple) failed in 8 cases. Recognition, which was only tested in the case of horses because of logistic problems due to storage capacity of hard discs (not CPU time!), failed for 2 of all 20 manipulated horse images.
As for previous results obtained with normalised objects [9], categorisation errors occurred mainly for apples and tomatoes, which can be explained by the fact that the shapes are very similar and no colour information has been used. In pre-categorisation there appeared an increased error rate of fruits which were categorised as cups. This mainly concerned pears, and can be explained by the tapered-elliptical shape in combination with size variations such that keypoints and line/edge events of input pears can coincide with those of the cups template. As expected, problems also occurred with extreme size variations. The scales used (λ = [4, 32]) are related to the size of the objects and the level of detail that can be represented. Figure 5 (right column, row 1 and 2) shows the smallest objects that can be dealt with by using these scales. The bottom row (right column) shows an extreme example that failed. In this case, the use of finer scales (λ = [4, 11]) can solve the pre-categorisation problem (the 3 coarsest of 8 scales applied to the segregated, binary object), but categorisation and recognition require scales with λ < 4 pixels. Gabor wavelets (simple cells) at smaller scales are not well-defined (less samples) and this will lead to problems in the detection of keypoints and lines and edges. It should be emphasised that the method can be applied to images that contain multiple objects. Although our visual system has a limited “bandwidth” and can test only one object at any time [8]), this problem can be solved by sequential processing of all detected and segregated objects (see [11]). However, detection and segregation of objects seen against a cluttered background is also a complex problem, as is the recognition of partially occluded objects.
Finally, it should be mentioned that dynamic routing of keypoints (signifi-cant peaks in saliency maps) and line/edge events in intermediate neural layers has consequences for the minimum number of canonical object views in mem-ory, i.e. the number of templates. If a horse template has the head to the left but an input horse has been rotated (2D) 180 degrees such that the head is to the right, dynamic routing will not be possible because there will be a crossing point at some level. In computer vision, this problem can be avoided by applying translation vectors and rotation angles to keypoints and line/edge events. How-ever, recognition in the case of 3D rotation requires separate templates because of asymmetrical patterns of the horse’s fell. Extensive experiments with many more object views are required to determine the minimum number of templates, both in human and in computer vision.
Acknowledgements. This work was partially supported by Funda¸c˜ao para a Ciˆencia e a Tecnologia (ISR/IST plurianual funding) through POS Conhecimento Program that includes FEDER funds.
Fig. 5. Examples of objects used for categorisation and recognition.
References
1. M. Bar. Visual objects in context. Nature Reviews: Neuroscience, 5:619–629, 2004. 2. M. Bar et al. Top-down facilitation of visual recognition. PNAS, 103(2):449–454,
2006.
3. D. Cox et al. “Breaking” position-invariant object recognition. Nat Neurosci., 8(9):1145–7, 2005.
4. G. Deco and E.T. Rolls. A neurodynamical cortical model of visual attention and invariant object recognition. Vision Res., 44(6):621–642, 2004.
5. B. Leibe and B. Schiele. Analyzing appearance and contour based methods for object categorization. Proc. IEEE Conf. Comp. Vis. Pat. Recogn., :409-415, 2003. 6. D.G. Lowe. Distinctive image feature from scale-invariant keypoints. Int. J. Comp.
Vis., 2(60):91–110, 2004.
7. B.A. Olshausen et al. A neurobiological model of visual attention and invari-ant pattern recognition based on dynamic routing of information. J. Neurosc., 13(11):4700–19, 1993.
8. R. Rensink. The dynamic representation of scenes. Visual Cogn., 7(1-3):17–42, 2000.
9. J. Rodrigues and J.M.H. du Buf. Cortical object segregation and categorization by multi-scale line and edge coding. Proc. Int. Conf. Comp. Vision Theory
Appli-cations., Vol. 2:5–12, 2006.
10. J. Rodrigues and J.M.H. du Buf. Face recognition by cortical multi-scale line and edge representations. Proc. Int. Conf. Image Anal. Recogn., LNCS Vol. 3211:329– 340, 2006.
11. J. Rodrigues and J.M.H. du Buf. Multi-scale keypoints in V1 and beyond: object segregation, scale selection, saliency maps and face detection. BioSystems, 86:75– 90, 2006.
12. S. Stringer et al. Learning invariant object recognition in the visual system with continuous transformations. Biol. Cybern., 94:128–142, 2006.