INCORPORATION OF SELENIUM ON MICROALGAE AS
SUPPLEMENT TO ARTEMIA AND ZEBRAFISH
Tamára Filipa da Costa Santos
Dissertation
Aquaculture and Fisheries Master
Supervisors Prof. Dra. Luísa Barreira
Universidade do Algarve, Faro, Portugal &
Prof. Dr. João Varela
Universidade do Algarve, Faro, Portugal &
Dr. Jorge Dias
INCORPORATION OF SELENIUM ON MICROALGAE AS
SUPPLEMENT TO ARTEMIA AND ZEBRAFISH
Tamára Filipa da Costa Santos
Dissertation
Aquaculture and Fisheries Master
Supervisors
Profª. Doutora Luísa Barreira Universidade do Algarve, Faro, Portugal
&
Prof. Doutor João Varela
Universidade do Algarve, Faro, Portugal &
Doutor Jorge Dias SPAROS Lda., Faro, Portugal
Título: Incorporation of selenium on microalgae as supplement to artemia and zebrafish Autoria: Tamára Filipa da Costa Santos
Ano: 2015
Orientação científica do trabalho: Profª. Doutora Luísa Barreira; Prof. Doutor João Varela & Doutor Jorge Dias
Declaração de autoria de trabalho
Declaro ser a autora deste trabalho, que é original e inédito. Autores e trabalhos consultados estão devidamente citados no texto e constam da listagem de referências incluída.
_______________________________________________________________________
«Copyright»
A Universidade do Algarve tem o direito, perpétuo e sem limites geográficos, de arquivar e publicitar este trabalho através de exemplares impressos reproduzidos em papel ou de forma digital, ou por qualquer outro meio conhecido ou que venha a ser inventado, de o divulgar através de repositórios científicos e de admitir a sua cópia e distribuição com objetivos educacionais ou de investigação, não comerciais, desde
" aimlessly, devoted,
ACKNOWLEDGEMENTS
Em primeiro lugar gostaria de agradecer ao meus orientados, Prof.ª Doutora Luísa Barreira; Prof. Doutor João Varela e Doutor Jorge Dias pela oportunidade para desenvolver este trabalho. Á Prof.ª Luísa Barreira e Prof. João Varela, ainda pelo acompanhamento constante e partilha de conhecimentos. Gostaria ainda de agradecer ao grupo EDGE, em especial ao Gil Martins pela paciência e apoio ao longo de todo o trabalho. Ao LES pela realização das análises de Selénio total por AAA. A todos do INSA, em particular à Sandra Gueifão e à Doutora Isabel Castanheiro, pela oportunidade de aprender e pela simpatia com que receberam. A todos os meus colegas do MarBiotech, pela amizade, compreensão e companheirismo. Ao Hugo Pereira, por ser um amigo e um professor. Aos meu amigos, que sempre estiveram presentes. E por fim, à minha família, pelo amor e pelo apoio que me deram na luta constante pelos meus objectivos. Este trabalho é um pouco de todos, que de uma forma ou de outra me formaram, acompanharam e levaram a progredir. Um sincero Obrigada.
RESUMO
O selénio (Se) é considerado um mineral essencial com benefícios tanto para a saúde humana como animal, atribuidos às suas propriedades antioxidantes. Este micronutriente é utilizado como suplemento nutricional em aquacultura, como forma de promover tanto o crescimento como a capacidade antioxidante dos organismos. O Se apresenta ainda funções na prevenção de deformações esqueléticas e redução dos danos musculares. As microalgas apresentam-se como organismos fonte de micronutrientes essenciais, tal como PUFA e carotenóides, com funções no ciclo de transferência do Se, convertendo a sua forma inorgânica (selenito e selenato), a orgânica (selenometionina). O principal objetivo deste trabalho foi produzir biomassa algal enriquecida em Se, para posterior suplementação de diferentes níveis tróficos. Com este intuito, microdietas formuladas com diferentes fontes e concentrações de Se, foram comparadas para determinação no crescimento e desenvolvimento em larvas de peixe zebra (Danio rerio). Nas culturas de Isochyrsis galbana, enriquecida com 20 mg Se L-1 no meio, obteve-se uma concentração de selénio total de 120 mg Kg-1 DW, contudo foi observado uma inibição no crescimento para concentrações de selenato superiores a 25 mg Se L-1. A microalga, I. galbana enriquecida em Se foi posteriormente introduzida nos cultivos de Artemia franciscana (AF), que obteve valores de Se total de 20 mg kg-1 DW em comparação
com AF produzida num meio controlo, não enriquecido ( 2 mg Se kg - 1 DW). Em termos de
comparação da biodisponibilidade de microdietas enriquecidas em Se proveniente de sais inorgânicos, levedura ou de biomassa algal, o tratamento utilizado com Se inorgânico foi considerado tóxico para os estágios larvares de peixe zebra, alcançando 100% de mortalidade
com uma concentração de 5 mg Se kg – 1DW. Não foram verificadas diferenças significativas
para os tratamentos com levedura ou microalga suplementadas, quando utilizada uma
concentração de 0.5 mg Se kg– 1 DW. Contrariamente a biomassa de microalga enriquecida
em Se com uma concentração de 2 mg Se kg – 1DW, obteve resultados significativos em
termos de aumento de crescimento, peso e redução do número total de deformações. O
presente estudo, com base nos resultados descritos, concluiu que a espécie I. galbana, representa uma fonte promissora para a produção biotecnológica de biomassa enriquecida em selénio, destinada à nutrição animal sobre a forma de suplementos.
Palavras-chave: Selénio; selenometionina; Isochrysis galbana; Artemia spp.; Peixe-zebra; Bioacumulação; Deformações esqueléticas;
ABSTRACT
Selenium (Se) is an essential element known to promote the health of humans and animals. This micronutrient is commonly used in aquaculture as a feed additive to enhance growth and larval antioxidant capacity and prevent skeletal deformities. Microalgae contain valuable micronutrients (e.g. PUFA, carotenoids) and are able to convert inorganic to organic Se, making them a suitable aquaculture feed source. Thus, the aim of this work was to produce Se-enriched Isochrysis galbana microalgal biomass to improve the contents of this element at different trophic levels in aquaculture. For this purpose, enriched yeast and Se-enriched microalgae in microdiets were assessed in terms of the biological performance and osteological development of zebrafish (Danio rerio) larvae. I. galbana was able to incorporate up to 150 mg Se Kg-1 DW when exposed to 20 mg Se L-1 in the medium, whereas concentrations higher than 25 mg Se L-1 inhibited growth. After feeding Se-enriched I. galbana to Artemia spp., the latter accumulated up to 20 mg Se Kg-1 DW compared to the non-enriched control (2 mg Se Kg-1 DW). Inorganic Se salts were found to be toxic to the larval stages at 5 mg Se kg-1. There were no significant differences between the treatments containing 0.5 mg Se kg-1 supplied through yeast and microalgal sources. In addition, the diet with Se-enriched microalgal biomass with a concentration of 2 mg Se kg-1 enhanced length,
weight and significantly decreased skeletal deformations in zebrafish as compared to diets containing Se-enriched yeast or non-supplemented diets. Taken together, the results of the present work strongly suggest that I. galbana can be used to produce Se-enriched biomass for fish nutrition in the form of feed supplements.
Keywords: Selenium; Selenomethionine; Isochrysis galbana; Artemia spp.; Zebrafish; Bioaccumulation; Skeletal development;
Table of Contents 1 Introduction 1 1.1. Selenium 3 1.2. Selenium In Aquaculture 5 1.2.1. Microalgae 5 1.2.2. Zooplankton 9 1.2.3. Fish Production 10
1.3. Impact Of Selenium On Human Health 14
1.4. Objectives 15
2 Material & Methods 16
2.1. Microalgae 17
2.1.1. Experimental Design 17 2.1.2. Culture Conditions 19
2.1.3. Microalgal Cultivation With Selenate 20 2.1.4. Growth Parameters 21
2.1.5. Biochemical Analysis 23 2.1.6. Total Selenium Determination 27
2.2. Live Feeds 30
2.2.1. Experimental Design 30
2.2.2. Culture Conditions And Rearing 31
2.3. Microdiet Preparation 31 2.4. Zebrafish 32 2.4.1. Experimental Design 32 2.4.2. Larvae Rearing 34 2.4.3. Larvae Sampling 34 2.4.4. Nutrition 35 2.4.5. Skeletal Deformities 35 2.5. Statistical Analyses 36
3 Results & Discussion 37
3.1. Microalgae 37
3.1.1. Selenate Effect On Growht 37
3.2. Selenium Bioaccumulation 39
3.3. Biochemical Analysis 42
3.3.1. Afdw And Protein Content 42 3.3.2. Total Lipids Content 42 3.3.3. Fame Profile 43
3.4. Se Transferance Up The Food Chain 45
3.5. Zebrafish 46
3.5.2. Survival 47
3.5.4. Larvae Deformities 50
4 Conclusions 55
FIGURES LIST
FIGURE 1 SE TROPHIC CYCLE IN THE AQUATIC FOOD WEB (ADAPTED FROM HASANZZAMAN ET AL., 2010; LATORREETAL., 2013).MICROALGAE ASSIMILATE DISSOLVED SE IN THE FORM OF SELENATE (SEO42-) OR
SELENITE (SEO32-) FROM THE ENVIRONMENT AND CONVERTED TO ORGANIC SE (SEMET AND SECYST).
CIRCULATION OF SE BETWEEN WATER TO PHYTOPLANKTON, ZOOPLANKTON AND FINAL CONSUMERS OCCURS VIA BIOLOGICAL TRANSFORMATION OF INORGANIC FORMS (GREEN PATHWAY) TO ORGANIC SE (RED PATHWAY), WITH BENEFITS TO EITHER FISH OR HUMANS. ... 2
FIGURE 2SCHEMATIC OVERVIEW OF PROPOSED SELENIUM METABOLISM IN MICROALGAE (ADAPTED FROM ARAIE
&SHIRAIWA,2009;ZHU ET AL.,2009).SELENATE AND SELENITE METABOLIC UPTAKE IN THE MICROALGAE CELL.[I]: SELENATE-SULFATE TRANSPORT SYSTEM;[II]–ATP DEPENDENT SELENITE TRANSPORT SYSTEM OR NON-SPECIFIC, PASSIVE TRANSPORT SYSTEM. [A]- SECYS SPECIFIC INCORPORATION INTO PROTEINS [B]-SEMET NON-SPECIFIC INCORPORATION INTO PROTEINS. ... 8
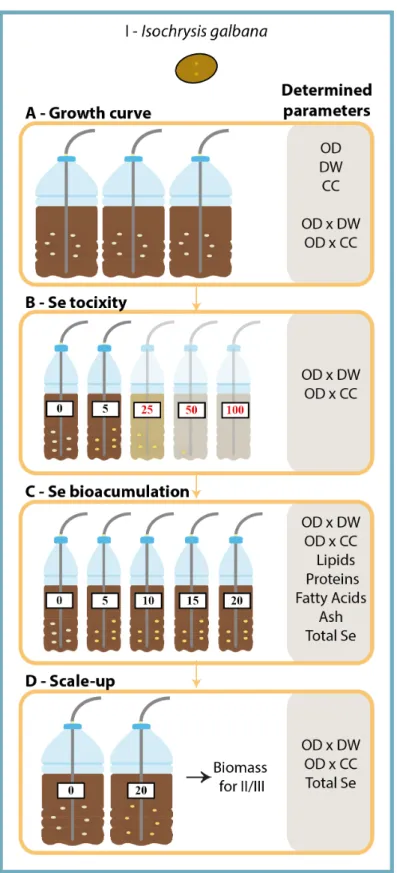
FIGURE 3EXPERIMENTAL DESIGN (I) AND PARAMETERS DETERMINED IN THE DIFFERENT ASSAYS PERFORMED TO PRODUCE I. GALBANA SE-ENRICHED BIOMASS A)GROWTH CURVES WERE ESTABLISHED;B) CULTURES WERE EXPOSED TO INCREASING SELENATE CONCENTRATIONS (0,5,25,50 AND 100 MG SE L-1) TO ESTABLISH THE LETHAL SE CONCENTRATION:C) IN THE SECOND ASSAY A NARROWER RANGE OF CONCENTRATIONS (0,5,10, 15,20 MG SE L-1) WAS TESTED IN ORDER TO DETERMINE THE MAXIMUM SE INCORPORATION IN THE BIOMASS;
D) TO OBTAIN SE-ENRICHED BIOMASS FOR THE FOLLOWING ASSAYS, CULTURES WERE GROWN WITH 20 MG SE
L-1;.OD-OPTICAL DENSITY;DW- DRY WEIGHT;CC-CELLULAR CONCENTRATION. ... 18
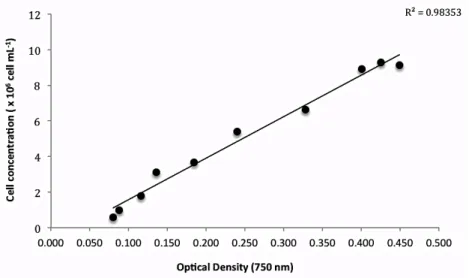
FIGURE 4 RELATIONSHIP BETWEEN OPTICAL DENSITY MEASURED AT 750 NM AND CELLULAR CONCENTRATION
(CELLS ML-1). ... 21
FIGURE 5RELATIONSHIP BETWEEN OPTICAL DENSITY MEASURED AT 750NM AND DRY WEIGHT (G L-1). ... 22 FIGURE 4 EXPERIMENTAL DESIGNS ESTABLISHED FOR: A- THE ENRICHMENT OF ARTEMIA FRANCISCANA WITH
I.GALBANA SE-ENRICHED BIOMASS (SE+) AND COMPARED TO A TREATMENT WITH I. GALBANA WITHOUT SE ENRICHMENT.B-ARTEMIA WAS LATTER FILTERED WITH A 45 ΜM MESH, FREEZE DRIED AND STORED IN A DESSICATOR UNTIL DETERMINATION OF TOTAL SE. ... 30
FIGURE 5 EXPERIMENTAL DESIGN USED TO ASSESS THE EFFECT OF DIFFERENT MICRODIETS ON THE MODEL VERTEBRATE, ZEBRAFISH.A-PRODUCED MICRODIETS WITH DIFFERENT SOURCES AND CONCENTRATIONS OF
SE; B-TEMPORAL FEEDING REGIME ESTABLISHED WITH AF AND MICRODIETS FOR 31 DPF. C- REARING SYSTEM USED IN THE COURSE OF THE ASSAY, LARVAE WERE GROWN AT A DENSITY OF 100 LARVAE L-1 UNTIL
15DPF AND LATER TRANSFERRED INTO 3L SYSTEMS AT A FINAL DENSITY OF 33 LARVAE L-1. LARVAE SAMPLES WERE COLLECTED AT 15DPF AND 31DPF FOR LATER ANALYSES. ... 33
FIGURE 6GROWTH OF I. GALBANA IN NUTRIENT SOLUTIONS WITH DIFFERENT SELENATE CONCENTRATIONS IN THE
MEDIUM. OPTICAL DENSITY MEASURED AT 750 NM DURING A CULTIVATION PERIOD OF 5 DAYS AND CELLULAR CONCENTRATIONS (CC) ESTIMATED FOR 5 DIFFERENT TREATMENTS (CTRL:CONTROL;5 MG SE L -1;25 MG SE L-1;50 MG SE L-1;100 MG SE L-1).DATA ARE GIVEN AS MEAN VALUES ±SD OF THE MEANS (N =
3). ... 38 FIGURE 7 CELLULAR CONCENTRATION OF I. GALBANA GROWN IN MEDIA WITH DIFFERENT SELENATE
CONCENTRATIONS (CTRL:CONTROL;5 MG SE L-1;10 MG SE L-1;15 MG SE L-1;20 MG SE L-1).DATA ARE GIVEN AS MEAN VALUES ±SD DEVIATION (N =3). ... 39
FIGURE 8 TOTAL SE CONTENT (MG KG -1 OF DW) OF I. GALBANA GROWN IN MEDIA WITH DIFFERENT SE CONCENTRATIONS (5 MG SE L-1;10 MG SE L-1;15 MG SE L-1;20 MG SE L-1).BARS REPRESENT MEANS ± SD(N
=3).BARS LABELLED WITH DIFFERENT LETTERS ARE SIGNIFICANTLY DIFFERENT (ANOVA IN CONJUNCTION WITH TUKEY'S TEST FOR MULTIPLE COMPARISONS P <0.05). ... 40
FIGURE 9TOTAL SE CONTENT (MG KG -1OF DW), DETERMINED BY ICP-MS, IN ZEBRAFISH BREED WITH DIFFERENT EXPERIMENTAL DIETS: CONTROL DIET (CTRL), DIET SUPPLEMENTED WITH 0.5 MG SE KG-1 DW OF SE
-ENRICHED YEAST (LEV) AND DIETS SUPPLEMENTED WITH SE-FORTIFIED I.GALBANA T-ISO, 0.5 MG SE KG-1
DW OF (MA1) AND 2 MG SE KG-1DW(MA2).BARS REPRESENT MEANS ±SD,(N =3).BARS LABELLED WITH DIFFERENT LETTERS ARE SIGNIFICANTLY DIFFERENT (ONE WAY ANOVA IN CONJUNCTION WITH TUKEY'S TEST FOR MULTIPLE COMPARISONS, P <0.05). ... 47 FIGURE 10STANDART LENGTH-SL AND TOTAL LENGTH-TL (MM) OBSERVED IN ZEBRAFISH LARVAE FED WITH DIFFERENT DIETS: CONTROL (CTRL), DIET SUPPLEMENTED WITH 0.5 MG SE KG-1DW OF SE-ENRICHED YEAST
(LEV) AND DIETS SUPPLEMENTED WITH SE-FORTIFIED I.GALBANA T-ISO, 0.5 MG SE KG-1DW OF (MA1) AND
2 MG SE KG-1DW(MA2).SAMPLES WERE COLLECTED AT 5,15 AND 31 DAYS POST FERTILIZATION (DPF).
BARS SHOW MEANS ± SD DEVIATION, (N = 3). BARS LABELLED WITH DIFFERENT LETTERS ARE SIGNIFICANTLY DIFFERENT (TWO-WAY ANOVA P <0.05). ... 49 FIGURE 11WEIGHT (G) OBSERVED IN ZEBRAFISH LARVAE FED WITH DIFFERENT DIETS: CONTROL DIET (CTRL),
DIET SUPPLEMENTED WITH 0.5 MG SE KG-1 OF SE-ENRICHED YEAST (LEV) AND DIETS SUPPLEMENTED WITH
SE-FORTIFIED I.GALBANA T-ISO, 0.5 MG SE KG-1 OF (MA1) AND 2 MG SE KG-1(MA2). SAMPLES WERE COLLECTED AT 5,15 AND 30 DAYS POST FERTILIZATION (DPF).BARS SHOW ±SD DEVIATION (N =3).BARS LABELLED WITH DIFFERENT LETTERS ARE SIGNIFICANTLY DIFFERENT (TWO-WAY ANOVA P <0.05). ... 50
FIGURE 12EXAMPLES OF MOST COMMON DEFORMITIES OBSERVED IN ZEBRAFISH LARVAE UNDER DIFFERENT SE SUPPLEMENTED DIETS.A)DEFORMITIES AFFECTING OF CAUDAL FIN AFFECTING FIN RAYS AND CAUDAL FIN VERTEBRAE;B)FUSIONS AFFECTING CAUDAL VERTEBRA NEURAL AND HAEMAL ARCHES AND HYPURALS;C) DEFORMITY IN NEURAL AND HAEMAL ARCHES AND COMPRESSION IN HAEMAL VERTEBRA;D)DEFORMITIES AFFECTING CAUDAL FIN RAYS. ... 51
FIGURE 13 INCIDENCE OF LORDOSYS-SCOLIOSIS-KYFOSIS (LSK; %) IN THE CAUDAL FIN AREA. ZEBRAFISH INDIVIDUALS WERE SUBJECTED TO DIFFERENT DIETS: CONTROL DIET (CTRL), DIET SUPPLEMENTED WITH 0.5 MG SE KG-1 OF SE-ENRICHED YEAST (LEV) AND DIETS SUPPLEMENTED WITH SE-FORTIFIED I.GALBANA T-ISO,
0.5 MG SE KG-1 OF (MA1) AND 2 MG SE KG-1(MA2).SAMPLES WERE COLLECTED AT 31DPF.BARS SHOW MEANS ±SD DEVIATION(N =3).BARS LABELLED WITH DIFFERENT LETTERS ARE SIGNIFICANTLY DIFFERENT
(TWO-WAY ANOVA P <0.05). ... 53 FIGURE 14INCIDENCE OF DEFORMITIES (%) BY SKELETAL ZONES (W- WEBERIAN VERTEBRAE,PC- PRECAUDAL VERTEBRAE, C- CAUDAL VERTEBRAE AND CF –CAUDAL FIN VERTEBRAE) IN ZEBRAFISH SUBJECTED TO DIFFERENT DIETARY SE TREATMENTS: CONTROL DIET (CTRL), DIET SUPPLEMENTED WITH 0.5 MG SE KG-1
DW OF SE-ENRICHED YEAST (LEV) AND DIETS SUPPLEMENTED WITH SE-FORTIFIED I.GALBANA T-ISO, 0.5
MG SE KG-1DW OF (MA1) AND 2 MG SE KG-1DW(MA2).SAMPLES WERE COLLECTED AT 31DPF.BARS SHOW MEANS ± SD DEVIATION (N = 3). BARS LABELLED WITH DIFFERENT LETTERS ARE SIGNIFICANTLY DIFFERENT (TWO-WAY ANOVA, P <0.05). ... 54 FIGURE 15INCIDENCE OF DEFORMITIES (%) BY CAUDAL FIN STRUCTURES:[PH]- CAUDAL FIN PARHYPURAL;[HY
1-2]- CAUDAL FIN HYPURAL 1 AND 2; [HY 3-5]- CAUDAL FIN HYPURAL 3, 4 AND 5; [FR]-FIN RAYS.
ZEBRAFISH INDIVIDUALS WERE SUBJECTED TO DIFFERENT DIETS: CONTROL DIET (CTRL), DIET SUPPLEMENTED WITH 0.5 MG SE KG-1 OF SE-ENRICHED YEAST (LEV) AND DIETS SUPPLEMENTED WITH SE
-FORTIFIED I.GALBANA T-ISO, 0.5 MG SE KG-1 OF (MA1) AND 2 MG SE KG-1 (MA2). SAMPLES WERE COLLECTED AT 31 DPF. BARS SHOW MEANS ±SD DEVIATION(N = 3).BARS LABELLED WITH DIFFERENT LETTERS ARE SIGNIFICANTLY DIFFERENT (TWO-WAY ANOVA P <0.05). ... 54
TABLES LIST
TABLE 1COMPOSITION OF THE MODIFIED ALGAL MEDIUM (CONCENTRATED 1000×) USED THROUGHOUT THIS WORK. ... 19
TABLE 2CALIBRATION CURVE AND CORRELATION COEFFICIENT FOR EACH DETECTED FAME(Y: PEAK AREA; X:
CONCENTRATION µG G-1). ... 26
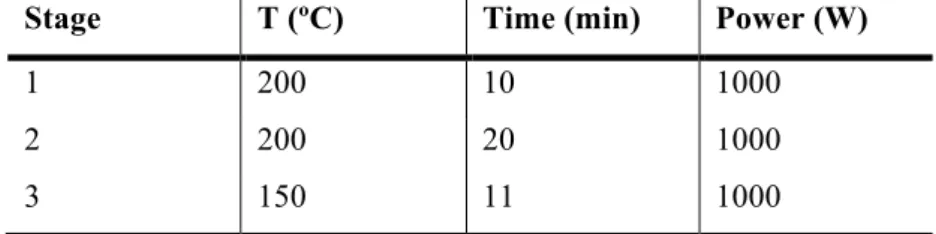
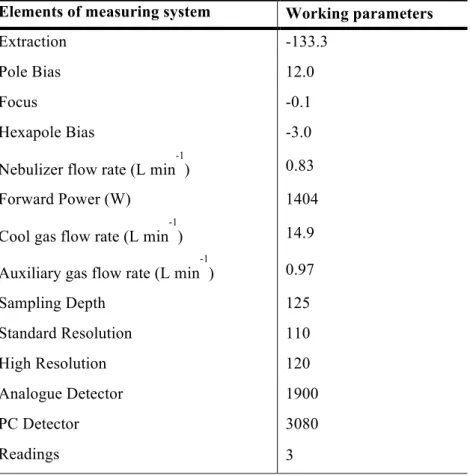
TABLE 3MICROWAVE DIGESTION PROGRAM FOR DETERMINATION OF TOTAL SELENIUM IN MICROALGAE. ... 27 TABLE 4 ICP-MS WORKING CONDITIONS FOR TOTAL SE DETERMINATION, OPERATING WITH ARGON (AG). ... 29 TABLE 5MICROWAVE DIGESTION PROGRAM FOR TOTAL SELENIUM DETERMINATION IN AF AND ZEBRAFISH
SAMPLES. ... 29
TABLE 6STANDARD DIETS COMPOSITION (%). ... 32
TABLE 7COMPARISON BETWEEN TOTAL SE CONTENT (MG KG -1) BETWEEN AAS AND ICP-MS FOR I. GALBANA
CONTROL WITH NO SE ADDITION (ISO-CTRL) AND FOR ISO-20(CULTIVATED UNDER 20 MG SE L-1).DATA REPRESENTED BY MEANS ±SD(N =3). ... 41
TABLE 8BIOCHEMICAL COMPOSITION OF I. GALBANA GROWN WITHOUT SE ADDITION (ISO-CTRL) AND FOR ISO-20(CULTIVATED UNDER 20 MG SE L-1).DATA REPRESENTED BY MEANS ±SD, N =3. ... 43
TABLE 9FAME PROFILE OF MICROALGAE GROWN UNDER DIFFERENT CULTURE CONDITIONS (CONTROL CONDITIONS AND TREATMENT SUPPLEMENTED WITH SE AT 20 MG L-1).VALUES ARE REPRESENTED IN
PERCENTAGE OF TOTAL FAME±SD DEVIATION. N.D.= NOT DETECTED,(N =4). ... 44
TABLE 10COMPARISON BETWEEN TOTAL SE CONTENT (MG KG -1) IN A-CTRL(ARTEMIA CONTROL WITH NO SE ADDITION) AND A-SE (ARTEMIA SE-FORTIFIED WITH ISO- CULTIVATED UNDER 20 MG SE L-1).DATA REPRESENTED BY MEANS ±SD(N =3).MEANS WITH DIFFERENT LETTERS ARE SIGNIFICANTLY DIFFERENTS
(STUDENT T TEST, P <0.05). ... 46
TABLE 11SURVIVAL (%) OF ZEBRAFISH DURING 31 DAYS TRIAL AND SUBJECTED TO DIFFERENT DIETS: CONTROL
(CTRL), DIET SUPPLEMENTED WITH 0.5 MG SE KG-1DW OFSE-ENRICHED YEAST (LEV) AND DIETS SUPPLEMENTED WITH SE-FORTIFIED I.GALBANA T-ISO, 0.5 MG SE KG-1DW OF (MA1) AND 2 MG SE KG-1
DW(MA2).VALUES ARE REPRESENTED BY THE MEANS ±SD DEVIATION (N =3).DIFFERENT LETTERS ARE SIGNIFICANTLY DIFFERENT (ONE WAY ANOVA IN CONJUNCTION WITH TUKEY'S TEST FOR MULTIPLE
COMPARISONS, P <0.05). ... 48
TABLE 12TOTAL NUMBER OF DEFORMITIES AND AVERAGE Nº OF DEFORMITIES PER ZEBRAFISH LARVAE SUBJECTED TO DIFFERENT DIETARY TREATMENTS: CONTROL (CTRL), DIET SUPPLEMENTED WITH 0.5 MG SE KG-1DW OF
SE-ENRICHED YEAST (LEV) AND DIETS SUPPLEMENTED WITH SE-FORTIFIED I.GALBANA T-ISO, 0.5 MG SE KG
-1DW OF (MA1) AND 2 MG SE KG-1(MA2)DW.VALUES ARE REPRESENTED BY MEANS ±SD DEVIATION.
DIFFERENT LETTERS ARE SIGNIFICANTLY DIFFERENT (ONE WAY ANOVA IN CONJUNCTION WITH TUKEY'S TEST FOR MULTIPLE COMPARISONS, P <0.05) ... 52
ABBREVIATIONS LIST
AAS Atomic absorption spectrometer AF Artemia franciscana
AFDW Ash free dry weight ANOVA Analysis of variance CC Cellular concentration CCMAR Centro de ciências do mar DHA Docosahexaenoic acid DPF Days post fertilization
DW Dry weight
EC European commission
EDTA Ethylenediamine tetraacetic acid EPA Eicosapentaenoic acid
FA Fatty acids
FAME Fatty acid methyl esters
GC-MS Gas chromatography with mass spectrometry GSH-Px Glutathione peroxidase
HPLC-ICP-MS High performance liquid chromatography coupled with inductively coupled plasma mass spectrometry
ICP-MS Inductively coupled plasma mass spectrometry IPQ Instituto português da qualidade
LES Laboratório de engenharia sanitária
Met Metionine
MRL Maximum residue limit
MUFA Monounsaturated fatty acids
n.d not detected
NIST National Institute of Standards and Technology, U.S. Department of Commerce
OD Optical density
PBS Phosphate buffer sodium PUFA Polyunsaturated fatty acids ROS Reactive oxygen species
SD Standard deviation
Se Selenium
SeCys Selenocysteine SeMet Selenomethionine SFA Saturated fatty acids TFA Total fatty acids
TL Total length
1
INTRODUCTION
Selenium (Se) is an essential trace mineral that, due to its antioxidant and anticancer properties (Thiry et al., 2012), has substantial health benefits for both humans and animals (Umysová et al., 2009)
Nutritionists recommend an increase in the consumption of products rich in Se. In case of insufficient supply through diet, Se must be obtained via supplementation products, increased consumption of food naturally rich in Se or by previously enriched products.
Se is used as feed additive in aquaculture in order to achieve the mineral concentration required for organism development (Elia et al., 2011) and for its role in immunity and fish health (Rider et al., 2009). This micronutrient is usually used in its inorganic forms: selenite (SeO32-) and selenate (SeO42-), but higher bioavailability and lower toxicity are attributed to
the organic form: selenomethionine (SeMet; Doucha et al., 2009). Experimental studies suggest that natural supplements, such as Se-enriched biomass of microalgae, are more effective for Se-supplementation when Se is in the bioavailable form of SeMet (Schrauzer, 2000; Gojkovic et al., 2014).
Vertebrates and invertebrates are unable to produce SeMet, which makes them dependent on lower trophic level organisms, such as algae, to synthesize and supply it (Williams et al., 1994). Thus, algal communities play a key role in the biotransformation (Besser et al., 1993; Bowie et al., 1996; Dobbs et al., 1996; Riedel et al., 1996; Reunova et al., 2007) and bioaccumulation of Se throughout the food net (Williams et al., 1994) as shown in Figure 1.
Incorporation of Selenium on microalgae as supplement to artemia and zebrafish
2
SeMet obtained from algal biomass can be used either as natural food supplement in order to fulfill the requirements of Se in farmed fish (Thiry et al., 2012) or to maintain a suitable Se status in humans (Schrauzer, 2000; Brown & Arthur, 2001; Ahsan et al., 2014; Hatfield et al., 2014).
Figure 1 Se trophic cycle in the aquatic food web (adapted from Hasanzzaman et al., 2010; Latorre et al., 2013). Microalgae assimilate dissolved Se in the form of selenate (SeO42-) or selenite
(SeO32-) from the environment and converted to organic Se (SeMet and SeCyst). Circulation of Se
between water to phytoplankton, zooplankton and final consumers occurs via biological transformation of inorganic forms (green pathway) to organic Se (red pathway), with benefits to either fish or humans.
Isochrysis galbana T-ISO was selected due to its high level of polyunsaturated fatty acids (PUFA), in particular of the high-value docosahexaenoic acid (DHA) (Beaudoin et al., 2002). Therefore, microalgae Se-enriched biomass can provide high levels of organic-Se
coupled with other valuable micronutrients (e.g. fatty acids, carotenoids; Li et al., 2003; Umysová et al., 2009; Fournier et al., 2010; Vitová et al., 2011),
In this context, the present thesis focused on the production of Se-enriched microalgal biomass for different biotechnological purposes, mainly for food supplements and for feed manufacture for the aquaculture industry.
The experimental work assessed the capacity of the marine alga I. galbana T-ISO to incorporate inorganic Se. Afterwards, microalgal biomass was used in the supplementation process of live and inert feeds aiming to increase the productivity of cultured aquatic animals and determine the implication of Se in the morphological and osteological development of a vertebrate model - zebrafish. The process of transference along the food chain was also considered of major relevance, since fish is becoming an interesting source of Se for humans (Thiry et al., 2012).
SELENIUM 1.1.
Se was discovered in 1817 by the Swedish chemist Jöns Jacboc Berzelius and was named after the Greek goddess of the moon “Sêlêne” (Lenz & Lens, 2009). It belongs to group VI of the periodic table, and has four oxidative states (-2, +1, +2 and +6), presenting therefore redox functions, reducing peroxides radicals (O22−) to neutral forms (O2; Pacini et
al., 2013). Se activity is mainly related to selenoproteins (Gojkovic et al., 2013), which act as integral part of the immune and antioxidant systems as well as of the metabolism of the thyroid hormone, (Brown & Arthur, 2001).
Se is a micronutrient essential for normal life processes (Köhrle, 2004; Wang et al., 2007) and for the preservation of an optimal health status (Rayman, 2000; Brown & Arthur, 2001; Rider et al., 2009). Se-antioxidant defense in animal cells maintains the integrity of the cellular membrane and reduces the oxidative damage of biological compounds namely lipids, lipoproteins, and DNA (Rayman, 2000).
However, the limit that defines the beneficial and toxic Se concentrations in vertebrates is narrow (Dörr et al., 2008a, 2013b). Se toxicity is dependent on its speciation, target species, type of exposure and environmental aspects (EPA, 2004), and small
Incorporation of Selenium on microalgae as supplement to artemia and zebrafish
4
concentration variations can have significant consequences on health and performance of the organisms (Hedaoo et al., 2008; Ahsan et al., 2014).
In aquatic environments, it is possible to find Se in inorganic forms as selenate and selenite (Dörr et al., 2008) and their proportion depends on the pH and presence of organic matter (Schiavon et al., 2012). Selenite dominates under reducing conditions while selenate is present in alkaline waters (Plant et al., 2004; Chapman et al., 2011; Schiavon et al., 2012). Both inorganic Se species present high bioavailability and bioaccumulation potential for microalgae biotechnology (Lenz & Lens, 2009).
Se organic forms include selenocysteine (SeCys) and selenomethionine (SeMet) (Dörr et al., 2008) and these are the most commonly Se forms found in fish. Usually SeMet contents increase with the degree of exposure to Se (Phibbs et al., 2011; Pacini et al., 2013). SeMet is considered to be more bioavailable for metabolic processes, since it is readily incorporated into proteins, (Kouba, 2014; Le & Fotedar, 2014).
SeCys is part of the active center of the enzyme glutathione peroxidase (GSH-Px), which is a very important antioxidant enzyme involved in the protection of cells from damage caused by free radicals (Rotruck et al., 1973; Wang et al., 2007). In addition, GSH-Px protects tissues by reducing peroxides (Wang et al., 2007) preventing the propagation of free radicals and reactive oxygen species (ROS; Brown & Arthur, 2001). The activity level of this enzyme can also be an effective way to estimate the bioavailability of Se (Wang et al., 2007).
Recent studies highlight the benefits of organic-Se when compared with sodium selenite due to its increased uptake, low capacity to induce lipid peroxidation, higher capacity to induce GSH-Px (Rider et al., 2009) and less toxicity at higher doses (Wang & Lovell, 1997).
Although organic-Se compounds are considered as the best long-term solution to prevent Se deficit, the inorganic-Se, in the form of selenite, has the ability to act faster to fulfill Se requirements (Thiry et al., 2012). Moreover, some authors still recommend this inorganic form due to its lower price, because the highest costs for aquaculture production are usually associated with feed purchase (Chiu et al., 2010). Conversely, recent studies argue that supplementation of Se from natural food materials in the form of organic-Se is safer and suitable as compared with consumption of inorganic-Se (Huang et al., 2007).
SELENIUMINAQUACULTURE 1.2.
MICROALGAE 1.2.1.
Marine microalgae production is mainly linked to animal feed in the aquaculture sector due to its high content of PUFA, pigments and antioxidants. Moreover, these organisms are considered as a promising source for new products and may generate added value compounds with potential biological activities (Pulz & Grass et al., 2004; Spolaore et al., 2006).
Algal communities play a key role in the cycle of Se since they are able to incorporate selenate and selenite from the water column and partially convert it into organic-Se (Geoffroy et al., 2007).
Se is incorporated into the food chain through bioaccumulation and biomagnification (Phibbs et al., 2011) and its exposure at the base of the food web is crucial to the aquatic systems defining the Se concentrations in higher consumers (Ponton & Hare 2013). Resulting concentration in the algal biomass can be much higher than that in the surrounding media (Yamaoka et al., 1999; Li et al., 2003; Kramárová et al., 2012). In tissues of consumers, it can reach concentrations 2000 times higher than those present in lower trophic organisms (Lenz & Lens, 2009).
Microalgae exhibit greater bioaccumulation of Se, reaching higher cellular concentrations as compared to macroalgae (Geoffroy et al., 2007; Reunova et al., 2007; Umisová et al., 2009; Fournier et al., 2010).
Se distribution in algal cells varies among species and can be incorporated into amino acids, proteins, soluble carbohydrates and lipids (Bottino et al., 1984; Vandermeulen & Foda, 1988; Doblin et al., 1999; Li et al., 2003). In Arthrospira platensis and Dunaliella salina selenite accumulation was associated with proteins; well lipids seem to be primarily in P. tricornutum, (Wang et al., 2003).
Se has been identified as an important component of selenoenzymes in several marine unicellular algae. Aquatic organisms have the highest content of selenoproteins and, so far, 12 have been identified in the green alga Chlamydomonas reinhardtii, one in the diatom Thalassiosira pseudonana and two in the haptophyte Emiliania huxleyi (Araie & Shiraiwa
Incorporation of Selenium on microalgae as supplement to artemia and zebrafish
6
2009). The highest number, however, was found in Ostreococcus tauri and Ostreococcus lucimarinus in which 26 and 29 selenoproteins have been identified, respectively (Lobanov et al., 2009). In contrast, no selenoproteins have been found in yeast and land plants, suggesting that Se may be a non-essential nutrient to these organisms (Novoselov et al., 2002).
Previous studies indicate that inorganic-Se uptake can affect the growth of marine phytoplankton (Umysová et al., 2009; Reunova et al., 2007; Schiavon et al., 2012), although the accumulation and response of microalgae to Se is highly dependent on the species (Dazhi et al., 2003; Schiavon et al., 2012), concentration and oxidation state of Se used (Pastierova et al., 2009; Umysová et al., 2009; Schiavon et al., 2012). For example, Danbara & Shiraiwa (1999) reported that E. huxleyi did not grow in absence of Se, but showed a normal growth in a medium with 10 nM of selenite. Li et al. (2003) also observed enhanced growth of A. platensis with the addition of 500 µM selenite.
Se can act as an essential micronutrient at low concentrations (Price et al., 1987; Price & Harrison, 1988; Pelah & Cohen, 2005). However, at high doses, it may present toxicity (Wong & Oliveira, 1991; Pelah & Cohen, 2005), leading to photosynthesis inhibition, decrease in algal growth rates or increased cellular damage caused by excess ROS production (Pelah & Cohen, 2005; Umysová et al., 2009; Fournier et al., 2010).
Inhibition of growth by selenate uptake has previously been observed in different microalgae strains. In D. salina, Se concentrations of 5 and 10 mg Se L-1 cuased a decrease in
growth rates, leading to the collapse of the cultures (Reunova et al. 2007). In contrast, Pelah & Cohen (2005) observed that Chromochloris zofingiensis could tolerate sodium selenite up to 100 mg L-1 while the same concentration was found to be lethal to Scenedesmus quadricauda (Vitová et al., 2011).
Studies demonstrate that algae are able to distinguish between Se species, and even if both forms are accumulated by microalgae, some show higher susceptibility to selenate over selenite, as described for Chlorella vulgaris (Simmons & Wallschläger, 2011). However, for Chaetoceros sp., Phaeodactylum tricornutum and Dunaliella tertiolecta the reverse is true (Vandermeulen & Foda, 1985, 1988; Besser et al., 1993 Riedel & Sanders, 1996; Riedel et al., 1996).
Although high concentration of both inorganic-Se forms can cause oxidative stress, Pastierova et al. (2009) found higher toxic effects using selenite than with selenate for S.
quadricauda, Desmodesmus subspicatus, C. vulgaris and Pseudokircheriella subcapitata (Vitová et al., 2011).
The different toxicity levels induced by the different inorganic-Se forms can be related to divergent transport mechanisms for each anion in the microalgae (Umysová et al., 2009). Selenate intake is regulated by the sulfate transport system, and is directly dependent and proportional to Se concentration and inversely related to sulfate concentration in the medium (Araie & Shiraiwa, 2009); for selenite, two distinct transport systems were identified, both highly dependent on Se concentration: at low concentration performed by a specific but rapidly saturated ATP-dependent active system, while at higher concentrations uptake was done by a passive non-specific transport system (Morlon et al., 2006; Araie & Shiraiwa, 2009; Fournier et al., 2010). Although, Se metabolism in microalgae is not yet fully understood, both ions may share the same metabolic pathway, being reduced to selenide (Se2; Shrauzzer, 2000) and converted to SeCyst and SeMet. The latter is non-specifically incorporated into proteins, as tRNAMet does not differentiate between methionine (Met) and SeMet (Figure 2; Kouba, 2014; Schrauzer. 2000; Daniels, 1996; Le & Fotedar, 2014).
Beneficial effects of Se to microalgal cultivation are described in some microalgal groups, and it has been demonstrated that growth of some species is enhanced or even dependent on the presence of this micronutrient. Growth rates of the cyanobacterium A. platensis were enhanced by the addition of selenate to the medium in the range of 0.5 to 40 mg L-1 (Li et al., 2003). Reunova et al. (2007) observed increased growth in populations of D.
salina with Se concentrations between 0.01 and 0.5 mg L-1.
Se uptake by algae may also be constrained by the presence of macronutrients such as phosphorus (P) and sulfur (S; Lee & Wang, 2001; Schiavon et al., 2012), and an antagonistic effect has been suggested between sulfate and selenate (Williams et al., 1994; Fournier et al., 2010; Schiavon et al., 2012). For example, the green alga Selenastrum capricornutum (Williams et al., 1994; Riedel & Sanders, 1996) presented lower selenate intake with the increase of sulfate concentration in the medium, supporting the theory of direct competition between sulfate and selenate for transport proteins (Fournier et al., 2010; Schiavon et al., 2012). Also, Umysová et al. (2009) found higher sensitivity to inorganic Se in environments with sulfur deficit in S. quadricauda (Fournier et al., 2010).
Incorporation of Selenium on microalgae as supplement to artemia and zebrafish
8
Figure 2 Schematic overview of proposed selenium metabolism in microalgae (adapted from Araie & Shiraiwa, 2009; Zhu et al., 2009). Selenate and selenite metabolic uptake in the microalgae cell. [I]: selenate-sulfate transport system; [II] – ATP dependent selenite transport system or non-specific, passive transport system. [A]- SeCys specific incorporation into proteins [B]- SeMet non-specific incorporation into proteins.
Microalgae uptake dissolved inorganic-Se in a dose-dependent manner and can accumulate significantly high Se concentrations. A dose-dependent response was reported for Chlorella sorokiniana, which accumulate 3 µg Se g-1 after 100 h of exposure to 0.05 mg L-1 selenite (Gómez-Jacinto et al., 2012).
Recently, researchers have focused their attention for the production of organic Se-enriched food. Gojkovic et al. (2013) showed that C. sorokiniana could be Se-enriched in SeMet in the presence of selenate, suggesting that this strain can be used as a biological vehicle for Se amino acids. Moreover, at a medium concentration of 40 mg L−1 of selenate the microalga reached a SeMet concentration of 140 mg kg-1 DW; Umysová et al. (2009) observed that S.
quadricauda was able to accumulate 300 mg kg-1 DW of SeMet in the presence of 50 mg L−1 of selenate; and S. platensis was able to convert inorganic Se into organic-Se (Li et al., 2003) emphasizing its potential for the production of Se-enriched microalgae (Gómez-Jacinto et al., 2012).
enriched microalgal biomass production, can help to reduce inorganic Se-supplementation in commercial feeds, being a carrier of valuable selenoaminoacids, leading to either an increase in the productivity and health of aquatic organisms or as a nutritional supplement to humans.
ZOOPLANKTON 1.2.2.
Se accumulated by aquatic producers, is transferred into intermediate trophic levels consumers (e.g. zooplankton) with further transference and accumulation in higher predators (Fan et al., 2002).
For fish aquaculture a proper feed plan is crucial for optimal development and survival rates in larval rearing. Therefore, the selection of nutritive and easily available food sources is important. Due to the small size and undeveloped digestive system of larvae, nutritional options for the larval rearing period are very limited and the use of live feeds (e.g. rotifers and artemia) is for most species, the only choice (Shields et al., 1999).
Fish larvae n the natural environment feed mainly on natural marine zooplankton- copepods, however a continuous and intensive copepods production is still not possible (Stottrup et al., 2000). The alternative remains in the relative ease production of live feeds and although rotifers and brineshrimp do not fulfill the nutritional requirements of fish larvae, they can be enriched prior feeding. (Penglase et al., 2011). Rotifers are small metazoans, with Brachionus plicatilis and Brachionus rotundiformis being the major marine species used in aquaculture for the production of more than 60 species of marine fish larvae (Penglase et al., 2010). Brineshrimp such as Artemia spp. has also been found to be a suitable feed for a diverse group of marine organisms, presenting adequate size, short generation time, high digestibility and fecundity rate (Hamre et al., 2013). Brineshrimp are considered non-selective particle feeders, being able to incorporate different products prior to feeding the larvae. This
Incorporation of Selenium on microalgae as supplement to artemia and zebrafish
10
aquatic crustacean represents a way to transfer Se-enriched algae, through “bioencapsulation” to higher vertebrate consumers.
Usually diets used in hatcheries do not supply a balanced nutritional diet, since life feeds do not meet all fish nutritional requirements. One of the main nutritional differences between rotifers and copepods is its mineral content. The higher nutritional difference is assigned to Se (Hamre et al., 2008; Penglase et al., 2010). Hamre et al. (2008) found Se values in rotifers substantially lower than in copepods, with the first in the range (0.08– 0.09 mg kg−1 dry weight (DW)) and the second (3–5 mg kg−1 DW), while Se requirements for juvenile fish are established between 0.25–0.7 mg Se kg−1 (DW) (NRC, 1993; Lin & Shiau, 2005; Penglase et al., 2010). Thus, rotifers provide insufficient Se to fulfill these needs (Penglase et al., 2011).
However, previous studies indicate that changing the nutritional value of live feeds to a stage closer to copepods can increase both quality and larval rearing success for marine fish (Park et al., 2006; Penglase et al., 2011). Penglase et al. (2011) has also suggested that such enrichment may be most effective when the mineral is delivered as an ingestible food particle instead of the usual water supplementation with the Se in the inorganic form.
FISHPRODUCTION 1.2.3.
Se is an essential trace mineral required for normal growth and physiological function of fish (Wang & Lovell, 1997) playing an important role in aquaculture productivity (Dörr et al., 2013).
This micronutrient is commonly used as an additive in order to increase diet quality (Dörr et al., 2008), enhancing larval antioxidant capacity and preventing diseases (Saleh et al., 2014), muscle atrophy and skeletal deformations (Wang et al., 2013). The European Commission (EC) established for this element a maximum residue limit (MRL) of 0.5 mg kg-1 in aquaculture feeds (Directive 70/524/CEE) in order to prevent or reduce the risks of nutritional additives for animal and human health (Regulation 882/2004 EC) and still no minimal dose is legally recommended.
et al., 2010) through the exoskeleton (Dörr et al., 2013). Fish however, can uptake both organic and inorganic Se from the diet (Chiu et al., 2010). In higher vertebrates the anterior intestine is the principal way for assimilation, and the liver the main organ for Se metabolism (Hodson & Hilton, 1983; Pacini et al., 2013), although the kidney was also indicated as the Se target tissue for different fish species (Elia et al., 2011; Huang et al., 2012; Pacini et al., 2012).
The association between SeMet and proteins leads to an increase in Se concentration in animal tissues (Burk & Hill, 1993; Wang et al., 2007), making fish muscle a proper Se source for human nutrition (Wang et al., 2007).
Se insufficiency is known to decrease growth (Wang et al., 2007), reduce feed efficiency and decrease plasma and hepatic GHS-Px activity in rainbow trout (Oncorhyncus mykiss; Hilton et al., 1980), Atlantic salmon (Salmo salar; Wang & Lovell, 1997) and channel catfish (Ictalurus punctatus; Wang & Lovell, 1997).
However, Se requirements are dependent on the Se source present in the diet (Rayman, 2000). Organic compounds are described as more bioavailable than inorganic sources (Wang & Lovell, 1997) for hybrid striped bass (Jaramillo et al., 2009) and yellowtail kingfish (Le & Fotedar, 2014). The capacity of SeMet to improve fish immune capacity has also demonstrated in channel catfish with higher antibody production (Wang & Lovell, 1997). This can be associated to SeMet higher incorporation and digestibility in fish when compared to selenite (Wang & Lovell 1997; Lorentzen et al., 1998; Cotter et al., 2003; Rider et al., 2009; Le & Fotedar, 2014). Indeed, Se derived from SeMet has been reported to increase GPx activity, of grouper (Epinephelus malabaricus; Lin & Shiau, 2009), cobia (Rachycentron canadum; Liu et al., 2010), common-carp (Cyprinus carpio; Jovanovic et al., 1997) and channel catfish (Wang & Lovell, 1997). Nevertheless, sodium selenite (Copat et al., 2014) and Se-enriched yeast are the most used sources of Se in animal feed supplementation.
Se requirement in wild fish can vary between 0.1-0.5-µg g-1 DW, however cultivated
fish need higher concentrations due to Se low bioavailability from feed (Rider et al., 2009) and lipid oxidation, resulting from PUFA-enriched feeds (Saleh et al., 2014).
Se absorption from formulated feeds can be low due to binding between Se and heavy metals (Le & Fotedar, 2014), for example, the formation of insoluble copper–Se compounds (Lorentzen et al., 1998).
Incorporation of Selenium on microalgae as supplement to artemia and zebrafish
12
Husbandry related stressors (e.g. confinement, handling, high stocking density) increase the demand for antioxidant enzymes (GSH-Px) and dietary supplementation may be necessary to meet the Se requirements in fish (Kucukbay et al., 2009). Inclusion of antioxidant factors is critical in farmed fishes not only to reach optimal growth rates but also to maintain a healthy immune system and an optimal oxidative status (Sealey & Gatlin, 2001). Gilthead seabream larvae (Sparus aurata) feed with Se-enriched diets (11.65 mg kg -1 DW) showed significantly improved survival rate and stress resistance (Saleh et al. 2014), as for European seabass (Dicentrarchus labrax) the addition of Se in the diets show to control the injuries caused by ROS leading to a reduction in half of the muscle injuries (Betancor et al., 2012).
Incapability to supplement Se in basal diets may be determinant to the health of livestock (Rider et al., 2009) leading to significant losses in the aquaculture sector from disease outbreaks (Rider et al., 2009).
Se was also described as essential for the correct fish development acting in the reduction of structural deformities. Insufficient levels of this trace mineral, can lead to effects in the ontological development of fish, as reported for common carp with signs of muscle atrophy and skeletal abnormalities (Wang et al., 2013).
SKELETAL DEFORMITIES 1.2.3.1.
Zebrafish has been recently established as vertebrate model organisms for medical research (Lawrence, 2007), frequently used in molecular and developmental research (Fishman, 2001). The relevance of this teleost fish is also increasing in other areas of research fields: e.g animal behavior, fish physiology, and toxicology (Lawrence, 2007), bringing advantages when compared to other model organisms (Fishman, 2001).
A number of favorable characteristics, including small size, high fecundity, transparency during early embryogenesis and rapid development and regeneration, has made this species a potential model for human disease (Lamason et al., 2005; Lawrence, 2007). Zebrafish has still become one of the most used model organisms, for the study of bone development, growth and remodeling (Fleming et al., 2005).
Bird & Mabee (2003) defined zebrafish axial skeleton as being composed of 31 vertebrae, which are divided into 4 weberian, 10 pre-caudal and 17 caudal vertebra including 3 caudal fin vertebra modified in order to support the caudal fin. Caudal fin represents the most affected area for zebrafish deformities (Bensimon-Brito et al., 2010). Internal skeleton of the caudal fin is formed by hypurals (1 to 5), parhypural, and modified haemal arches (Gavaia et al., 2006).
Morphological anomalies represent one of the most important problems of the marine aquaculture sector (Georgakopoulou et al., 2010) observed with higher incidence in intensive rearing conditions compared to natural environment (Boglione et al., 2001; Georgakopoulou et al., 2010; Gil-Martens, 2010). Koumoundouros et al. (2010) reported that 7 to 20% of aquaculture larvae were affected by skeletal abnormalities, yet in the study from Boglione et al. (2013) deformities reached values close do 90% of total larvae.
Marine fish larvae are highly susceptible to skeletal anomalies, as they undergo major functional and anatomic modifications during the early developing stages (Cahu et al., 2003). Deformities have been reported to occur as a result of environmental quality (Gil-Martens, 2010), genetics (Gjerde et al., 2005) and nutritional factors (Ornsrud et al., 2004). Adequate rearing conditions and nutrition is of major importance for improved larvae quality and determine the requirements (e.g. mineral and vitamins) of reared earl life stages for sustaining growth and development (Gil-Martens, 2010). Skeletal deformities represent also an important ethical issue for fish welfare. Aquaculture organisms can suffer high levels of stress and the swimming and feeding capacity can be compromised (Hansen et al., 2009; Gil-Martens, 2010). In aquaculture-farmed fish, the most common malformations of the vertebral column are lordosis, kyphosis, scoliosis, and fusions in vertebrae (Boglione et al., 2013).
Direct negative effects on both the market value and the production cost are often associated with the decrease of the biological performances of hatchery-reared fish, as survival decrease (Boglione et al., 2001, 2013), growth depression (Hansen et al., 2009) and higher susceptibility to diseases, stress and bacteria (Koumoundouros et al., 2010). The percentage of larvae that can survive from a skeletal malformation is very low (Andrades et al. 1996). This is associated with high economical consequences for the hatchery, since fish with malformations have low or no market value (Gil-Martens, 2010).
Incorporation of Selenium on microalgae as supplement to artemia and zebrafish
14
IMPACTOFSELENIUMONHUMANHEALTH
1.3.
Se is an essential nutrient to human biology and nutrition (Brown & Arthur, 2001). Several studies have been carried out regarding the role and importance of this element in human health and its absence is linked to Se-dependent metabolic processes and occurrence of certain diseases (Brown & Arthur, 2001; Rayman, 2004; Copat et al., 2014).
Being part of at least 30 human selenoproteins, Se is involved in important metabolic pathways, as the immune defense system, thyroid hormone metabolism, antioxidant defense systems and reproductive performance (Kumar & Priyadarsini, 2014).
Recent evidences have reinforced the role of Se in the prevention of disorders such as cancer, inflammatory diseases, neurodegeneration, infertility and infections diseases (Doucha et al., 2009). Moreover, the lack of this mineral can lead to heart disease and hypothyroidism (Pelah & Cohen, 2005).
Se bio-effects depend on its concentration; inadequate supply may result on long-term health implications, which affect 0.5 to 1 billion people worldwide (Haug et al., 2007).
In Europe, the recommended daily intake is between 60-70 µg per day in adults, although this concentration is not obtained from the usual diet in many European countries (Rayman, 2000). So, to raise this value, animal feeds are often enriched with Se supplements, frequently in the inorganic form (Doucha et al., 2009).
The maximum recommended Se consumption has been set for to the US Food and Nutrition Board, at 400 µg Se day-1 in the USA (Thiry et al., 2012) and 300 µg Se day-1 in Europe (SCF, 2000). The Se essentiality or toxicity only differs by one order of magnitude, reinforcing the need to control the Se supply (Lenz & Lens, 2009).
OBJECTIVES 1.4.
The main aim of this work was to assess the potential of Se-enriched microalga biomass on the growth performance and osteological development of zebrafish. In order to achieve the main objective, several specific goals were established:
I. Optimize the incorporation of inorganic Se (selenite, SeO42-) in the
marine microalga Isochrysis galbana. Research was centered on the defining the optimum selenate concentration for enhanced incorporation of Se in microalgal biomass.
II. Produce enough Se-enriched microalgal biomass for the formulation of the microdiets. Incorporate Se-enriched alga in brine shrimp (Artemia spp.) nutrition.
III. Evaluate the effect of different Se sources and concentrations on the model organism zebrafish (Danio rerio) using formulated microdiet.
Incorporation of Selenium on microalgae as supplement to artemia and zebrafish
16
2
MATERIAL
&
METHODS
The experimental work was performed between February 2014 and June 2015 at: 1) Centre of Marine Sciences (CCMAR), University of Algarve (UALG), Faro; 2) the Sanitary Engineering Laboratory (LES), UALG, Faro; and the National Health Institute Dr. Ricardo Jorge, Lisbon, Portugal. All organisms, namely Isochrysis galbana T-ISO, Artemia franciscana and Danio rerio were provided by CCMAR through an established cooperation between the research groups MarBiotech and EDGE. The experimental work of this project was divided in three main parts:
I: Optimization of selenate (SeO42-)incorporation in the marine microalga I. galbana
T-ISO;
II: Production of Se-enriched microalgal biomass and incorporation in Artemia franciscana for the formulation of experimental microdiets.
MICROALGAE 2.1.
EXPERIMENTALDESIGN
2.1.1.
In the first part of the work, different growth parameters were determined, namely optical density (OD), cellular concentration (CC) and dry weight (DW), in order to optimize Se incorporation in I. galbana. Calibration curves for I. galbana (CC vs. OD and DW vs. OD) were established to facilitate the growth optimization of cultures.
To investigate Se accumulation, the marine microalgae was subjected to three independent trials, summarized in Figure 3:
A. Cultures were exposed to increasing selenate concentrations (0, 5, 25, 50 and 100 mg Se L-1) to assess the toxicity of Se in this microalgal strain. Since Se toxicity has not been established for I. galbana, the Se concentrations used in the trial were chosen using known toxic levels for other microalgal species (Pelah & Cohen, 2005; Reunova et al. 2007; Vitová et al., 2011).
B. Cultures were exposed to a narrower range of concentrations (0, 5, 10, 15, 20 mg Se L-1) to assess the Se concentration required for maximum incorporation in the biomass without compromising microalgal growth.
C. Cultures were scaled up and grown in medium with optimized concentration of Se (20 mg Se L-1) to obtain the amount of biomass needed to produce enough amount of microdiet for later experiments.
D. A comparative biochemical analysis between microalga cultivated in Se-supplemented medium and a non-Se-supplemented cultivation medium (control) was performed.
Incorporation of Selenium on microalgae as supplement to artemia and zebrafish
18
Figure 3 Experimental design (I) and parameters determined in the different assays performed to produce I. galbana Se-enriched biomass A) Growth curves were established; B) cultures were exposed to increasing selenate concentrations (0, 5, 25, 50 and 100 mg Se L-1) to establish the lethal Se concentration: C) in the second assay a narrower range of concentrations (0, 5, 10, 15, 20 mg Se L-1)
was tested in order to determine the maximum Se incorporation in the biomass; D) to obtain Se-enriched biomass for the following assays, cultures were grown with 20 mg Se L-1;. OD-optical density; DW- dry weight; CC-cellular concentration.
CULTURECONDITIONS 2.1.2.
Prior to inoculation, all materials were irradiated under UV and the seawater used was sterilized in an autoclave at 120 ºC to avoid culture contamination. Batch cultures of the marine microalga I. galbana were performed under controlled conditions in a specialized growth chamber (Aralab Fitoclima s 600 PL clima plus 400) at 20 ºC under continuous light (100 µmol m-2 s-1) and aeration. Cultures in the exponential phase of growth were used as
inoculum and the initial concentration of each treatment was established at 1x10⁶ cells mL-1. The culture medium used in this work was a modified ALGAL medium (1:1000) prepared with sterile seawater (Table 1), as described in Pereira et al. (2011).
Throughout the experiments, the initial volume was marked on the culture system and the water evaporation was compensated with distilled water. After reaching the stationary phase, microalgal cultures were harvested by centrifugation at 10,000 g for 15 min (Beckman Coulter Avanti J-25 High-Performance centrifuge). Obtained biomass was later freeze-dried and stored in vacuum desiccators until further analysis.
Table 1 Composition of the modified ALGAL medium (concentrated 1000×) used throughout this work. Component Concentratio Macronutrients solution (M) NaNO3 2 KH2PO4 0.1 Micronutrients solution (mM) ZnCl2 1 ZnSO4.H2O 1 MnCl2.4H2O 1 Na2MoO4.2H2O 0.1 CoCl2.6H2O 0.1 CuSO4.5H2O 0.1 EDTA-Na 6.4 MgSO4.7H2O 2 Iron solution (mM) FeCL3.6H2O 20 EDTA-Na 20
Incorporation of Selenium on microalgae as supplement to artemia and zebrafish
20
MICROALGALCULTIVATIONWITHSELENATE
2.1.3.
All growth experiments were carried out at the same controlled conditions with autoclaved seawater and ALGAL medium. The only difference in the treatments was the Se concentration used as selenate (SeO42-). A selenate stock solution was prepared by dissolving
sodium selenate in autoclaved seawater to achieve an initial concentration of 1 g L-1
(Na2SeO4, anhydrous, Sigma-Aldrich).
Selenate toxicity determination in I. galbana was performed in 1.5 L plastic bottles with a final volume of 1 L. Microalga was exposed to increasing selenate concentrations of 0, 5, 25, 50 and 100 mg Se L-1.
Afterwards, in the same experimental conditions, microalgae were cultured in medium supplemented with sub-lethal concentrations of inorganic Se tolerated by the algae (0, 5, 10, 15, 20 mg Se L-1). Total Se determination and biochemical analysis were performed after the cultures reached late stationary phase (day 21).
Subsequently, cultures were scaled-up into two different treatments: control (non-supplemented cultivation medium) and for the highest selenate concentration tolerated by the algae (20 mg Se L-1). Cultures were grown in 5-L plastic bottles until stationary phase (day 15) and the obtained biomass was used for the enrichment ofAF spp. and for the preparation of microdiets used in the zebrafish supplementation trial. Differences in total Se accumulation (summarized in section 2.4) and biochemical composition between microalga cultivated in Se-supplemented medium and a non-supplemented cultivation medium were evaluated.
GROWTHPARAMETERS 2.1.4.
Cultures were grown in 5-L plastic reactors under the aforementioned conditions (section 2.1.2). All experiments were performed in triplicate and each bottle was inoculated with 500 mL of I. galbana T-ISO, 3 L of sterile seawater and modified ALGAL medium (1:1000). Cultures were maintained until the stationary phase (day 17) was reached.
Under aseptic conditions and without water replacement, 40 mL samples were collected every two days from each culture in order to perform the OD, CC, and DW analysis. Upon individual determination of the growth parameters, a relationship between CC and OD and between DW and OD was established. Absorbance was measured at 750 nm in triplicates and the following linear equations were obtained: 𝐶𝐶 = 2𝑥10! x 𝑂𝐷750 −
758588 with a r² = 0.983 (Figure 4) and for𝐷𝑊 = 0.879 x 𝑂𝐷 + 0.0142 with a correlation coefficient r² = 0.991 (p < 0.01; Figure 7). These correlations enabled the estimation of CC and DW on further cultures trough the values of absorbance.
Figure 4 Relationship between optical density measured at 750 nm and cellular concentration (cells mL-1).
Incorporation of Selenium on microalgae as supplement to artemia and zebrafish
22
Figure 5 Relationship between optical density measured at 750nm and dry weight (g L-1 ).
CELLULAR CONCENTRATION 2.1.4.1.
CC was measured by optical microscopy, using a Neubauer chamber. Samples of 1 mL were taken from each replicate and fixed with Lugol’s solution (1:1000). Ten µL of microalgal culture, were strongly homogenized and transferred to each chamber so that the cell number in every count was between 30 and 300 cells, following the manufacturer’s specifications. When the cell count was higher, samples were diluted with seawater. Samples were counted in quadruplicate and CC for each count was calculated using the following equation [1]:
OPTICAL DENSITY 2.1.4.2.
The OD of cultures was estimated at 540 (OD540) and 750 nm (OD750) using a microplate reader (BioTek Synergy 4). In order to measure the OD, 250 µL of undiluted algal culture were pipetted per well in a 96-well plate and the absorbances were measured at both wavelengths. The absorbance selected was the 750 nm for the high correlation coefficient find between growth parameters.
DRY WEIGHT 2.1.4.3.
Glass microfiber filters (1.2 µm) were washed with 10 mL ammonium formate (31.5 g L-1) using a vacuum filtration system and left to dry for 24 hours at 60 ºC in an oven. Afterwards, the filters were placed in the desiccator for 15 minutes and weighed (initial weight). For each replicate, 10 mL of sample were filtered, rewashed with 10 mL ammonium formate and dried at 60 ºC for 48 hours, or until constant weight was obtained, and their final weight was recorded (Zhu & Lee, 1997). DW was calculated using the following equation [2]:
𝐷𝑟𝑦 𝑤𝑒𝑖𝑔ℎ𝑡 (g L!!) =!"#$#%& !"#$%&! !"#$% !"#$%&
!"#$%& !" !"# !"#$%& [2]
BIOCHEMICALANALYSIS
2.1.5.
MOISTURE AND ASH 2.1.5.1.
To assess moisture content, 10 mg of dry biomass were placed in porcelain crucibles and dried in an oven at 105 ºC for 24 hours. Subsequently, they were placed in a desiccator for 15 minutes and weighed to obtain the DW.Moisture content in the samples resulted from
Incorporation of Selenium on microalgae as supplement to artemia and zebrafish
24
the difference between initial biomass weight and DW.
Afterwards, samples were burned for 8 hours in a muffle furnace at 560 ºC for 6 hours. The crucibles were later cooled down until constant weight was achieved. Furthermore, ash free DW (AFDW) was determined by deducting both moisture and ash weight from the initial biomass weight (Widbom, 1984).
TOTAL LIPIDS 2.1.5.2.
Total lipids were determined gravimetrically using the Bligh and Dyer (1959) method with modifications. Briefly, 30 to 40 mg of freeze-dried microalga samples were weighed in test tubes. Afterwards, 0.8 mL of distilled water were added and allowed to rest for 20 minutes. Subsequently, 2 mL methanol and 1 mL chloroform were added and the mixture was homogenized with an IKA Ultra-Turrax disperser in an ice bath for 60 seconds. Later, 1 mL of chloroform was added and samples were homogenized for 30 seconds, followed by the addition of 1 mL of distilled water and a 30-s homogenization. Samples were then centrifuged for 10 min at 2000 g and the organic phase was transferred into a new tube. Finally, 1 mL chloroform was transferred to pre-weighed test tubes.
Lipid extracts were evaporated at 60 ºC in a dry bath overnight, allowed to cool in a desiccator for 3 hours and the final weight was registered. The percentage of total lipids in samples was determined using the following equation [3]:
%Total Lipid = !"#$% !"#$!!!!"!#!$% !"#$!! × !"!#$ !"#. !!!"!#!"$ (! !") !"#. !"#$%&#'!( !!!"!#!"$ (! !") !"#$%& !"
FATTY ACID PROFILE 2.1.5.3.
The fatty acid methyl esters (FAME) profile was determined resorting to gas chromatography coupled with mass spectrometry (GC-MS) through a modified protocol from Lepage and Roy (1984), as described in Pereira et al. (2012). Concisely, 20 mg of freeze-dried microalgae were transferred into derivatisation vessels. Samples were later homogenized with an IKA Ultra-Turrax disperser in a mixture of acetyl chloride and methanol (20:1, v/v) for 90 s. Then, 1 mL of hexane was added to the mixture and heated to 90 °C in a water bath for 60 minutes. Afterwards, samples were allowed to cool and 1 mL of distilled water, and 4 mL hexane were added. The mixture was vortexed for 1 minute in order to allow mass transfer from the polar to the non-polar phase, followed by phase separation by centrifugation (2000 g for 5 min). The organic phase was transferred to new vials and remaining microalgal biomass was further extracted 4 times with 4 mL of hexane. Extracts were then washed with excess anhydrous sodium sulfate to remove any residual water and filtered using 0.45-µm syringe filters. Finally, hexane was evaporated until dryness under a gentle nitrogen gas flow and further resuspended in 500 µL of gas chromatographygrade hexane. Samples were kept at -20 º C until further analysis.
Extracts were analyzed using an Agilent GC-MS (Agilent Technologies 6890 Network GC System coupled with a 5973 inert Mass Selective Detector) using an Agilent Tech DB-5MS column (length: 25 m; internal diameter: 0.250 mm; film: 0.25 µm). The injection temperature was set for 300 ºC and helium was used as carrier gas at a constant flow of 0.8 mL min-1.
Compounds were identified by comparison of the retention times of standard samples (Supelco 37 FAME Mix, Sigma-Aldrich) and the mass spectra compared to the NIST library. FAME determination was performed by the elaboration of individual calibration curves for all FAME detected (Table 2) using four dilutions from the initial standard. All samples were analyzed in triplicate.