Liquid Mixtures Involving Hydrogenated and Fluorinated Alcohols:
Thermodynamics, Spectroscopy, and Simulation
Pedro Morgado,
†Ana Rosa Garcia,
‡,§Laura M. Ilharco,
*
,‡Joa
̃o Marcos,
†Martim Anasta
́cio,
†Luís F. G. Martins,
†,∥and Eduardo J. M. Filipe
*
,††Centro de Química Estrutural and‡Centro de Química-Física Molecular, IN - Institute of Nanoscience and Nanotechnology, Complexo I, Instituto Superior Técnico, Universidade de Lisboa, Av. Rovisco Pais, 1049-001 Lisboa, Portugal
§Departamento de Química e Farmácia, FCT, Universidade do Algarve, Campus de Gambelas, 8000 Faro, Portugal
∥Centro de Química de Évora, Escola de Ciências e Tecnologia, Universidade de Évora, Rua Romão Ramalho, 59, 7000-671 Évora, Portugal
*
S Supporting InformationABSTRACT: This article reports a combined thermodynamic, spectroscopic, and computational study on the interactions and structure of binary mixtures of hydrogenated andfluorinated substances that simultaneously interact through strong hydrogen bonding. Four binary mixtures of hydrogenated andfluorinated alcohols have been studied, namely, (ethanol + 2,2,2-trifluoroethanol (TFE)), (ethanol + 2,2,3,3,4,4,4-heptafluoro-1-butanol), (1-butanol (BuOH) + TFE), and (BuOH + 2,2,3,3,4,4,4-heptafluoro-1-butanol). Excess molar volumes and vibrational spectra of all four binary mixtures have been measured as a function of composition at 298 K, and molecular dynamics simulations have been performed. The systems display a complex behavior when compared with mixtures of hydrogenated alcohols and mixtures of alkanes and perfluoroalkanes. The combined analysis of the results from different approaches indicates that this results from a balance between preferential hydrogen bonding between the hydrogenated and fluorinated alcohols and the unfavorable dispersion forces between the hydrogenated andfluorinated chains. As the chain length increases, the contribution of dispersion increases and
overcomes the contribution of H-bonds. In terms of the liquid structure, the simulations suggest the possibility of segregation between the hydrogenated and fluorinated segments, a hypothesis corroborated by the spectroscopic results. Furthermore, a quantitative analysis of the infrared spectra reveals that the presence offluorinated groups induces conformational changes in the hydrogenated chains from the usually preferred all-trans to more globular arrangements involving gauche conformations. Conformational rearrangements at the CCOH dihedral angle upon mixing are also disclosed by the spectra.
1. INTRODUCTION
It is well known that mixtures of substances involving hydrogenated andfluorinated chains, in spite of the apparent similarity of the components, show an enhanced tendency to phase separation. Indeed, mixtures of alkanes and per fluor-oalkanes exhibit extensive regions of liquid−liquid immisci-bility, large positive deviations from Raoult’s law, and large positive excess properties, such as the excess enthalpy and volume.
Although a definitive explanation for this intriguing behavior is still awaited, it has been generally interpreted as an indication of weaker than anticipated interactions between hydrocarbons and fluorocarbons. However, it should be emphasized that unlike other more common examples of phase separation, for example, water−alkanes, in the case of hydrocarbons and fluorocarbons, segregation is the result of a subtle balance between the relatively weak dispersion forces. Structural factors, such as the rigidity of fluorinated chains (as opposed to the characteristic flexibility of hydrogenated chains) and the incompatibility of cross-sectional diameters of hydrogenated
and fluorinated chains, may also contribute to the observed behavior.1,2
In much of our previous work, we have been studying the combined presence of the mutually phobic segments (hydro-genated and perfluorinated) and some form of association, hoping to clarify how it can affect the structure of the liquid and induce organization. We have accomplished a systematic study of perfluoroalkylalkanes (PFAA).3−6 These diblock com-pounds, made of alkyl and perfluoroalkyl segments covalently bonded to form a single chain, display amphiphilic character7,8 and the orientational ordering of smectogenic liquid crystals.9−11We have reported a number of properties of the pure liquid PFAA (density, vapor pressure, viscosity, and surface tension) and mixtures (partial molar volume in n-octane, solubility of water, and interfacial tension) as a function of temperature, pressure, and relative length of the hydro-Received: April 28, 2016
Revised: August 26, 2016
Published: August 30, 2016
genated andfluorinated segments. The results were interpreted comparing with equivalent properties of corresponding alkanes, perfluoroalkanes, and their mixtures.
More recently, we have directed our attention to mixtures of hydrogenated and fluorinated alcohols, in which hydrogen bonds can be seen as on−off associative interactions between the two phobic components. Following the strategy used in the study of PFAA, the results are interpreted comparing with those of mixtures of hydrogenated alcohols and mixtures of alkanes and perfluoroalkanes.
In particular, liquid mixtures of 2,2,2-trifluoroethanol (TFE) and ethanol (EtOH) were recently investigated.12 Densities were measured as a function of composition, temperature, and pressure, and the corresponding excess volumes, isothermal compressibilities, and thermal expansivities were calculated. Atomistic molecular dynamics simulations were also performed. These were able to reproduce the experimental excess enthalpies if the F−H dispersive interaction was reduced by 25% and revealed the predominance of a specific hydrogen bond between EtOH and TFE. Additionally, we have found that the reduction of the dispersive interactions has no effect on the excess volumes. This uncovered that, contrarily to what is usually assumed, the volume increase found in these systems cannot be entirely related to weak dispersive interactions between the hydrogenated and fluorinated segments and should be connected to the repulsive part of the intermolecular potential.
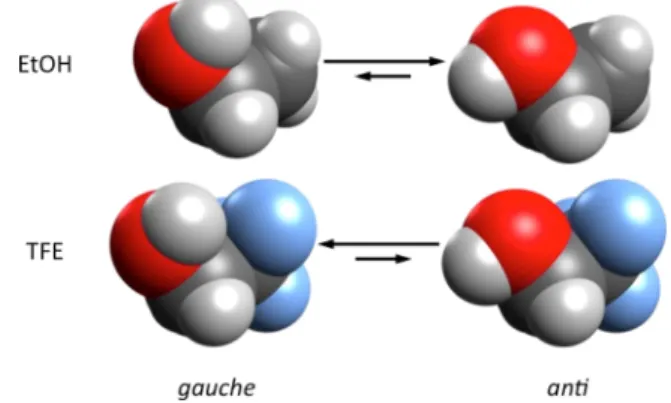
It is well known13that alcohol molecules have the tendency to form hydrogen bonds sequentially, giving rise to relatively large flexible O···HO chains zigzagging throughout the bulk alcohol. The alkyl chains are stored“the best possible way” in the spaces around the O···HO chains. These can be either linear or cyclic and their average length can vary considerably. The result is a rather organized microheterogeneous structure that reflects the difficult balance between optimizing the formation of H-bonds and packing of the alkyl segments, which is governed by dispersive and repulsive interactions. The rotational conformations of the alcohol molecules, namely, at the CCOH dihedral angle and of the alkyl chain, have a determining role in all of these interactions. By rotation over the C−O bond, rotational isomers differing in the orientation of the OH bond with respect to the C−C−O plane are allowed: anti (or trans) and gauche (or cis). For EtOH, the anti form is slightly more stable (0.49 or 2.9 kJ mol−1, depending on the technique used).14−16At 25°C, the proportions were estimated by both ab initio methods and infrared spectroscopy as 69.7% (anti) and 30.3% (gauche).17For TFE, it was shown that the gauche form prevails,18 due to the repulsion between the unshared electron pairs of oxygen and fluorine (“gauche effect”).19 The rotational isomerism equilibria for EtOH and TFE are schematized inFigure 1. The predominance of gauche isomers opens the possibility of establishing weak intra-molecular OH···F hydrogen bonds in the case of TFE.20 Alcohols with longer alkyl chains present additional rotational conformations (from all-trans to all-gauche) that will result in different three-dimensional packings. In fluorinated chains, some of the gauche conformers favor intramolecular H-bonding.
The insertion offluorinated alcohols in the structure formed by hydrogenated alcohols is expected to introduce major constraints, namely, the maximization of one type of H-bonding between like or unlike molecules and the tendency to isolatefluorinated from hydrogenated chains.
Valuable information on the nature and strength of H-bonding, both in the pure components and in binary mixtures, may be retrieved from the vibrational spectra, namely, from the spectral regions related to the OH and CF3 groups. The
modifications in chain conformations induced by the mixture may also be assessed by the analysis of the spectral regions related to the CCOH dihedral and the alkyl chain modes of the components.
This work reports a combined thermodynamic, spectro-scopic, and computational (molecular dynamics simulations) study, focusing on the interactions and structure of binary mixtures of hydrogenated andfluorinated alcohols. Four binary mixtures have been studied, namely, (EtOH + TFE), (EtOH + 2,2,3,3,4,4,4-heptafluor-1-butanol (HFB)), (1-butanol (BuOH) + TFE), and (BuOH + HFB). Excess molar volumes of (EtOH + HFB), (BuOH + TFE), and (BuOH + HFB) systems and infrared spectra of all of the binary mixtures have been measured as a function of composition, at 298 K, and molecular dynamics simulations have been performed. The excess molar volumes obtained for (EtOH + TFE) systems in a previous work12 were also considered. Comparing the thermodynamic results with the structural information obtained from the infrared spectra and the molecular dynamics simulations, it was possible to clarify the conformational rearrangements and the intermolecular interactions in the studied mixtures, induced by fluorination of one component.
2. EXPERIMENTAL SECTION
2.1. Sample Preparation. EtOH, absolute p.a., min. 99.5% v/v, was obtained from Panreac and BuOH, 99.8%, from Sigma-Aldrich, and both were kept over 4 Å molecular sieves. TFE, 99%, supplied by Apollo Scientific, was distilled over calcium sulfate and stored in tightly closed bottles under dry nitrogen, whereas HFB, 98%, also from Apollo Scientific, was distilled over potassium sulfate and then stored over 4 Å molecular sieves. The water content of the alcohols was checked by Karl Fischer coulometry and did not exceed 300 ppm. The mixtures were prepared by weight, in screw-cap vials, under a stream of dry nitrogen.
The density results for the pure EtOH, BuOH, and TFE were compared to the values proposed by Cibulka et al.,21,22 which are based on a critical compilation of literature data. Our measurements agree within 0.002% for EtOH and 0.3% for BuOH and TFE. The density of HFB agrees with the results already obtained by our group within 0.2%.23
Figure 1. Rotational conformers of EtOH and TFE: gauche (C1
symmetry) and anti (Cs symmetry). The arrows suggest the
equilibrium displacements at 25°C.17,18
2.2. Excess Volumes. The excess volumes at 298.150 K were determined by densimetry, using an Anton Paar DMA 5000 vibrating-tube densimeter. The instrument was calibrated with water (distilled, purified with a Millipore water purification system and freshly boiled) and air at 293.150 K, taking into account atmospheric pressure. The calibration was checked with water over the whole range of operating temperatures, and the maximum deviation from the literature values was found to be less than±0.00002 g cm−3. The air density was verified at the beginning of each series of measurements to ensure the cleanliness of the measurement cell.
2.3. Infrared Spectra. The spectra of the pure components and their mixtures were obtained in transmission mode, placing two drops between polished KBr disks. Each spectrum is the result of ratioing 100 co-added scans of the sample to the same number of background scans (clean KBr disks). A Mattson Research Series 1 Fourier transform infrared spectrometer was used, with a wide band MCT detector (400−4000 cm−1), with a resolution of 2 cm−1. The spectra are presented in absorbance units, without baseline correction.
3. MOLECULAR DYNAMICS SIMULATIONS
The behavior of the (hydrogenated + fluorinated) alcohol mixtures was also studied with molecular dynamics simulations, using models based on the atomistic optimized potential for liquid simulations all-atom (OPLS-AA) forcefield.24
All of the necessary potential parameters for EtOH and BuOH were published in the original OPLS-AA papers,24,25and the model for TFE was also developed by the same group.26,27 The model of HFB used in the present work was built by taking the force-field parameters of the (−CF2−CH2−OH) segment from the model of TFE and those of the perfluoroalkyl “tail” (CF3−CF2−) from the OPLS-AA work on perfluoroalkanes;
25
the remaining dihedral torsion parameters were taken from the work of Pádua,28and the partial charge of the carbon atom in thefirst −CF2− group was adjusted to give the molecule a net
zero charge.
The interactions between different Lennard-Jones sites were calculated using the geometrical mean rule for both size and energy, according to the OPLS parameterization. The cross-interaction energy and the cross-cross-interaction diameter between alkyl hydrogen atoms and perfluoroalkyl fluorine atoms were allowed to depart from the geometrical mean to capture the weak unlike interactions between hydrogenated andfluorinated chains and match the experimental excess properties.
The simulations were performed using the DL_POLY Classic simulation package,29with systems containing between 300 and 500 total molecules in cubic simulation boxes with periodic boundary conditions in all directions. The simulations were started from low-density lattice arrangements of the molecules and then pre-equilibrated in the NpT (isothermal− isobaric) ensemble until an approximately constant density was reached. The systems were then equilibrated for at least 0.5 ns, followed by a 5 ns production run in the NpT ensemble at 298 K and 1 bar, controlled by the Nosé−Hoover thermostat and barostat. All bonds involving hydrogen atoms were constrained to their equilibrium lengths using the SHAKE algorithm, and a time step of 2 fs was used for the integration of the equations of motion. The intermolecular interactions were calculated with a 14 Å cutoff, with Ewald sum calculations for the long-range electrostatics and analytical tail corrections for the dispersion terms.
The enthalpies (H) of the simulated systems can be obtained from the definition
= + +
H Ucfg K pV (1)
where Ucfgis the configurational energy, K is the kinetic energy,
p is the pressure, and V is the volume. In an isothermal and isobaric mixing process, the kinetic energy of mixing is considered null and the excess enthalpy HEis given by
∑
= − *+ H U x U pV i i i E cfg cfg E (2)where xi is the mole fraction of component i and the asterisk
refers to the configurational energy of the pure substance. At the studied pressure of 1 bar, the pVEterm can be considered negligible when compared to the configurational energies and is thus neglected. This reasoning allows the identification of the excess enthalpies with the excess configurational energies and eliminates the scattering due to the considerablefluctuations in pressure. The average density values were also obtained from the simulations and used to calculate the excess volumes of the studied mixtures.
The simulation trajectories, with atomic coordinates stored at 100 time-step intervals, were further analyzed to obtain structural information, at both inter- and intra-molecular levels. Radial distribution functions (rdfs) were obtained directly from the DL_POLY outputs, and dihedral distribution functions were calculated with the TRAVIS software.30
The agreement between simulated and experimental results for the pure components was already shown to be very good for EtOH and TFE, as a function of temperature (at 5, 25, 45, and 65°C).12For BuOH and HFB, the liquid densities at 298.15 K obtained by simulation (0.800 and 1.603 g cm−3) compare favorably with the experimental data (0.80987 and 1.59533 g cm−3).
4. RESULTS AND DISCUSSION
4.1. Excess Molar Volumes. Using the (EtOH + TFE) mixtures as a starting point, the volumetric behavior of binary mixtures with increasing length of both the hydrogenated and fluorinated segments was investigated: (BuOH + TFE), (EtOH + HFB), and (BuOH + HFB).
The densities of (EtOH + HFB) and (BuOH + HFB) mixtures at 298.15 K and of (BuOH + TFE) at 293.15 K were measured and are presented in Table 1. The corresponding excess volumes were calculated and are also included inTable 1
and plotted inFigure 2, together with those of (EtOH + TFE) from previous work.12In the case of mixtures involving TFE, our results compare very favorably with those of Sassi and Atik31and of Minamihonoki et al.32As usual, the excess molar volumes were correlated with Redlich−Kister equations
= + − + −
VmE x x A1 2[ 0 A x1( 1 x2) A x2( 1 x2) ]2 (3)
The coefficients are collected inTable 2.
As can be seen in Figure 2, all four systems display large positive and fairly symmetrical excess molar volumes, which increase with the length of both the hydrogenated and fluorinated chains. For the equimolar mixtures, the excess volumes correspond to relative increases of the molar volumes of the order of 1.2, 1.5, 1.6, and 1.8% for (EtOH + TFE), (BuOH + TFE), (EtOH + HFB), and (BuOH + HFB), respectively.
Mixtures of primary hydrogenated alcohols display extremely small positive excess volumes that slightly increase with the difference in chain length (mixtures of n-alkanes mix with
negative excess volumes). Thus, the large positive excess volumes now reported for mixtures of hydrogenated and fluorinated alcohols seem to be in line with the behavior of mixtures of (alkanes + perfluoroalkanes). However, for (alkane + perfluoroalkane) mixtures, the excess volumes increase slightly with the perfluorocarbon chain length but decrease significantly with the size of n-alkane,33whereas in the present case, the excess volumes increase with the length of both the hydrogenated and fluorinated chains. In our opinion, this reflects the less efficient packing of the hydrogenated and fluorinated segments when constrained by the network of hydrogen bonds.
The excess volumes calculated from the molecular dynamics simulations for all of the mixtures are compared with the experimental values inFigure 2. When a 25% reduction of the H−F dispersion energy is introduced, the simulated excess volumes largely underestimate the experimental values, although correctly predicting relatively large positive excess volumes for all systems. This indicates that the model is able to capture the part of the effect resulting from the new hydrogen-bond structure. The trend is also not well predicted, and the differences between the experiment and simulation seem to increase with chain length (and thus VE
m). A couple of
comments should be made about this result.
The inability of the MD simulations to predict the absolute value of VEm was already noticed for the (EtOH + TFE)
mixture.12More importantly, we have confirmed that the VEm
predictions are practically unaffected by the 25% reduction of the unlike H−F interaction. This fact can already be observed in the studies of (alkane + perfluoroalkane) mixtures found in the literature1 but apparently has been overlooked by the Table 1. Liquid Densities and Excess Molar Volumes of
Mixtures of Hydrogenated and Fluorinated Alcohols at 298.15 K
BuOH + TFE (at 293.15 K) EtOH + HFB x
(TFE) ρ/g cm−3 VE/cm3mol−1 (HFB)x ρ/g cm−3 VE/cm3mol−1
0 0.80987 0 0 0.78520 0 0.100 0.85298 0.383 0.215 1.06906 1.045 0.199 0.89824 0.641 0.432 1.26613 1.446 0.400 0.99641 1.115 0.593 1.37859 1.422 0.494 1.04702 1.195 0.733 1.46064 1.215 0.601 1.10675 1.267 0.818 1.50529 1.028 0.699 1.16923 1.073 1 1.59533 0 0.800 1.23589 0.917 0.900 1.30941 0.548 1 1.39114 0 HFB + BuOH x (HFB) ρ/g cm−3 VE/cm3mol−1 (HFB)x ρ/g cm−3 VE/cm3mol−1 0 0.80595 0 0.486 1.22502 1.972 0.086 0.88938 0.631 0.512 1.24469 1.987 0.120 0.92109 0.793 0.670 1.35912 1.855 0.189 0.98295 1.200 0.780 1.43523 1.604 0.302 1.08014 1.611 0.901 1.51697 1.074 0.305 1.08230 1.606 0.917 1.52786 0.934 0.393 1.15295 1.855 1 1.58806 0
Figure 2. Excess molar volumes of mixtures of hydrogenated and fluorinated alcohols. Filled symbols: experimental results; empty symbols: simulation results; dashed lines,ξ = 0.75 and η = 1; solid lines, ξ = 0.80 and η = 1.013, 1.020, 1.030, and 1.035, for (EtOH + TFE), (BuOH + TFE), (EtOH + HFB), and (BuOH + HFB), respectively.
authors. In our opinion, this is a very relevant result, revealing that the volume increase when mixing hydrogenated and fluorinated chains is not entirely related to weak dispersive interactions and should be connected to the repulsive part of the intermolecular potential.
Thus, we have tried to bring agreement between the simulation results and the experimental excess volumes by introducing a size binary interaction parameter,η, to model the unlike H−F interaction, in addition to the energy binary interaction parameter,ξ
σHF=η σHH FFσ (4)
εHF =ξ εHH FFε (5)
For the (EtOH + TFE) mixture, simultaneous agreement of VEmand HEmwas attained with ξ = 0.80 and η = 1.013. The
same energy binary interaction parameter,ξ, was then used for all other systems. As expected, very small size corrections are needed:η = 1.020, 1.030, and 1.035, respectively, for (BuOH + TFE), (EtOH + HFB), and (BuOH + HFB). The results are presented inFigure 2. As can be seen, now the simulations not only reproduce the experimental molar volumes but also
correctly capture the symmetry of the experimental curves. However, it should be noted that thefitted η values are not constant for all of the systems but increase with the chain length of both the hydrogenated andfluorinated segments. In other words, the correction needed to the repulsive part of the intermolecular potential is not constant for all of the systems but increases with chain length. Interestingly, the series seems to tend to the limiting value of 1.040, which we recently found to be the value necessary to reproduce the excess volumes and enthalpies of (alkane + perfluoroalkane) mixtures, with the same energy binary interaction parameter of ξ = 0.80. From now on, all simulation results presented in this work were obtained with the new set of energy and size binary interaction parameters unless stated otherwise.
4.2. Excess Molar Enthalpies. As previously explained, we have been able to reproduce both the excess enthalpies and volumes for the (EtOH + TFE) mixture using a couple of binary interaction parameters,ξ = 0.80 and η = 1.013. For the equimolar mixture, the simulated excess enthalpy, HE
m=−580
J mol−1, compares favorably with the experimental value of −660 kJ mol−1.32
We have then simulated the excess enthalpies at 298 K for the remaining three systems, for which no Table 2. Excess Molar Volumes of Equimolar Mixtures,VE(x = 0.5), of Hydrogenated and Fluorinated Alcohols at 298.15 K and
Redlich−Kister Coefficients
mixture VmE(x = 0.5)/cm3mol−1 A0 A1 A2
EtOH + TFEa 0.81± 0.01 3.23± 0.06 0.4± 0.1 0.4± 0.3
BuOH + TFEb 1.20± 0.03 4.8± 0.1 −1.2 ± 0.1 0.5± 0.3
EtOH + HFB 1.45± 0.02 5.78± 0.08 −0.3 ± 0.1 2.0± 0.4
BuOH + HFB 1.95± 0.05 7.8± 0.2 −2.3 ± 0.2 3.2± 0.5
aResults from ref12.bValues at 293.15 K.
Figure 3.(A) Excess molar enthalpies of mixtures of hydrogenated andfluorinated alcohols at 298.15 K. Colored symbols: simulation results; black symbols: experimental results from Minamihonoki et al.32(B) Dispersive and electrostatic contributions to the simulated excess enthalpies.
experimental data is available, using the same value ofξ = 0.80 and the η values that reproduce the excess volumes of each individual system. The results are shown inFigure 3a.
The simulation results show that when the chain length of the hydrogenated alcohol increases from EtOH to BuOH, the excess enthalpy for mixtures with TFE also increases and becomes much less negative. An S-shaped curve is obtained, with a negative and a slightly positive branch. For the equimolar mixture, HE
m= −77 J mol−1. This trend is confirmed by the
experimental data from the literature32 for mixtures of TFE with methanol, EtOH, and 1-propanol, also included inFigure 3. Using the data from these three systems to predict the excess enthalpy of (BuOH + TFE), a value of−11 J mol−1is obtained for the equimolar mixture, which compares favorably with the simulation result and adds confidence to the predictions obtained by the simulations. Increasing the chain length of the fluorinated alcohol from TFE to HFB results in additional increase of the excess enthalpy. Both mixtures involving HFB display positive excess enthalpies: for the equimolar mixtures, HEm= 560 J mol−1for (EtOH + HFB) and HEm= 970 J mol−1
for (BuOH + HFB).
The separate contributions to the excess enthalpy from Coulomb and dispersion interactions have been calculated from the simulations and are plotted for each system, as a function of composition, in Figure 3B. Coulomb contributions, which account for hydrogen-bond interactions, are negative for all systems, whereas dispersion contributions are always positive.
In the case of the (EtOH + TFE) mixture, the Coulomb contribution is very negative and overcomes dispersion, resulting in negative excess enthalpies. As the chain length increases, either of the hydrogenated or fluorinated one, the Coulomb contribution becomes less negative and the dispersive contribution becomes more positive. Consequently, the excess enthalpy gradually increases, becoming less negative and then positive.
It is interesting to note that mixtures involving TFE display much more negative Coulomb contributions than those involving HFB, regardless of the hydrogenated alcohol. As in the simulations the partial charges of oxygen and hydrogen are the same in both fluorinated alcohols, this result probably reflects a reduction of hydrogen bonds in HFB mixtures relative to those in TFE due to steric factors. The difference in the electrostatic energies of the systems with TFE and HFB (aprox. −750 J mol−1) is consistent with the reduction of the total
number of hydrogen bonds observed in Figure 7 for the equimolar mixture of (BuOH + HFB).
In summary, in the case of the shorter-chain alcohols, the excess enthalpy is dominated by Coulomb interactions, which include the new hydrogen bonds between unlike molecules. As the alcohol chain length grows, the unfavorable hydrogenated− fluorinated dispersion interactions become progressively dominant and the mixtures become less exothermic.
4.3. Liquid Structure. A combined study of the infrared spectra and molecular dynamics simulations (analyzing the
Figure 4.Infrared spectra of the pure components and binary mixtures in the OH and CH stretching region, with the indicated compositions (normalized at the wavenumber ofνOH mode maximum absorption). Systems: A, (EtOH + TFE); B, (EtOH + HFB); C, (BuOH + TFE); and D, (BuOH + HFB).
rdfs) was used to provide molecular insight into the thermodynamic results, in terms of intermolecular interactions and the structure of the pure alcohols and binary mixtures. The results obtained from the different approaches are not only consistent but also together allow a much deeper understanding of the systems under study.
4.3.1. H···OH Intermolecular Interactions. The full infrared spectra of the pure components and binary mixtures are shown in Figure S1 (in Supporting Information) and the proposed band assignments are summarized inTables S1−S4.34−40
Relevant information on the H−O···H hydrogen bonds may be retrieved from the OH stretching band. Usually very broad, this alcohol band is often discussed in terms of spectral components assigned to different H-bonded species.
The infrared spectra in the 2600−3800 cm−1region of the pure alcohols and their binary mixtures are compared inFigure 4.
In the spectra of pure alcohols, the broadness of the OH stretching band (νOH, with maximum in the range of 3330− 3370 cm−1) is indicative of a diversity of H-bonds:41 intermolecular in all of the alcohols and possibly also intramolecular in the case offluorinated ones, where they can be established between the OH and CF3 groups of gauche conformers, although weaker.42The band maximum appears at lower wavenumbers for hydrogenated alcohols when compared to the correspondingfluorinated ones (∼20 cm−1for EtOH vs TFE and ∼30 cm−1for BuOH vs HFB), which suggests that the dominant interactions involving the OH groups are stronger in the former. The presence offluorine atoms should enhance the ability of the OH group to form H-bonds by H donation.43On the other hand, the bulkier character offluorine and the rigidity offluorinated chains can make the H−O···H interaction more sterically hindered. In fact, the two smaller bands at ∼3690 and ∼3630 cm−1observed in the spectra of pure TFE and HFB may be related to the presence of less bonded OH groups (free or only proton acceptors). These features are not present in the spectra of EtOH and BuOH, which is also indicative of their higher tendency to establish H-bonds (both proton donors and proton acceptors).
In the binary mixtures, the νOH band broadens (the full width at half-height (FWHH) is ∼300 cm−1 for the pure components and ≥400 cm−1 for the mixtures) more toward lower wavenumbers and its maximum lies between those of the
pure compounds (Table S1). Hence, the presence of the second component increases the variety of H-bonds that may be formed, favoring the stronger ones. Moreover, it seems that at least some of the new interactions that can be established upon mixing (cross-interactions between fluorinated and hydrogenated alcohols) are stronger than those of purefluids, weakening the O−H bond and shifting the νOH band to lower wavenumbers. Possibly, the OH groups of the fluorinated alcohols, being better hydrogen donors, are able to establish stronger H-bonds with the hydrogenated alcohols. This effect is favored for equimolar mixtures, except for the system (BuOH + TFE), in which the broadening is more pronounced for low mole fractions of the second component. It is also clear that the proportion of less bonded OH groups decreases significantly with the increase of the hydrogenated compounds’ content, as the two small bands in the high-frequency region, observed for TFE and HFB, lose definition and intensity.
It was possible to prove, beyond doubt, that the broadening of the OH stretching band is a consequence of the presence of afluorinated component, as in the case of (EtOH + BuOH) mixtures, this effect is not observed (Figure 5A): the largest increase in the FWHH is only of 14 cm−1, when EtOH is added to BuOH.
The stronger cross-hydrogen-bonding in mixtures involving fluorinated and hydrogenated alcohols is probably the main reason for the exothermal contribution of the Coulomb forces to the excess enthalpy observed for all mixtures in the simulation results. It should be reminded that mixtures of hydrogenated alcohols with relatively similar chain lengths exhibit small positive excess enthalpies.
The spectroscopic results are consistent with the rdfs between the relevant interaction sites, obtained by computer simulation. The curves corresponding to all four possible O−H pairs interacting through hydrogen bonds are shown inFigure 6
for the equimolar mixture of the (BuOH + HFB) system. As before, the simulations were performed affecting the H−F dispersive interaction with both energy and size binary interaction parameters,ξ = 0.80 and η = 1.035.
The curve corresponding to hydrogen bonding between the oxygen atom in BuOH and the hydrogen atom in HFB is much more intense than the others. The relative intensity of the peaks follows the difference of the partial charges assigned to the interacting atoms: the oxygen atom in BuOH has the highest
Figure 5.Infrared spectra of pure EtOH, BuOH, and their binary mixtures, in the OH stretching region, normalized at the wavenumber ofνOH mode maximum absorption (A) and in the 800−1600 cm−1region (B).
negative partial charge, whereas the hydroxyl hydrogen atom in HFB has the highest positive partial charge. Therefore, the hydrogen bond between this pair is bound to be stronger. It should be kept in mind that in this model hydrogen bonds are effectively included through Coulomb interactions between partial charges. Interactions are counted as hydrogen bonds for O−H pairs within 2.67 Å, which corresponds to the first minimum in the rdfs of Figure 6. For the other mixtures, essentially equivalent results were obtained, including (EtOH + TFE).12As the H-bonds between the two unlike molecules are stronger, their formation can explain the broadening toward lower wavenumbers of theνOH band observed in the infrared spectra (Figure 4).
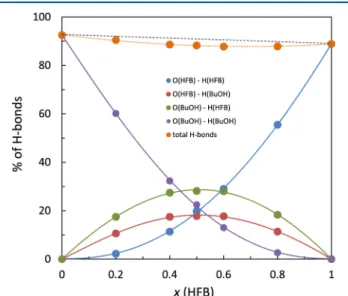
The distribution of hydrogen bonds between each type of O−H pairs was also calculated as a function of composition for all of the mixtures. The results are shown inFigure 7for the
(BuOH + HFB) mixtures, which are again representative of all other systems. In thisfigure, 100% corresponds to a situation in which a maximum number of hydrogen bonds, 2 per molecule, would exist. As can be seen, the addition of 20% offluorinated alcohol results in a large decrease in the H-bonds between hydrogenated alcohol molecules, whereas the H-bonds between fluorinated alcohol molecules become practically inexistent.
Equivalent symmetrical results are found for an addition of 20% of BuOH to HFB.
For compositions close to the equimolar, the H-bond between the oxygen of the hydrogenated alcohol and the hydrogen of the fluorinated alcohol is more abundant. The predominance of this energetically more favorable interaction is probably responsible for the exothermic contribution of the hydrogen-bond network to the excess enthalpy. For other compositions, the H-bonds between like molecules are increasingly replaced by cross-interactions as the molar fraction of the second component increases.
It should be emphasized that these simulation results (Figures 6and 7) are consistent with the spectroscopic data (Figure 4), showing a larger variety of hydrogen-bond interactions in the mixtures and displaying a higher proportion of the stronger ones. This effect is clear by the broadening of the OH stretching mode, mainly to the lower-wavenumber region, corroborated by the intermolecular rdfs and hydrogen-bond-distribution calculations.
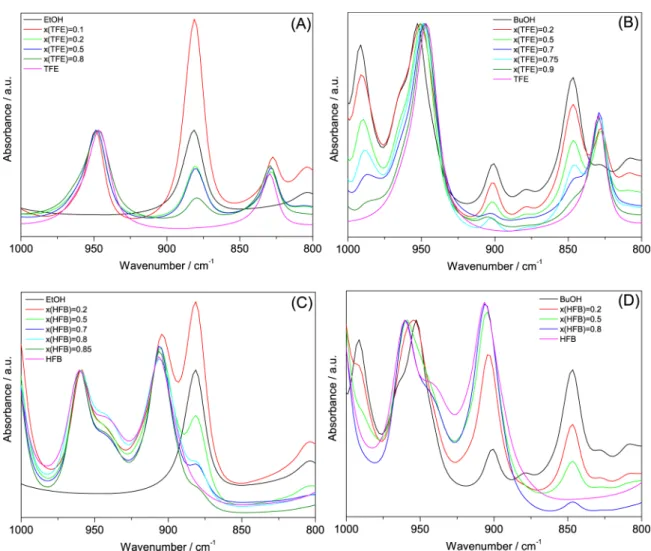
4.3.2. F···HO Inter- and Intra-Molecular Interactions. In the 1000−1400 cm−1 spectral region, the bands of the fluorinated and hydrogenated alcohols have a minimum overlap and can be analyzed almost independently. As the more informative bands belong to the fluorinated alcohols, it is possible to discuss the effect of mixing with EtOH or BuOH. The infrared spectra of TFE and HFB binary mixtures are shown inFigure 8, normalized to the maximum absorption in the corresponding wavenumber range.
The effect on the TFE spectrum induced by the presence of EtOH or BuOH (Figure 8A,B, respectively) is observed in the very strong doublet centered at∼1155 cm−1(for pure TFE), assigned to a combined mode of the CF3 stretching (νCF3)
with the COH deformation (δCOH) or the methylene deformation (δCH2). At low mole fractions of EtOH (or BuOH), the doublet loses definition and becomes better described as a band with a shoulder. Above the equimolar mixture, it is reduced to a single band with maximum at 1157 cm−1 for the system (EtOH + TFE) and at 1155 cm−1 for (BuOH + TFE). The band at ∼1090 cm−1, assigned simultaneously to EtOH (δCH3, δCOH, or νaCCO mode)
and to CH2 wagging mode of TFE (ωCH2), broadens in the mixtures, apparently due to a new shoulder that appears at ∼1099 cm−1(Table S1). This may result from modifications in
intermolecular interactions. In fact, it has been suggested that a band near 1110 cm−1, called association band, is closely related to theνOH mode of bonded OH groups.44
The effects induced on the spectrum of HFB by mixing with EtOH or BuOH (Figure 8C,D) are comparatively more difficult to discuss because the spectra are much more complex due to the νCF2 bands and to the small overlap of the νCF (HFB) andνCO (EtOH and BuOH) modes. The HFB main bands observed in this region are listed inTable S2. For both (EtOH + HFB) and (BuOH + HFB) mixtures, there are small band shifts (Tables S3 and S4), as well as modifications in the relative intensities, especially for low molar fractions of the hydrogenated component (x = 0.2).
The complete analysis of the spectra inFigure 8was based on band deconvolution in Voigt components, by a nonlinear least-squares fitting method, for the pure alcohols and the mixtures. The deconvolution results are presented inFigures S2 and S5 and Tables S5−S8. The deconvolutions of the HFB systems are not as reliable as those with TFE, due to the complex band structure.
Figure 6. Intermolecular rdfs between the oxygen and hydroxyl hydrogen atoms for the (BuOH + HFB) equimolar mixture.
Figure 7.Hydrogen-bond distribution in the (BuOH + HFB) mixture as a function of composition, obtained by computer simulation.
It was found that the doublet of pure TFE centered at∼1155 cm−1 corresponds actually to the overlapping of two components, at 1143 and 1171 cm−1, with relative intensities estimated by the area ratio A1143/A1171 = 0.64. The
lower-wavenumber component is assigned to the molecules involved in F···HO intermolecular hydrogen bonds, whereas the higher-wavenumber component is assigned to the molecules involved in F···HO intramolecular hydrogen bonds, which are probably weaker due to steric hindrance. For pure HFB, the broad band
between 1150 and 1250 cm−1was resolved in two CF3-related components, at 1144 and 1179 cm−1, whose relative intensities were estimated as A1144/A1179= 0.39. The component assigned
to the intramolecular F···HO hydrogen bonds (1179 cm−1) is predominant, suggesting that the relative population of the chain gauche conformers is significant. The evolution of the splitting between the two components and of their relative areas for the binary systems as a function of the molar fraction of thefluorinated alcohol is summarized inTable 3.
Figure 8.Infrared spectra (1000−1250 or 1000−1400 cm−1) of the pure components and binary mixtures: A, (EtOH + TFE); B, (BuOH + TFE); C, (EtOH + HFB); and D, (BuOH + HFB).
Table 3. Changes in the Doublet of TFE (1143/1171 cm−1) and HFB (1144/1179 cm−1) by Mixing with EtOH and BuOH, as a Function of the Molar Fraction of the Fluorinated Alcohol,x
xTFEor xHFB 1.00 0.90 0.85 0.80 0.75 0.70 0.50 0.20 0.10 EtOH + TFE splitting (cm−1)a 28 25 22 20 13 intensity ratiob 0.64 0.87 1.08 1.19 1.97 BuOH + TFE splitting (cm−1)a 28 27 25 26 20 16 intensity ratiob 0.64 0.83 0.85 1.12 1.24 1.36 EtOH + HFB splitting (cm−1)c 35 33 30 38 35 36 intensity ratiod 0.39 0.52 0.43 0.46 0.53 0.60 BuOH + HFB splitting (cm−1)c 35 28 34 37 intensity ratiod 0.39 0.38 0.41 0.28 aν̃
max(∼1171 cm−1)− ν̃max(∼1143 cm−1).bA1143/A1171.cν̃max(∼1179 cm−1)− ν̃max(∼1144 cm−1).dA1144/A1179.
In the case of TFE, the addition of EtOH or BuOH (even in low mole fractions) results in a decrease of the splitting between the two components (they shift toward each other) and an increase of the lower-wavenumber-component con-tribution. These changes suggest that the stronger intermo-lecular F···HO hydrogen bonds (responsible for the lower-wavenumber component) become weaker but the population of CF3groups involved increases significantly with increasing
EtOH or BuOH) content. We may conclude that in the mixtures of TFE with EtOH or BuOH the terminal CF3groups
replace most of their intramolecular and a large part of their intermolecular H-bonds by F···HO hydrogen bonds between unlike molecules, which concur with the negative excess enthalpies.
However, in the case of HFB, the splitting remains approximately constant and the relative intensities of the two components vary much less with composition when mixing with EtOH, suggesting that the CF3terminal groups of HFB
are less sensitive to the presence of the second component. The almost constant value obtained for the different (BuOH + HFB) mixtures indicates that the longer alcohols (fluorinated and hydrogenated) are mutually segregated, which agrees with the positive excess enthalpies obtained by computer simulation for this system. In summary, the vibrational modes of CF3
groups are sensitive to differences in the liquid structures of the pure alcohols and the binary mixtures, leading to the same conclusions as those from the enthalpic effects discussed above.
Figure 9 displays the rdfs between the different pairs of
terminal carbons (−CH3and −CF3) for the (BuOH + HFB)
mixture at different compositions, obtained using the previous energy and size binary interaction parameters (ξ = 0.80 and η = 1.035). For comparison, the rdf for the simulation of an equimolar mixture in which the hydrogen−fluorine interactions were calculated using the geometric mean rule for both the size and energy Lennard-Jones parameters, is also shown. As can be seen, both the CH3−CH3 and CF3−CF3 rdfs significantly
increase as the concentration of the second component increases. The rdf between CH3and CF3seems less sensitive
to composition but, as could be expected, become considerably less intense when the H−F interaction is weakened. These observations are a clear indication of mutual segregation between hydrogenated andfluorinated segments, resulting from weakening of the cross-interaction. It is important to stress that the effect is practically not observed if no H−F binary interaction parameters are used (ξ = 1 and η = 1).
Globally, the analysis of the rdfs suggests that the hydrogenated + fluorinated n-butanols’ binary mixtures can be regarded as nanostructured: a O···HO network of hydrogen
Figure 9.Intermolecular rdfs between the terminal carbon atoms (CH3 or CF3) for (BuOH + HFB) mixtures at different compositions, from
molecular dynamics simulations. As before, binary interaction parameters (ξ = 0.80 and η = 1.035) were used to weaken the H−F dispersive interaction. For comparison, results without this reduction (ξ = 1 and η = 1) are also shown for the equimolar mixture (dashed lines).
Figure 10.MD simulation snapshot of an equimolar mixture of (BuOH + HFB). (A) blue chains, BuOH; green chains, HFB; OH groups in red and white; atomic diameters were slightly reduced to better visualize the O···OH network; (B) BuOH and HFB chains are represented in a wireframe model to allow visualization of the O···OH network.
bonds formed between the hydroxyl headgroups, surrounded by the carbon chain tails, which, in turn, segregate into hydrogenated and fluorinated domains. This structure is illustrated in Figure 10, in which a molecular dynamics simulation snapshot obtained for an equimolar mixture of (BuOH + HFB) is shown. InFigure 10A, the hydrogenated and fluorinated chains have been colored differently, blue and green, respectively, to visually emphasize the possible segregation between the two types of chains. InFigure 10B, the alkyl and perfluoroalkyl chains are represented with a wireframe model to accentuate the existence of the O···HO network, which is easily visible.
4.3.3. Alkyl Chain Conformations. Different approaches were followed to retrieve information on the alkyl chain of BuOH, which may be crucial for the structure of the binary mixtures.
Using the infrared data, in particular the region 1000−1400 cm−1 (Figures 5B and 8B,D), the trans−gauche alkyl chain equilibrium, due to rotation over the C1−C2 and C2−C3 bonds,37was analyzed. For pure BuOH, it has been proposed that the bands at 1115, 1072, and 1060 cm−1(assigned to in plane rocking of CH3 (ρCH3), CCO, and CC stretching
modes, respectively) are correlated to the all-trans (TTt) alkyl chain conformer, whereas several calculated modes at 1100− 1107 cm−1 (assigned to CO, CC stretching, and COH deformation modes) are related to the conformers with gauche rotations, namely, TGt or TGg.37In the present work, the latter are not clearly identified in the BuOH spectrum. However, a component at ∼1102 cm−1, retrieved by deconvolution, can correspond to overlapping modes of conformers with one or more gauche rotations (Tables S6 and S8). Therefore, an estimate of the proportion of BuOH all-trans conformers may be obtained from the ratio of the components’ areas, A = [ΣA(TTt)/ΣA(all conformers)]. This proportion is shown in Figure 11as a function of the second component mole fraction. From the spectroscopic data, these equilibrium changes are discussed, taking into account the observed relative intensities of the bands exclusively related to the all-trans conformer. The overlapping of the components related to one or more gauche
rotations (namely, TGt or TGg) inhibits an independent assessment of the gauche conformers.
For the mixture (BuOH + TFE), the proportion of the TTt conformer decreases as the mole fraction of TFE increases (from ∼93 to ∼55% at xTFE = 0.9). The displacement of the
conformational equilibrium of the BuOH alkyl chain could be either related to the different alkyl chain lengths of the two alcohols or a consequence of the presence of thefluorinated chains of TFE. This was elucidated by a similar analysis of the system (BuOH + EtOH), also included in Figure 11. As no significant changes in the spectrum are observed and the TTt % is almost constant, the presence of thefluorinated component is clearly the cause for the increase of conformers with gauche rotations: once in the presence of afluorinated environment, BuOH tends to adopt a more globular conformation, to reduce the contact between two dissimilar chains. These results are in agreement with the existence of the above-mentioned unfavorable interactions between hydrogenated andfluorinated segments. The lesser influence of the longer fluorinated alcohol seems to confirm the hypothesis of segregation already suggested by the simulations and the analysis of the CF3
spectral region. On HFB, no spectral information is available in the literature on thefluoroalkyl conformations.
The molecular dynamics trajectories obtained by simulation were also used to analyze the conformational changes arising on mixing, by calculating the intramolecular dihedral distribution functions, that is, the probability distribution of rotational conformers around a given bond, as a function of the dihedral angle. Contrarily to the spectral analysis, the rotations over C1−C2 and C2−C3 may be individualized. However, it should be kept in mind that in the simulations intramolecular terms, such as vibrations and dihedral rotations, are described by invariant expressions, typically developed from ab initio methods for isolated molecules. The final distribution of conformers reflects the balance of Coulomb and dispersion interactions (and thus the organization of the fluid) conditioned by the invariant conformational potential.
The trans/gauche conformational equilibrium of the CCCC dihedral angle of BuOH (corresponding to the rotation around the C2−C3 bond) is represented inFigure 12A as a function of the concentration offluorinated alcohol in the mixtures. As can be seen, the trans conformer is predominant (only very small peaks are observed for the gauche configurations), independent of the composition of the mixtures. For the CCCO dihedral angle (Figure 12B), for pure BuOH, the trans conformer now accounts for less than 50% of the total, and this proportion slightly decreases with the addition of bothfluorinated alcohols. The effect is more pronounced for mixtures with TFE. These results qualitatively agree with the spectroscopic observations. The effects of mixing on the conformational equilibrium of HFB are presented in Figure 12C,D for CCCC and CCCO dihedral angles, respectively. There is a striking difference between the dominant conformations of pure HFB and BuOH, as predicted by the simulations: the CCCC dihedral is now predominantly gauche (∼66%), whereas the CCCO dihedral is essentially trans (95%). The preferential gauche conformation of the CCCC dihedral is probably stabilized by an intra-molecular interaction between afluorine atom of the CF3group
and a hydrogen atom of the CH2group. Mixing hydrogenated
alcohols with HFB has qualitatively the same effects as mixing fluorinated alcohols in BuOH: there is no change in the CCCC conformations, whereas the proportion of the CCCO trans conformer slightly decreases as the concentration of the
Figure 11.Influence of the second component on the distribution of the rotational conformers of the BuOH alkyl chains: EtOH (red), TFE (black), and HFB (blue). TTt % estimated as 100× (A1114+ A1073+
A1060)/(A1114+ A1073+ A1060+ A1102).
hydrogenated alcohol increases. The results shown inFigure 12
were obtained using binary interaction parameters (ξ = 0.80 and η = 1.035) to model the H−F dispersive interaction, although they are indistinguishable from those obtained without the introduction of binary interaction parameters.
4.3.4. CCOH Dihedral Angle. The rotational isomerism of alcohols involving the orientation of the OH group with respect to the C−C−O plane (anti and gauche conformations) and their equilibria can be related to infrared bands.14For EtOH, the νsCCO mode is a doublet, in which the weaker
higher-wavenumber component is assigned to the gauche form.45For TFE, more than one mode was assigned to anti or gauche conformers,18,46 the νCO being one of them. For longer alcohols, such as BuOH, theνCO mode is also sensitive to the conformation at the CCOH dihedral. It also has two components, but the higher-wavenumber one correlates with the anti conformer.40This spectral information is contained in the 800−1000 cm−1region. The spectra of pure alcohols are compared to those of the binary mixtures inFigure 13.
For EtOH and TFE, the areas retrieved from the spectral deconvolution (Table S9) were used to estimate the percentage of the anti conformer from the ratio anti % = 100× Aanti/(Aanti
+ Agauche). The predominance of the anti conformer in EtOH
(∼72%) and of the gauche conformer in TFE (∼64%) is obvious and in good agreement with the literature.17,20
The spectrum of pure BuOH is more complex in this region. The percentage of the anti conformer (estimated as for the
shorter alcohols,Table S10) is 42%, which indicates a higher stability of the gauche form, contrarily to that observed in EtOH. In the case of pure HFB, the areas of the peaks (Table S11) point to 40% of the anti conformer.
In short, the infrared spectra show that for the pure alcohols, the CCOH conformational equilibrium favors gauche con-formers, except for EtOH. Moreover, there is a general tendency toward a decrease of the anti percentage with fluorination.
In the (EtOH + TFE) binary mixtures (Figure 13A), small band shifts are observed in the bands correlated with the C−C−O and C−O stretching modes of both alcohols, suggesting that some change in the orientation of the OH bond with respect to the C−C−O plane occurs by mixing. The spectra of (BuOH + TFE) mixtures are more difficult to analyze (Figure 13B) because of the band overlap of the two molecules. Nevertheless, it is clear that they are not just a sum of the pure components’ spectra: differences in position and band shape are suggested instead. The same is true in terms of band overlapping for the mixtures of EtOH and BuOH with HFB (Figure 13C,D).
The effects of the second molecule on the anti−gauche equilibrium at the CCOH dihedral angle for each alcohol were analyzed from the results obtained by band deconvolution (Figures S4 and S5 and Tables S9−S13). The evolution of the relative population of the anti conformers as a function of the fluorinated alcohol molar fraction is represented in Figure 14 Figure 12.Percentage of trans conformer obtained by MD simulations for the C−C−C−C and C−C−C−O dihedrals for BuOH (mixed with fluorinated alcohols) and HFB (mixed with hydrogenated alcohols), as a function of the fluorinated alcohol mole fraction. The insets show the examples of the dihedral distribution functions, which represent the probability distribution as a function of the dihedral angle.
for all of the systems analyzed. The analysis of the (EtOH + BuOH) mixtures (Figure 14A and Table S13) evidences that mixing alcohols with different hydrogenated alkyl chains does not induce significant changes in the preferential orientation of the OH group. This confirms that any changes are due to the presence of afluorinated molecule.
In the case of the binary mixtures containing EtOH and a fluorinated alcohol (Figure 14B), a small fraction of the second component shifts the conformational equilibrium of both
components toward the anti conformer. This effect is more pronounced for EtOH, as a small amount of any of the fluorinated components induces a shift toward ∼100% of anti conformer. Correlating this information with that obtained from deconvolution of theνCF3region (1230−1000 cm−1) and from theνOH components at higher wavenumbers, we may propose that as EtOH is added to TFE or HFB part of the intramolecular OH···F bonds tend to be replaced by stronger
Figure 13.Infrared spectra (800−1000 cm−1) of pure components and binary mixtures: A, (EtOH + TFE); B, (BuOH + TFE); C, (EtOH + HFB); and D, (BuOH + HFB). The spectra were normalized at∼950 cm−1for fluorinated alcohols and mixtures and at the wavenumber of maximum absorption for pure hydrogenated alcohols.
Figure 14.Relative populations of anti conformers of each component in all of the mixtures analyzed: A, (EtOH + BuOH); B, (EtOH + TFE) and (EtOH + HFB); and C, (BuOH + TFE) and (BuOH + HFB).
OH···O intermolecular bonds with EtOH, inducing the observed conformational redistribution toward anti conformers. The behavior of the (BuOH + TFE) mixtures (Figure 14C andTable S10) is qualitatively similar to that of (EtOH + TFE) regarding the hydrogenated alcohol as the proportion of anti conformers increases with TFE content; however, unlike EtOH, it is more gradual and never reaches 100%. The trend of the anti conformers of TFE is rather different: when a small amount of BuOH is added, their proportion decreases, and this tendency inverts for contents of BuOH above ∼0.3 mole fraction.
The system (BuOH + HFB) follows similar trends observed from either end of the diagram (Figure 14C andTables S11 and S12): low contents of the second component (molar fractions below ∼0.2) induce a small increase in the anti conformer proportion, recovering the value of the first pure alcohol for a molar fraction of∼0.8 of the second component.
5. CONCLUSIONS
From the combined analysis of thermodynamic results, infrared spectra, and molecular dynamics simulations of binary mixtures of fluorinated and nonfluorinated alcohols, it was possible to propose a liquid structure that takes into account the intermolecular hydrogen bonds and the chain conformations. The specific interactions in these binary mixtures are very different from those within the pure components and between two hydrogenated alcohols. The role offluorine is fundamental. The systems display a complex behavior when compared with mixtures of hydrogenated alcohols and mixtures of alkanes and perfluoroalkanes. The excess volumes are large and positive (unlike those of mixtures of hydrogenated alcohols), whereas the excess enthalpies range from large and negative to large and positive. This seems to result from a balance between preferential hydrogen bonding between the hydrogenated and fluorinated alcohols and unfavorable dispersion forces between hydrogenated andfluorinated groups. As chain length increases, the contribution of dispersion increases and overcomes the contribution of H-bonds.
EtOH, in the presence of fluorinated alcohols, shifts the conformational equilibrium at the C−O−H group toward the anti-conformer. The hydrogen bonds involving the OH group become stronger and more diverse. This effect is very strong, even for diluted mixtures influorinated alcohol. BuOH shows a similar tendency when thefluorinated alcohol is small but is not very affected by a longer fluorinated chain. These interactions between different alcohols involve the CF3 groups when the
fluorinated alcohol is TFE but much less when the fluorinated chain is longer, suggesting the possibility of segregation between the hydrogenated and fluorinated segments, a hypothesis corroborated by the simulations.
More interestingly, the infrared spectra reveal that the presence of fluorinated components induces conformational changes in the hydrogenated chain of BuOH from the usually preferred all-trans to more globular arrangements involving gauche conformations, more markedly when the molecule is smaller (TFE). The longer-chained alcohols appear to space out. These observations are consistent with the simulation results.
■
ASSOCIATED CONTENT*
S Supporting InformationThe Supporting Information is available free of charge on the
ACS Publications websiteat DOI:10.1021/acs.jpcb.6b04297.
Full infrared spectra, band assignments, and deconvolu-tion analysis for the pure alcohols (EtOH, BuOH, TFE, HFB) and binary mixtures (PDF)
■
AUTHOR INFORMATIONCorresponding Authors
*E-mail: lilharco@tecnico.ulisboa.pt. Tel.: +351 218 419 220 (L.M.I.).
*E-mail: efilipe@tecnico.ulisboa.pt. Tel.: +351 218 419 261 (E.J.M.F.).
Notes
The authors declare no competingfinancial interest.
■
ACKNOWLEDGMENTSWe would like to thank Profs. Fernando Fernandes and José Nuno Canongia Lopes for the generous lending of computer resources. This work was supported by Fundação para a Ciência e a Tecnologia, Projects UID/NAN/50024/2013 and UID/QUI/0100/2013; P.M. acknowledges funding from Fundação para a Ciência e a Tecnologia, grant SFRH/BPD/ 81748/2011.
■
REFERENCES(1) Song, W.; Rossky, P. J.; Maroncelli, M. Modeling Alkane + perfluoroalkane Interactions Using All-Atom Potentials: Failure of the Usual Combining Rules. J. Chem. Phys. 2003, 119, 9145−9162.
(2) Duce, C.; Tinè, M. R.; Lepori, L.; Matteoli, E. VLE and LLE of Perfluoroalkane + Alkane Mixtures. Fluid Phase Equilib. 2002, 199, 197−212.
(3) Morgado, P.; Zhao, H.; Blas, F. J.; McCabe, C.; Rebelo, L. P. N.; Filipe, E. J. M. Liquid Phase Behavior of Perfluoroalkylalkane Surfactants. J. Phys. Chem. B 2007, 111, 2856−2863.
(4) Morgado, P.; Lewis, J. B.; Laginhas, C. M. C.; Martins, L. F. G.; McCabe, C.; Blas, F. J.; Filipe, E. J. M. Systems Involving Hydrogenated and Fluorinated Chains: Volumetric Properties of Perfluoroalkanes and Perfluoroalkylalkane Surfactants. J. Phys. Chem. B 2011, 115, 15013−15023.
(5) Morgado, P.; Laginhas, C. M. C.; Lewis, J. B.; McCabe, C.; Martins, L. F. G.; Filipe, E. J. M. Viscosity of Liquid Perfluoroalkanes and Perfluoroalkylalkane Surfactants. J. Phys. Chem. B 2011, 115, 9130−9139.
(6) Morgado, P. Semifluorinated Alkanes: Structure − Properties Relations. Ph.D. Thesis, Instituto Superior Técnico, Lisboa, 2011.
(7) Turberg, M. P.; Brady, J. E. Semifluorinated Hydrocarbons − Primitive Surfactant Molecules. J. Am. Chem. Soc. 1988, 110, 7797− 7801.
(8) Binks, B. P.; Fletcher, P. D. I.; Kotsev, S. N.; Thompson, R. L. Adsorption and Aggregation of Semifluorinated Alkanes in Binary and Ternary Mixtures with Hydrocarbon and Fluorocarbon Solvents. Langmuir 1997, 13, 6669−6682.
(9) Mahler, W.; Guillon, D.; Skoulios, A. Smectic Liquid-crystal from (Perfluorodecyl)decane. Mol. Cryst. Liq. Cryst. Lett. 1985, 2, 111−119. (10) Viney, C.; Russell, T. P.; Depero, L. E.; Twieg, R. J. Transitions to Liquid-crystalline Phases in a Semifluorinated Alkane. Mol. Cryst. Liq. Cryst. 1989, 168, 63−82.
(11) Viney, C.; Twieg, R. J.; Russell, T. P.; Depero, L. E. The Structural Basis of Transitions between Highly Ordered Smectic Phases in Semifluorinated Alkanes. Liq. Cryst. 1989, 5, 1783−1788.
(12) Duarte, P.; Silva, M.; Rodrigues, D.; Morgado, P.; Martins, L. F. G.; Filipe, E. J. M. Liquid Mixtures Involving Hydrogenated and Fluorinated Chains: (p, P, T, X) Surface of (Ethanol + 2,2,2-Trifluoroethanol), Experimental and Simulation. J. Phys. Chem. B 2013, 117, 9709−9717.
(13) Tomšič, M.; Jamnik, A.; Fritz-Popovski, G.; Glatter, O.; Vlcek, L. Structural Properties of Pure Simple Alcohols from Ethanol, Propanol, Butanol, Pentanol, to Hexanol: Comparing Monte Carlo
Simulations with Experimental SAXS Data. J. Phys. Chem. B 2007, 111, 1738−1751.
(14) Coussan, S.; Bouteiller, Y.; Perchard, J. P.; Zheng, W. Q. Rotational Isomerism of Ethanol and Matrix Isolation Infrared Spectroscopy. J. Phys. Chem. A 1998, 102, 5789−5793.
(15) Kakar, R. K.; Quade, C. R. Microwave rotational spectrum and internal rotation in gauche ethyl alcohol. J. Chem. Phys. 1980, 72, 4300−4307.
(16) Fang, H. L.; Swofford, R. L. Molecular Conformers in Gas-phase Ethanol: A Temperature Study of Vibrational Overtones. Chem. Phys. Lett. 1984, 105, 5−11.
(17) Gardner, E. A.; Nevarez, A.; Garbalena, M.; Herndon, W. C. Infrared Spectra and Conformational Analysis of Anti and Gauche Deuterated Ethanol Isotopomers. J. Mol. Struct. 2006, 784, 249−253. (18) Senent, M. L.; Niño, A.; Muñoz-Caro, C.; Smeyers, Y. G.; Domínguez-Gómez, R.; Orza, J. M. Theoretical Study of the Effect of Hydrogen-Bonding on the Stability and Vibrational Spectrum of Isolated 2,2,2-Trifluoroethanol and its Molecular Complexes. J. Phys. Chem. A 2002, 106, 10673−10680.
(19) Wolfe, S. Gauche effect. Stereochemical Consequences of Adjacent Electron Pairs and Polar Bonds. Acc. Chem. Res. 1972, 5, 102−111.
(20) Hussein, M. A.; Millen, D. J.; Mines, G. W. Hydrogen Bonding in the Gas Phase Part 3.-Infrared Spectroscopic Investigation of Complexes Formed by Phenol and by 2,2,2-Trifluoroethanol. J. Chem. Soc., Faraday Trans. 2 1976, 72, 686−692.
(21) Cibulka, I.; Ziková, M. Liquid Densities at Elevated Pressures of 1-Alkanols from C1 to C10: A Critical Evaluation of Experimental Data. J. Chem. Eng. Data 1994, 39, 876−886.
(22) Cibulka, I.; Takagi, T. P-ρ-T Data of Liquids: Summarization and Evaluation. 8. Miscellaneous Compounds. J. Chem. Eng. Data 2002, 47, 1037−1070.
(23) Silva, G. M. C.; Morgado, P.; Haley, J. D.; Montoya, V. M. T.; McCabe, C.; Martins, L. F. G.; Filipe, E. J. M. Vapor Pressure and Liquid Density of Fluorinated Alcohols: Experimental, Simulation and GC-SAFT-VR Predictions. Fluid Phase Equilib. 2016, 425, 297−304.
(24) Jorgensen, W. L.; Maxwell, D. S.; Tirado-Rives, J. Development and Testing of the OPLS All-Atom Force Field on Conformational Energetics and Properties of Organic Liquids. J. Am. Chem. Soc. 1996, 118, 11225−11236.
(25) Watkins, E. K.; Jorgensen, W. L. Conformational Analysis and Liquid-State Properties from Ab Initio and Monte Carlo Calculations. J. Phys. Chem. A 2001, 105, 4118−4125.
(26) Duffy, E. M. Ph.D. Thesis, Yale University, 1994.
(27) Chitra, R.; Smith, P. E. A Comparison of the Properties of 2,2,2-Trifluoroethanol and 2,2,2-2,2,2-Trifluoroethanol/Water Mixtures Using Different Force Fields. J. Chem. Phys. 2001, 115, 5521−5530.
(28) Pádua, A. A. H. Torsion Energy Profiles and Force Fields Derived from Ab Initio Calculations for Simulations of Hydrocarbon− Fluorocarbon Diblocks and Perfluoroalkylbromides. J. Phys. Chem. A 2002, 106, 10116−10123.
(29) Smith, W.; Forester, T. R.; Todorov, I. T. The DL_POLY Classic User Manual, version 1.9; Daresbury Laboratory: United Kingdom, 2012.
(30) Brehm, M.; Kirchner, B. TRAVIS - A Free Analyzer and Visualizer for Monte Carlo and Molecular Dynamics Trajectories. J. Chem. Inf. Model. 2011, 51, 2007−2023.
(31) Sassi, M.; Atik, Z. Excess Molar Volumes of Binary Mixtures of 2,2,2-Trifluoroethanol with Water, or Acetone, or 1,4-Difluoroben-zene, or 4-Fluorotoluene, orα,α,α, trifluorotoluene or 1-Alcohols at a Temperature of 298.15 K and Pressure of 101 kPa. J. Chem. Thermodyn. 2003, 35, 1161−1169.
(32) Minamihonoki, T.; Ogawa, H.; Nomura, H.; Murakami, S. Thermodynamic Properties of Binary Mixtures of 2,2,2-Trifluoroetha-nol with Water or Alka2,2,2-Trifluoroetha-nols at T = 298.15 K. Thermochim. Acta 2007, 459, 80−86.
(33) Lepori, L.; Matteoli, E.; Spanedda, A.; Duce, C.; Tiné, M. R. Volume Changes on Mixing Perfluoroalkanes with Alkanes or Ethers at 298.15 K. Fluid Phase Equilib. 2002, 201, 119−134.
(34) Warren, D. S.; McQuillan, A. J. Infrared Spectroscopic and DFT Vibrational Mode Study of Perfluoro(2-ethoxyethane) Sulfonic Acid (PES), a Model Nafion Side-Chain Molecule. J. Phys. Chem. B 2008, 112, 10535−10543.
(35) Nagao, M.; Nagaoka, S.; Tanaka, S.; Mukai, K.; Yamashita, Y.; Yoshinobu, J. Adsorbed States of 1,1,1-Trifluoro-2-propanol on Si(100). Surf. Sci. 2003, 529, 288−294.
(36) Lu, R.; Gan, W.; Wu, B.-H.; Zhang, Z.; Guo, Y.; Wang, H.-F. C-H Stretching Vibrations of Methyl, Methylene and Methine Groups at the Vapor/Alcohol (n = 1−8) Interfaces. J. Phys. Chem. B 2005, 109, 14118−14129.
(37) Ohno, K.; Yoshida, H.; Watanabe, H.; Fujita, T.; Matsuura, H. Conformational Study of 1-Butanol by the Combined Use of Vibrational Spectroscopy and ab Initio Molecular Orbital Calculations. J. Phys. Chem. 1994, 98, 6924−6930.
(38) Socrates, G. Infrared and Raman Characteristic Group Frequencies: Tables and Charts, 3rd ed.; John Wiley & Sons: Chichester, 2004; pp 62, 94−99.
(39) Schenkel, R.; Jentys, A.; Parker, S. F.; Lercher, J. A. INS and IR and NMR Spectroscopic Study of C1−C4 Alcohols Adsorbed on Alkali Metal-Exchanged Zeolite X. J. Phys. Chem. B 2004, 108, 15013− 15026.
(40) Crowder, G. A.; Townsend, M. J. Vibrational Spectra of 1-Butanol. J. Mol. Struct. 1977, 42, 27−30.
(41) Paolantoni, M.; Sassi, P.; Morresi, A.; Cataliotti, R. S. Raman Noncoincidence Effect on OH Stretching Profiles in Liquid Alcohols. J. Raman Spectrosc. 2006, 37, 528−537.
(42) Cormanich, R. A.; Freitas, M. P.; Tormena, C. F.; Rittner, R. The F···HO Intramolecular Hydrogen Bond Forming Five-membered Rings Hardly Appear in Monocyclic Organofluorine Compounds. RSC Adv. 2012, 2, 4169−4174.
(43) Bégué, J.-P.; Bonnet-Delpon, D. Bioorganic and Medicinal Chemistry of Fluorine; John Wiley & Sons, Inc., 2008.
(44) Stuart, A. V.; Sutherland, G. B. B. M. Effect of Hydrogen Bonding on the Deformation Frequencies of the Hydroxyl Group in Alcohols. J. Chem. Phys. 1956, 24, 559−570.
(45) Barnes, A. J.; Hallam, H. E. Infrared Cryogenic Studies. Part 5. -Ethanol and -Ethanol-d in Argon Matrices. Trans. Faraday Soc. 1970, 66, 1932−1940.
(46) Senent, M. L.; Perez-Ortega, A.; Arroyo, A.; Domínguez-Gómez, R. Theoretical Investigation of the Torsional Spectra of 2,2,2-Trifluoroethane. Chem. Phys. 2001, 266, 19−32.