Structural properties of CaTi
1
x
(Nb
2/3
Li
2/3
)
x
O
3
d
(CNLTO) and
CaTi
1
x
(Nb
1/2
Ln
1/2
)
x
O
3
(Ln
¼
Fe (CNFTO), Bi (CNBTO)), modified dielectric
ceramics for microwave applications
R.C.S. Costa
a,b, A.D.S. Bruno Costa
b, F.N.A. Freire
a, M.R.P. Santos
a, J.S. Almeida
a,
R.S.T.M. Sohn
a, J.M. Sasaki
c, A.S.B. Sombra
a,a
Laborato´rio de Telecomunicac-o˜es e Cieˆncia e Engenharia dos Materiais (LOCEM), Departamento de Fı´sica, Universidade Federal do Ceara´, Caixa Postal 6030, CEP 60455-760, Fortaleza, Ceara´, Brazil
bDepartamento de Engenharia de Teleinforma´tica, CP 6007, Universidade Federal do Ceara´, CEP 60455-760, Fortaleza, Ceara´, Brazil cLaborato´rio de Raios-X, Departamento de Fı´sica, Universidade Federal do Ceara´, Caixa Postal 6030, CEP 60455-760, Fortaleza, Ceara´, Brazil
a r t i c l e
i n f o
Article history:
Received 30 October 2007 Accepted 24 December 2008
PACS: 68.55.a 81.15.Cd 77.80._e
Keywords:
Calcium titanate (CTO) Microwave ceramics
a b s t r a c t
This paper presents an investigation of the structural characteristics of Nb1/2Bi1/2(CNBTO), Nb1/2Fe1/2
(CNFTO) and Nb2/3Li1/3(CNLTO) substitution into the B-site of calcium titanate ceramics. The modified
CaTiO3(CTO) ceramics were prepared by the conventional solid-state method. The compounds were
investigated, by X-ray diffraction (XRD), energy-dispersive X-ray spectroscopy (EDXS). The X-ray analysis shows that all samples have an orthorhombic structure. The refinement analysis of all samples were also performed and discussed in this paper. For all studied samples, a Raman mode at 805 cm1
was detected and its intensity increases as the substitution increases. The dielectric permittivity and loss at microwave frequencies (MW) were investigated. The CNLTO phase, present the highest dielectric constant (k¼35.8) at 3.9 GHz with loss (tga¼7103). The lowest value ofk¼25.7 (f¼4.8 GHz) and
tga¼3103, was obtained for the CNFTO phase. These measurements confirm the possible use of
such material for microwave devices like dielectric resonator antennas.
&2009 Elsevier B.V. All rights reserved.
1. Introduction
The rapid growth of the wireless communication industry has created a high demand for the development of small size, low
power loss, and temperature stable microwave components[1].
From the viewpoint of device designing, a good combination of a high dielectric constant (k), a high quality factor (Qf) value, and a zero temperature coefficient of resonant frequency,
t
f, the lower cost and smaller size of the individual components are the crucial requirements for commercial applications[2,3].Most of the microwave dielectric ceramics with high dielectric constant have positive
t
f. Some titanate ceramics are of this kind, for example, CaTiO3-based ceramics are attractive candidates for use as dielectric resonators in wireless communication systems [4], this ceramic exhibited dielectric properties of k¼162, Qf¼12.000 GHz et
fE850 ppm/1C[5]. To utilize this material in a microwave circuit, the temperature coefficient should be improved[6]. The effective way to achieve near-zerot
fand optimizeQf value is compensating the large positive temperature
coefficient values using the compounds having negative tempera-ture coefficient values with high quality[5].
It is known that Perovskite-kind of formula Ca(X1/2Nb1/2)O3 has a negative
t
f, for example, Ca(Al1/2Nb1/2)O3have the following properties:t
fE87 ppm/1C, andk¼25, andQf¼7500 GHz[7]. This paper reports on the dielectric properties of solid solutions of three series, CaTi1x(Nb1/2Bi1/2)xO3 , CaTi1–x(Nb1/2Fe1/2)xO3and CaTi1x(Nb2/3Li1/3)xO3d, respectively abbreviated as CNBTOX, CNFTOX and CNLTOX. The structural analysis of produced samples was studied using X-ray diffraction (XRD), Raman and Infrared (IR) spectroscopy and microwave dielectric properties.
2. Experimental methods
In this work, samples of CaTi1x(Nb1/2Bi1/2)xO3, CaTi1–x(Nb1/2
Fe1/2)xO3 and CaTi1–x(Nb2/3Li1/3)xO3–d withx¼0.1 and 0.2 were synthesized from high purity (more than 99.9%) powders of CaCO3, TiO2, Bi2O3 Li2O Fe2O3and Nb2O5using the conventional solid-state reaction method.
The oxides and carbonate were weighed according to the compositions of each sample. The mixtures were high-energy ball
Contents lists available atScienceDirect
journal homepage:www.elsevier.com/locate/physb
Physica B
0921-4526/$ - see front matter&2009 Elsevier B.V. All rights reserved. doi:10.1016/j.physb.2008.12.037
Corresponding author. Tel.: 55 85 33669332; fax: 55 85 33669333. E-mail address:sombra@fisica.ufc.br (A.S.B. Sombra).
milling during 4 h in a planetary ball mill (Fritsch Pulverisette 6). The rotation speed of the disks carrying the sealed vials was 400 rpm. This operation was used to improve the homogeneity of the powder. The milled powders were dried and then calcinated in conventional controlled furnaces (EDG1800/EDGCON 3P) at 800 and 9001C during 4 h. The calcinated powders were mixed with an appropriate amount of glycerine (5 wt%) as a binder and pressed into cylindrical disks of diameter 10 mm and height about 3 mm at a pressure of 600 ton/cm2. These pellets were preheated
at 6001C for 1 h to expel the binder and then sintered at
temperature of 11001C during 3 h.
2.1. X-ray diffraction (XRD)
The X-ray powder diffraction profiles of the samples were recorded using a powder X-ray diffractometer system Rigaku D/max-B, composed of an X-ray generator, X-ray optics, goni-ometer, X-ray detector and counting system, and recorder for data recording or storing. Powder samples were fixed on a silicon plate with silicon paste. Patterns were collected at laboratory tempera-ture (about 294 K) using Cu K radiation, operated at 40 kV and 25 mA in the geometry of Bragg–Brentano, with a 0.02 (2 step size and a 2 s count time, along angular range 15–80 (2
y
).In the present study the Rietveld’s powder structure refine-ment analysis is adopted[8–10]. From the refinement analysis the structural parameters, such as atomic coordinates, lattice para-meters was obtained. The Rietveld’s software DBWS-9807a[11]is specially designed to refine the structural parameters through a least-squares method. The peak shape was assumed to be pseudo-Voigt (pV) function with asymmetry. The background of each pattern was fitted by a polynomial function of degree 5.
The least-square procedure was adopted for minimization of the difference between the observed and simulated powder diffraction pattern. The minimization was carried out by using the reliability index parameters RWP (weighted residual error) and Durbin–Watson d-statistic dDW. The refinement continues till convergence is reached with the value of the quality factor goodness of fit (SGoF) very close to 1 (varies between 1.16 and 1.37), which confirms the good quality of the refinement.
2.2. Raman and IR spectroscopy
The Raman spectra were measured with a triple monochro-mator micro-Raman spectrometer (Dilor XY), equipped with a CCD detector and using the 4880 A˚ exciting line of the Ar-laser. The Raman scattering was measured in a back scattering geometry directly from the powder.
The IR spectra were measured using KBr pellets made from a mixture of powder for each glass composition. The pellet thickness varied from 0.5 to 0.6 mm. The IR spectra were
measured from 400 to 1400 cm1 with a NICOLET 5ZPX FT-IR
spectrometer.
2.3. Microwave dielectric properties
Dielectric properties at microwave frequencies (MW) were measured in the 3–6 GHz frequency range. The end-shorted
method proposed by Hakki and Coleman[12]and later modified
by Courtney[13]was employed for the evaluation of the relative dielectric constant using the TE011 mode. The dielectric quality
factor of the samples was measured by the cavity method [14]
using the TE01dresonant mode. The microwave dielectric proper-ties were determined using a vector network analyzer (HP8716ET) at room temperature.
3. Results and discussion
3.1. XDR and Rietveld analysis
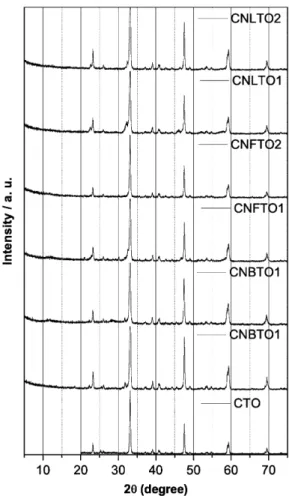
The XRD patterns of polycrystalline samples are shown in Fig. 1. Complete solubility was observed, a single perovskite structure with no second phases is observed for all compositions. In the Rietveld procedure, a model based on a reference for calcium titanate oxide[15]was used.
The crystal structure of the series at room temperature present an orthorombic structure belonging to a spatial group Pbmn. In this structure the calcium and oxygen are localized in the Wyckoff position 4c, where the oxygen ion occupies the site 8d and iron, bismuth, lithium and niobium occupies the site 4b. The refine-ment is illustrated inFig. 2(a).
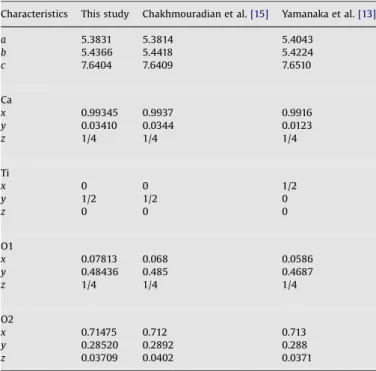
In all cases, the XRD patterns comprise only the diffraction lines of perovskite-type phases. The results of the refinement for x¼0 compare well with the previously published single-crystal and Rietveld structural data, as presented inTable 1.
The crystallographic characteristics of the proposed substitu-tion of titanium by niobium and bismuth (CNBTO1 forx¼0.1 and
CNBTO2 for x¼0.2) in B-site are presented in Table 2 The
substitution by niobium and iron (CNFTO1 and CNFTO2) are presented inTable 3and the substitution by niobium and lithium (CNLTO1 and CNLTO2) are presented inTable 4. In all series in this work the orthorhombic distortion of the perovskite structure persists due to the proposed small substitution of titanium.
InFigs 2–4we have the graphical criteria for the global view of the CNBTO1, CNBTO2, CNFTO1, CNFTO2, CNLTO1 and CNLTO2.
The major numerical criteria of fit for this analysis were
RWP, SGoF and dDW are presented inTable 5. From a purely
mathematical point of view, RWP is the most meaningful of the R’s because the numerator is the residual being minimized[10]. As shown in theTable 5. The value of the dDW shows the serial correlation of the refinement, where an ideal value should be around 2. This is an indication of an insignificant serial correlation in the refinement process. The obtained values of SGoF, around 1.0, are adequate and the refinement associated to CNFTO2 is effective.
3.2. Raman spectroscopy
The Raman spectrum of CaTiO3agrees well with that of Zheng et al.[4], where eight principal Raman bands are observed at 183, 227, 247, 288, 339, 470, 494 and 641 cm–1. The band observed at
641 cm–1 can be assigned to the TiO symmetric stretching
vibration[4].The bands at 470 and 494 cm–1are assigned to TiO torsional (bending or internal vibration of oxygen cage) modes, in agreement with Hirata et al. [16,17]. The bands in the region 225–340 cm–1 are tentatively assigned to the modes associated with rotations of oxygen cage and the band at 183 cm–1is mainly due to the motion of A-site ions.
Fig. 5shows the Raman spectra of Ca(Nb1/2Bi1/2)xTi1–xO3 for x¼0, 0.1, and 0.2. According to Zheng et. al[4], the presence of similar bands at 805 cm–1 may be related to the cation order/
disorder usually observed only in complex perovskites. As x
Table 1
CaTiO3 (x¼0): comparison with previously published structural data.
Characteristics This study Chakhmouradian et al.[15] Yamanaka et al.[13]
a 5.3831 5.3814 5.4043
b 5.4366 5.4418 5.4224
c 7.6404 7.6409 7.6510
Ca
x 0.99345 0.9937 0.9916
y 0.03410 0.0344 0.0123
z 1/4 1/4 1/4
Ti
x 0 0 1/2
y 1/2 1/2 0
z 0 0 0
O1
x 0.07813 0.068 0.0586
y 0.48436 0.485 0.4687
z 1/4 1/4 1/4
O2
x 0.71475 0.712 0.713
y 0.28520 0.2892 0.288
z 0.03709 0.0402 0.0371
Table 2
Crystallographic characteristics for CNBTO1 and CNBTO2.
Sample CNBTO1 CNBTO2
Atom Ca Ti Bi Nb O1 O2 Ca Ti Bi Nb O1 O2
Wyckoff 4c 4b 4b 4b 4c 8d 4c 4b 4b 4b 4c 8d
X 0.994 0 0 0 0.071 0.714 1.009 0 0 0 0.225 0.747
Y 0.030 1/2 1/2 1/2 0.469 0.284 0.041 1/2 1/2 1/2 0.261 0.279
Z 1/4 0 0 0 1/4 0.040 1/4 0 0 0 1/4 0.068
B 1.17 0.92 0.92 0.92 0.5 1.6 1.17 0.92 0.92 0.92 0.5 1.6
S0 1.0 0.9 0.05 0.05 1.288 1.834 1 0.800 0.1 0.1 1 1
Table 3
Crystallographic characteristics for CNFTO1 and CNFTO2.
Sample CNFTO 1 CNFTO2
Atom Ca Ti Fe Nb O1 O2 Ca Ti Bi Nb O1 O2
Wyckoff 4c 4b 4b 4b 4c 8d 4c 4b 4b 4b 4c 8d
X 0.993 0 0 0 0.077 0.713 1.019 0 0 0 0.003 0.719
Y 0.030 1/2 1/2 1/2 0.472 0.273 0.007 1/2 1/2 1/2 0.408 0.223
Z 1/4 0 0 0 1/4 0.033 1/4 0 0 0 1/4 0.039
B 1.17 0.92 0.92 0.92 0.5 1.6 1.17 0.92 0.92 0.92 0.5 1.6
S0 1 0.9 0.05 0.05 1 1 1 0.680 0.143 0.100 1 1
Table 4
Crystallographic characteristics for CNLTO1 and CNLTO2.
Sample CNLTO 1 CNLTO2
Atom Ca Ti Fe Nb O1 O2 Ca Ti Bi Nb O1 O2
Wyckoff 4c 4b 4b 4b 4c 8d 4c 4b 4b 4b 4c 8d
X 0.993 0 0 0 0.077 0.713 1.019 0 0 0 0.003 0.719
Y 0.030 1/2 1/2 1/2 0.472 0.273 0.007 1/2 1/2 1/2 0.408 0.223
Z 1/4 0 0 0 1/4 0.033 1/4 0 0 0 1/4 0.039
B 1.17 0.92 0.92 0.92 0.5 1.6 1.17 0.92 0.92 0.92 0.5 1.6
increases, a small shift occur in several peaks and a small band at 159 cm–1have a decrease in its intensity.
Fig. 6 and 7shows the Raman spectra of Ca(Nb1/2Fe1/2)xTi1–xO3 and Ca(Nb2/3Li1/3)xTi1–xO3forx¼0, 0.1 and 0.2 . Asxincreases, a small shift occurs in several peaks.
In all Raman spectrum of the studied samples, a small band at 805 cm–1, that is increasing in intensity as x increases can be observed. According to Zheng et. al. [4], the presence of similar bands at 805 cm–1 may be related to the cation order/disorder usually observed in complex perovskites.
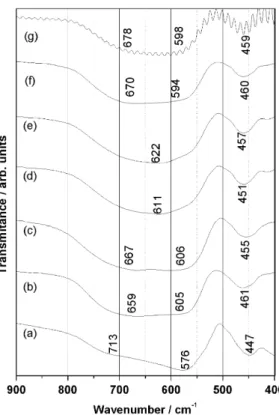
3.3. Infrared (IR)
Fig. 8shows the IR transmission spectra of studied compounds. In CaTiO3, three transmission peaks clearly appear near 461, 608 and 667 cm–1[18]. According to Kim[18], the two peaks with the higher frequency correspond to TiO bond stretching mode, and
each peak corresponds to two different bond lengths due to the Jahn–Teller distortion. According to Lu[19], the absorption peak at 530 cm1may be the reflection of the electrical property.
Fig. 2.Calculated (line) and observed (circle) XDR patterns and difference spectrum for CNBTO1 (bottom) and CNBTO2 (up). For agreement factors see Table 2.
Fig. 3.Calculated (line) and observed (circle) XDR patterns and difference spectrum for CNFTO1 (bottom) and CNFTO2 (up). For agreement factors see Table 3.
Fig. 4.Calculated (line) and observed (circle) XDR patterns and difference spectrum for CNLTO1 (bottom) and CNLTO2 (up). For agreement factors see Table 4.
Table 5
Numerical criteria of fit.
Sample RP (%) RWP (%) SGoF dDW
CNBTO1 12.93 17.99 1.37 0.89
CNBTO2 13.23 17.06 1.49 0.65
CNFTO1 13.87 18.95 1.42 0.75
CNTFO2 12.61 16.88 1.19 1.33
CNLTO1 13.61 18.46 1.45 0.81
CNLTO2 12.39 16.72 1.29 0.89
InFig. 8(a) three transmission peaks can be observed near 447, 576 and 713 cm1. These values are slightly different, but close to
previously published results[18].
In Figs. 8(b–c) the three transmissions peaks of CTO can be observed in the IR spectrum of the samples with niobium/ bismuth substitution forx¼0.1 (CNBTO1) and 0.2 (CNBTO2), in the region of 605–667 cm1and a third band around 460 cm1.
InFig. 8(d) and (e) is possible see only two peaks: at 451 and 611 cm–1. They can be assigned to a union of two Ti–O stretching mode with different bond lengths, resulting in only one bond Ti–O, affected by the presence of niobium to the iron atom.
For the samples CNFTO and CNLTO the first band is more
broaden and the low energy band is around 457 cm1 is less
sensitive to the titanium site substitution by niobium/iron (8d) and (8e) and niobium/lithium, respectively, (8f) and (8g).
3.4. Microwave properties
All samples were measured at 3–5 GHz, the dielectric proper-ties, such as the dielectric constant (k), the quality factor (Quf)
of the studied ceramics are summarized in Table 6. Under the
same sintering conditions, the k value decreases and Quf
increased with increasing the substitution of titanium for all samples. Dielectric constant values of studied samples are in range 25–35 and dielectric losses at order of 103, allowing this material to be a good candidate to be used as a microwave component.
Fig. 6.Raman spectra of CNFTO ceramics.
Fig. 7.Raman spectra of CNLTO ceramics.
Fig. 8.Infrared spectra of: (a) CTO (b) CNBTO1, (c) CNBTO2, (d) CNFTO1, (e) CNFTO2, (f) CNLTO1 and (g) CNLTO2 ceramics.
Table 6
Microwave properties.
Sample Sinterization condition
fr (GHz)
k tgd Qu Quf
(GHz)
CNBTO1 11001C/3 h 4.223 34.35 11.9103 83.13 351.06 CNBTO2 11001C/3 h 4.533 29.28 6.5103 151.46 665.06
4. Conclusions
In this paper the structural characteristics of the B-site modified calcium titanate ceramics was discussed. The compounds were prepared by the conventional solid-state method and they were studied using XRD, IR, Raman scattering spectroscopy and micro-wave properties. The samples belongs to the Pbmn spatial group. A refinement analysis was performed and discussed. A quantitative phase analysis (QPA) of the samples, originated from the refinement procedure, was obtained and we can observe a good agreement with a previously published single-crystal study.
The dielectric permittivity and loss at MW were investigated. The CNLTO phase, present the highest dielectric constant (k¼35.8) at 3.9 GHz with loss (tg
a
¼7103). The lowest value of k¼25.7
(f¼4.8 GHz) and tg
a
¼3103, was obtained for the CNFTO phase. These measurements confirm the possible use of such material for microwave devices like dielectric resonator antennas.Acknowledgments
This work was partly sponsored by CAPES, CNPq, FUNCAP (Brazilian agencies) and the US Air Force Office of Scientific Research (AFOSR) (FA9550-06-1-0543 and FA9550-08-1-0210).
References
[1] B.D. Lee, H.R. Lee, K.H. Yoon, Y.S. Cho, Ceram. Intern. 31 (1) (2005) 143. [2] P. Liu, H. Ogawa, E.S. Kim, A. Kan, J. Eur. Ceram. Soc. 24 (2004) 1761. [3] T. Liu, X.-Z. Zhaow, J. Amer. Ceram. Soc. 89 (3) (2006) 1153.
[4] H. Zheng, G.C. de Gyorgyfalv, R. Quimby, H. Bagshaw, R. Ubic, I. Reaney, J. Yarwood, J. Eur. Ceram. Soc. 23 (14) (2003) 2653.
[5] F. Zhao, Z. Yue, Y. Lin, Z. Gui, L. Li, J. Eur. Ceram. Soc. 25 (14) (2005) 3347.
[6] L. Li, X.M. Chen, X.C. Fan, J. Amer. Ceram Soc. 89 (2) (2006) 557.
[7] S. Kucheiko, D.-H. Yeo, J.-W. Choi, S.-J. Yoon, H.-J. Kim, J. Amer. Ceram Soc. 85 (5) (2002) 1327.
[8] H. Rietveld, Acta Cryst. 22 (1) (1967) 151. [9] H. Rietveld, J. Appl. Cryst. 2 (2) (1969) 65.
[10] R. Young (Ed.), The Rietveld Method, International Union of Crystallography Monographs on Crystal, vol. 5, Oxford University Press/IUCr, 1995. [11] R. Young, A. Sakthivel, T. Moss, C. Paiva-Santos, J. Appl. Cryst. 28 (3) (1995)
366 URL.
[12] Hakki, Coleman, IRE Trans. Micro. Th. Tech. 3 (1960) 402. [13] W.B. Courtney, IEEE Trans. Micro. Th. Technol. (1970) 476.
[14] J. Krupka, K. Derzakowski, B. Riddle, J.B. Jarvis, Meas. Sci. Technol. 9 (1998) 1751.
[15] A.R. Chakhmouradian, R.H. Mitchell, J. Sol. Stat. Chem. 138 (2) (1998) 272.
[16] T. Yamanaka, N. Hirai, Y. Komatsu, Amer. Miner. 87 (8–9) (2002) 1183. [17] T. Hirata, K. Tong, T. Negas, J. Sol. Stat. Chem. 124 (2) (1996) 353.
[18] K.H. Kim, M. Uehara, C. Hess, P.A. Sharma, C.-W. Cheong, Phys. Rev. Lett. 84 (2000) 2961.