PERMANENT DEFORMATION CHARACTERIZATION OF BITUMINOUS MIXTURES:
LABORATORY TESTS
Dinis Gardete*
Assistant, Department of Civil Engineering of the Superior School of Technology of the Polytechnic School of Castelo Branco,
*EST-IPCB, Av. Do Empresário, 6000-767 Castelo Branco, Portugal, [email protected] Luís Picado-Santos
Associate Professor, Department of Civil Engineering of the FCT of the University of Coimbra
Jorge Pais
Associate Professor, Department of Civil Engineering of the University of Minho
ABSTRACT: In the last years some laboratory testing has been used to predict the permanent deformation
behavior of bituminous mixtures. The tests methods used in Portugal include the Wheel Tracking test, the Cyclic Compression Test (Uniaxial and Triaxial) and the Repetitive Shear at Constant Height (RSCH) test. There are also the new European standards for those tests methods, with the exception of the RSCH which is essentially used in the USA. Some of testing conditions are not well defined. Therefore, it is important to study the reliability and accuracy of each test in the task of predicting permanent deformation behaviour. In this work these test methods were used in the evaluation of a commonly used mixture in Portugal. Results show that all tests are suitable for predicting permanent deformation behaviour. Thus simpler and cheaper tests are the more interesting to use.
KEY WORDS: Permanent deformation, bituminous mixtures, laboratory tests
1. INTRODUCTION
The permanent deformation of bituminous mixtures is a common cause of distress. However a simple and effective methodology to evaluate behaviour to permanent deformation is not available in current practice. In Portugal the summer high temperatures and the growing heavy vehicle traffic are motives of concern. It is expected that failures in road pavements due to permanent deformation in bituminous mixtures will increase. It is therefore of great importance to evaluate the permanent deformation behaviour in a simple but accurate way [1].
In the last years laboratory tests like Wheel-Tracking, Uniaxial Cyclic Compression, Triaxial test and epeated Shear at Constant Height have been used to study this matter [2]. European standards for these tests have recently become available, except for the Repeated Shear at Constant Height, which is used mainly in the USA. The use of these tests in current practice is of great interest but some questions remain to be resolved. The procedures in some tests are not totally defined and the limits to the test results are far from being well-known. It is not easy to solve these questions in particular because there will probably be variations from country to country according to the local conditions and practice.
Another issue of concern is that these four tests are intended to achieve the same goal. In the Portuguese practice, the existence of several types of permanent deformation characterisation test has no interest. It became necessary to select the one that gives the best results for local conditions. Therefore, the propose of this work was to study their reliability for Portuguese conditions to determine how well they could perform and which would be most suitable.
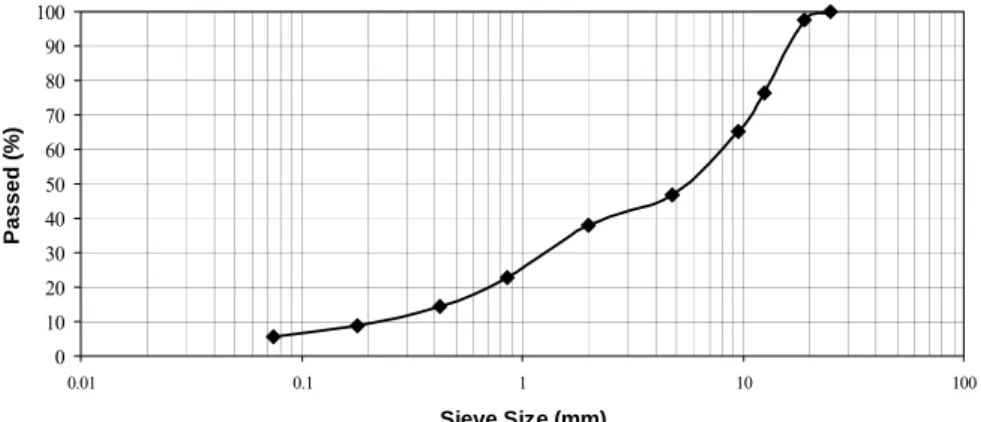
A typical Portuguese bituminous mixture was used in this study [3]. This mixture is commonly used in base and binder layers. Portuguese practice has indicated that this is a rather stiff mixture. The mixture was made using a limestone aggregate. The aggregate gradation curve is shown in Figure 1.
Aggregate Gradation 0 10 20 30 40 50 60 70 80 90 100 0.01 0.1 1 10 100 Sieve Size (mm) P a s sed ( % )
Figure 1. Aggregate Gradation curve
Three different series of specimens were made using three different percentages of bitumen in order to
have different behaviours to permanent deformation. The percentages of bitumen used were 3.7%,
4.2% and 4.7%. These percentages are in the range used in Portugual. For each test, laboratory
specimens and cored specimens in a road pavement were used.
2.1 Wheel-Tracking Tests
This test followed the prEN 12697-22 [4] method. I
t used the small size device model A, with temperature conditioning of the specimen made in air. The samples were compacted with a small drum roller. Each test takes 45 minutes with 21 load cycles per minute. The test temperature used was 45 ºC. This value was chosen because it is representative of Portuguese conditions for in-service temperatures in the pavement at a depth of 10cm [6]. At the temperature of 45 ºC, the mixture had a flexural resistance that permits evaluation of the test methods sensitivity with a realistic behaviour, which would not the case if the chosen test temperature used had been 60º C.Six laboratory and nine in situ cored specimens were tested. Each specimen dimension was 305*305*80 mm3. In Figure 2 and Table 1 the results of the Wheel-Tracking test are presented. This has a deformation curve showing the axial deformation (mm) versus time (s). On the linear part of the curve the deformation rate (TRm) [4] was determined from minute 30 to minute 45. The average axial deformation in the test (d45) is also shown.
Laboratory Specimens 0.0 0.5 1.0 1.5 2.0 2.5 3.0 3.5 4.0 0 5 10 15 20 25 30 35 40 45 Minutes D e fo rm a ti o n [m m ] Cored Specimens 0.0 0.5 1.0 1.5 2.0 2.5 3.0 3.5 4.0 0 5 10 15 20 25 30 35 40 45 Minutes De fo rm a ti o n [ mm] 3,7 % 4,2 % 4,7 %
Table 1. Wheel Tracking results
Pb [%] Origin Bulk Specific Gravity [g/cm3] d45 [mm] TRm [mm/h] 3,7 Laboratory 2.40 2,30 1,18 4,2 Laboratory 2.37 3,19 2,07 4,7 Laboratory 2.38 2,49 2,25 3,7 Cored 2.35 2,91 3,32 4,2 Cored 2.39 3,70 3,67 4,7 Cored 2.40 4,80 4,32
Figure 3 shows the relation between the percentage in bitumen and the deformation ratio (TRm) obtained in the test. The correlation factors are very high. The results indicate that higher percentages of bitumen lead to higher deformation rates for both laboratory and pavement cored specimens. This is a normal result regarding
permanent deformation behaviour.
Cored Specimens 0.0 1.0 2.0 3.0 4.0 3.5 4.0 4.5 5.0 Percentage of Bitumen [%] T R m [ mm/h ] Laboratory Specimens 0.0 1.0 2.0 3.0 4.0 3.5 4.0 4.5 5.0 Percentage of Bitumen [%] T R m [ mm/h ]
Figure 3. Relation between the TRm and the percentage in bitumen for laboratory and cored samples
2.2 Uniaxial Cyclic Compression Test
For this test the standard prEN 12697-25 [5] was followed.
The Uniaxial Cyclic Compression test is performed using specimens with 150 mm diameter and 100 mm height. The prEN 12697-25 states that the upper loading plate should have a diameter of only 96mm. Both laboratory made and in situ cored specimens were tested. The laboratory specimens were compacted using a vibratory plate. The applied load had a haversine shape with 1sec of loading time and 1sec of rest time. The test duration was 3600 cycles and the test temperature was 45 ºC. The maximum axial stress was 150 kPa. Figure 4 shows the shape of the load applied.The result of this test is a deformation curve similar to the one presented in Figure 5 [6]. After a conditioning stage (phase 1), which simulates the post-compaction that takes place after placing the bituminous layer, the specimen is expected to be in “phase 2” (linear phase) of the evolution of permanent deformation. From “phase 2” it is possible to determine the Creep Rate (permanent strain over the number of cycles). In this work the Creep Rate was determined from cycle 2000 to cycle 3600.
Figure 5. Evolution of the deformation of bituminous mixtures
Table 2 and Figure 6 show the results obtained. The higher the bitumen percentage the higher the Creep Rate obtained. For both the laboratory specimens and the in situ cored specimens a higher bitumen percentage led to higher creep rates, confirming the results obtained with Wheel Tracking as expected.
Table 2. Results from the Uniaxial Cyclic Compression Test
Pb [%] Origin Bulk Specific Gravity
[g/cm3] Average Deformation [mm] [µstrain/cycle] Creep Rate
3.7 Laboratory 2.378 0.643 0.339 4.2 Laboratory 2.424 0.710 0.400 4.7 Laboratory 2.405 0.725 0.515 3.7 Cored 2.376 0.988 0.728 4.2 Cored 2.407 1.124 0.965 4.7 Cored 2.408 1.440 1.650
Uniaxial Cyclic Compression Test Lab. series
0 1000 2000 3000 4000 5000 6000 7000 8000 9000 0 1000 2000 3000 Loading Cycles A x ia l D e fo rm a tio n [ m ic ro s tr a in ] Lab 3.7% Lab 4.2 % Lab 4.7%
Uniaxial Cyclic Compression Test cored series
0 2000 4000 6000 8000 10000 12000 14000 16000 0 1000 2000 3000 Loading Cycles A x ia l D e fo rm a tio n [ m ic ro s tr a in ] Cored 3.7% Cored 4.2 % Cored 4.7%
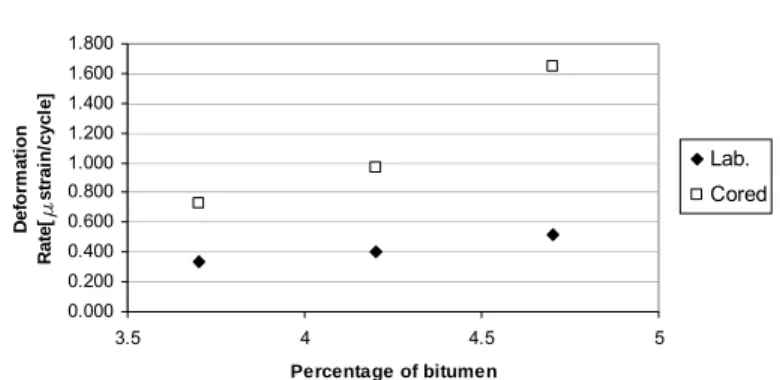
Comparing the evolution of Creep Rate with percentage of bitumen (Figure 7) it can be said that it is of the same type but with higher values for cored specimens (as for the total axial deformation, Table 2). The reasons for this should be related with the compaction characteristics for both types of specimens.
Uniaxial Cyclic Compression Test
0.000 0.200 0.400 0.600 0.800 1.000 1.200 1.400 1.600 1.800 3.5 4 4.5 5 Percentage of bitumen De fo rm a ti o n Ra te [ m s tr a in /c y c le ] Lab. Cored
Figure 7. Relation between Creep Rate and bitumen content
2.3 Repeated Shear at Constant Height
The Repeated Shear at Constant Height (RSCH) test followed procedure AASHTO TP7 [7]. The test was performed using specimens with 150mm diameter and 50mm height. Laboratory specimens were cored from a slab made in the laboratory and compacted with a small drum roller. Six specimens were made in the laboratory and six specimens were cored from a road pavement.
The test was performed at 45 ºC. Conditioning to test temperature was made in air for 2 hours. The load had a haversine shape corresponding to a 70kPa shear stress magnitude with a 0.1 sec loading time and 0.6 sec rest period. The tests had 5000 loading cycles.The results are presented in Table 3. The Dynamic Shear Modulus and Permanent Strain at 5000 Cycles were the parameters chosen to characterize the mixture behaviour.
Table 3. Results from the RSCH test Origin Pb [%]
Bulk Specific Gravity
[g/cm3] Shear Modulus [MPa] Perm. Shear Strain 5000 Cycles Lab. 3.7 2.393 144.4 0.0396 Lab. 4.2 2.400 195.1 0.0363 Lab. 4.7 2.387 128.8 0.0532 Cored 3.7 2.398 319.9 0.0084 Cored 4.2 2.373 260.1 0.0165 Cored 4.7 2.383 176.6 0.0264
From these results it seems that the shear modulus and permanent shear strain at 5000 cycles are able to assess behaviour of the mixture to permanent deformation. Both give the same classification of the mixtures as the other tests involved in this study. The laboratory specimens with 3.7 percent of bitumen seem to perform worst than the specimens with 4.2 percent of bitumen. This could be because only two specimens were tested. For the in situ cored specimens the classification of the mixtures is the correct one. In Figure 8 are shown the results for the laboratory and cored specimens.
RSCH Laboratory series 0.000 0.010 0.020 0.030 0.040 0.050 0.060 0 1000 2000 3000 4000 5000 6000 Cycles P e rm an en t sh ea r s te a in RSCH Cored series 0.000 0.005 0.010 0.015 0.020 0.025 0.030 0 1000 2000 3000 4000 5000 6000 Cycles P e rm an en t sh ear st ea in 3.7% 4.2% 4.7%
Figure 8. Results of the RSCH Test
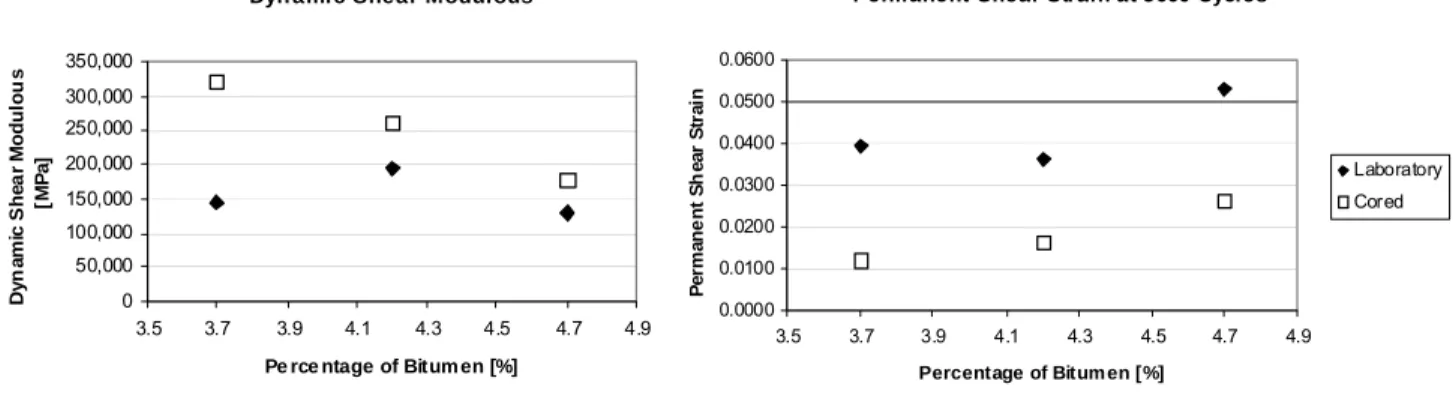
Figure 9 shows values for dynamic shear modulus and permanent strain at 5000 cycles versus bitumen content. The values show that the mixtures with higher percentage in bitumen had worst performance. The cored
specimens had better results than the laboratory made specimens. Both Dynamic Shear Modulus and Permanent Strain at 5000 cycles point at the same conclusions, with a similar classification of mixtures.
Dyn amic Shear Modulous
0 50,000 100,000 150,000 200,000 250,000 300,000 350,000 3.5 3.7 3.9 4.1 4.3 4.5 4.7 4.9
Pe rce ntage of Bitum en [%]
D y na m ic S h e a r M o d u lo us [M P a ] Laboratory Cored
Perm anent Shear Strain at 5000 Cycles
0.0000 0.0100 0.0200 0.0300 0.0400 0.0500 0.0600 3.5 3.7 3.9 4.1 4.3 4.5 4.7 4.9 Percentage of Bitum en [%] P e rm an e n t S h ear S tr a in Laboratory Cored
Figure 9. Values of Dynamic Shear Modulus and permanent shear strain versus bitumen content
2.4 Triaxial Tests
Standard prEN 12697-25 [5] was followed. T
his test is performed using specimens with 150mm diameter and 100mm height. The cored specimens where shorter with 80 to 90mm height. Because of the lowheight/diameter ratio a lubricant between the loading plates and the specimen was used. The applied load had a haversine shape with 1sec of loading time and 1sec of rest time. The test duration was 3600 cycles and the test temperature was 45ºC. The triaxial tests were made with three different tension levels, σ1=150 kPa and σc= kPa, σ1=300 kPa and σc=100 kPa, σ1=600 kPa and σc= 200kPa.
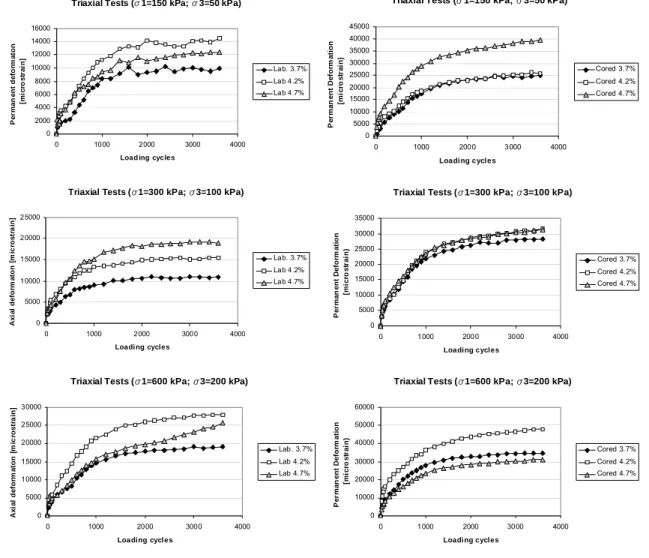
The results of this test are deformation curves similar to those obtained in the Uniaxial Cyclic Compression test. From the linear part of the curve it is possible to determine the Creep Rate [5]. In this work the Creep rate was determined between the cycle 2000 and the cycle 3600.
Triaxial Tests (s 1=150 kPa; s3=50 kPa) 0 5000 10000 15000 20000 25000 30000 35000 40000 45000 0 1000 2000 3000 4000 Loading cycles P e rm an en t D e fo rm at io n [m ic ro s tr a in ) Cored 3.7% Cored 4.2% Cored 4.7% Triaxial Tests (s1=150 kPa; s 3=50 kPa)
0 2000 4000 6000 8000 10000 12000 14000 16000 0 1000 2000 3000 4000
Load ing cycles
P e rm an en t d e fo rm at o n [m ic ro s tr a in ] Lab. 3.7% Lab 4.2% Lab 4.7%
Triaxial Tests (s1=300 kPa; s3=100 kPa)
0 5000 10000 15000 20000 25000 30000 35000 0 1000 2000 3000 4000 Loadi ng cycles P e rm an en t D e fo rm a tio n [m ic ro s tr a in ) Cored 3.7% Cored 4.2% Cored 4.7% Triaxial Tests (s1=300 kPa; s3=100 kPa)
0 5000 10000 15000 20000 25000 0 1000 2000 3000 4000 Loading cycles A x ia l de fo rm a ton [ m ic ro s tr a in ] Lab. 3.7% Lab 4.2% Lab 4.7%
Triaxial Tests (s1=600 kPa; s3=200 kPa)
0 5000 10000 15000 20000 25000 30000 0 1000 2000 3000 4000 Loading cycles A x ia l d e fo rm a to n [ m ic ro s tra in ] Lab. 3.7% Lab 4.2% Lab 4.7%
Triaxial Tests (s1=600 kPa; s3=200 kPa)
0 10000 20000 30000 40000 50000 60000 0 1000 2000 3000 4000 Loading cycles P e rm an en t D e fo rm at io n [m ic ro s tr a in ) Cored 3.7% Cored 4.2% Cored 4.7%
Figure 10. Triaxial Tests deformation curves
Table 4. Results from the Triaxial TestsOrigin Pb [%] Bulk Specific Gravity [g/cm3] σ1max [kPa] σc [kPa] Creep Rate [µstrain/cycle]
Lab. 3.7 2.409 150 50 0.333 Lab. 4.2 2.418 150 50 0.640 Lab. 4.7 2.435 150 50 0.852 Lab. 3.7 2.404 300 100 0.262 Lab. 4.2 2.414 300 100 0.374 Lab. 4.7 2.429 300 100 0.558 Lab. 3.7 2.413 600 200 0.858 Lab. 4.2 2.428 600 200 0.858 Lab. 4.7 2.420 600 200 3.576 Cored 3.7 2.375 150 50 1.241 Cored 4.2 2.365 150 50 1.729 Cored 4.7 2.417 150 50 2.738 Cored 3.7 2.399 300 100 1.131 Cored 4.2 2.383 300 100 1.939 Cored 4.7 2.398 300 100 1.859
Cored 3.7 2.364 600 200 1.357
Cored 4.2 2.369 600 200 1.200
Cored 4.7 2.395 600 200 2.765
The results show that specimens with higher bitumen content had higher Creep Rates. This is more evident in the laboratory specimens, the cored specimens had higher Creep Rates but the classification of the mixtures is more imprecise. The deformation rates also increased with the increase of the differential stress.
Triaxial Test Lab. series
0.000 1.000 2.000 3.000 4.000 3.5 4 4.5 5 Percentage of Bitumen [%] Cr ee p R a te [ m st ra in /cyc le ] 150/50 300/100 600/200
Triaxial Test Lab. series
0.000 0.500 1.000 1.500 2.000 2.500 3.000 3.5 4 4.5 5 Percentage of Bitumen [%] Cr e e p Ra te [ m st ra in /cyc le ] 150/50 300/100 600/200
Figure 11. Creep Rate versus the bitumen content
3. RESULTS ANALYSIS
Analyses of the results show that the four tests are able to differentiate behaviour of the three mixtures. If mixture type and test conditions are considered, it is possible to say that the results show that these tests are very precise. In the following figures the results of several tests are plotted. Correlation between the Wheel Tracking test with the other tests is shown. For simplicity, only the correlations with the Wheel Tracking tests are shown. With a higher percentage of bitumen, higher deformation rates were obtained. This is valid for both the
laboratory specimens and in situ specimens. Good correlations were obtained when the results of the different test are compared.
Laboratory Specimens R2 = 0.738 0.0 0.2 0.4 0.6 0.8 1.0 1.0 1.5 2.0 2.5 TRm (mm/h) Cr e e p Ra te [ m s tr a in /c y c le ] Cored Specimens R2 = 0.990 0.0 0.5 1.0 1.5 2.0 3.2 3.4 3.6 3.8 4.0 4.2 4.4 TRm (mm/h) Cr e e p Ra te [ m st ra in /c ycl e]
Laboratory Specimens R2 = 0.2268 0.0 0.1 0.1 0.2 0.2 1.0 1.5 2.0 2.5 TRm (mm/h) P e rm an e n t S h ear S trai n 50 00 C y c les Cored Specimens R2 = 0.988 0.0 0.0 0.0 0.0 0.0 0.1 3.2 3.4 3.6 3.8 4.0 4.2 4. TRm (mm/h) Pe rm a n e n t Sh e a r St ra in 50 00 C y c les 4
Figure 13. Relation between the RSCH Test and the Wheel Tracking Test
Laboratory Specimens R2 = 0.934 R2 = 0.7662 R2 = 0.397 0.0 0.5 1.0 1.5 2.0 2.5 3.0 3.5 1.0 1.5 2.0 2.5 TRm (mm/h) Cr e e p Ra te [ m s tr a in/c y c le ] 150/50 300/100 600/200 Laboratory Specimens R2 = 0.9993 R2 = 0.5006 R2 = 0.8159 0.0 0.5 1.0 1.5 2.0 2.5 3.0 3.2 3.7 4.2 4.7 TRm (mm/h) Cr e e p R a te [ m st ra in /cy c le] 150/50 300/100 600/200
Figure 14. Relation between the Tri-axial Test and the Wheel Tracking Test
4. CONCLUSIONS
All tests gave the same classification of the mixtures and allow to conclude that higher bitumen percentages correspond to higher deformation rates. This was true for both the laboratory made and the cored specimens. Good correlations between the results of the different tests could be established. This means that they all characterize in the same way the behaviour of bituminous mixtures to permanent deformation.
Use of tests like the Wheel tracking test or the Uniaxial Cyclic Compression test seem to be more interesting, as they are capable of characterizing the behaviour of bituminous mixtures to permanent deformation and have simpler procedures and equipment. For the conditions used in this study the Wheel-Tracking Test and the Uniaxial Cyclic Compression test had better results in differentiating the mixtures and the classification was clearer.
The deformation rate obtained in the Wheel-Tracking Test and the creep rate obtained in the Uniaxial Cyclic Compression test are suitable values to characterize bituminous mixtures to permanent deformation.
The laboratory specimens behave better in all tests except in the RSCH test. This could be explained by the manufacture process. But, more important is the fact that the rating of the mixtures is equal for the laboratory and cored specimens.
It can be concluded that all the tests investigated can be used in the characterization of bituminous mixtures to permanent deformation. The less complex and cheaper tests such as Wheel Tracking and Uniaxial Cyclic Compression appear to offer best practise.
REFERENCES:
[1] Pereira, P. and L. Picado Santos. Pavimentos rodoviários. Authors Edition, 2002.
[2] Brown, E. R., P. S. Kandhal and J. Zhang. Performance testing for hot mix asphalt (executive
summary),NCAT Report No. 2001-05A, NCAT Auburn University, Alabama, 2001.
[3] Caderno de Encargos do Instituto Português de Estradas, 1998.
[4] prEN 12697-22 Bituminous mixtures – Test methods for hot mix asphalt – Wheel Tracking. CEN, 2002. [5] PrEN 12697-25 Bituminous mixtures – Test methods for mix asphalt – Part 25: Cyclic compression test.
CEN, 2001.
[6] Freire, A., M. Antunes and L. Picado-Santos. Permanent Deformation of Bituminous Mixtures.
Proceedings of the Third International Symposium on Maintenance and Rehabilitation of Pavements and Technological Control (MAIREPAV’03), Ed. Pereira, P. and Branco, F. (eds.), pp. 455-464, Guimarães,
2003.
[7] AASHTO TP7-01 Standard Test Method for Determining the Permanent Shear Strain and Stiffness of

![Table 2. Results from the Uniaxial Cyclic Compression Test Pb [%] Origin Bulk Specific Gravity](https://thumb-eu.123doks.com/thumbv2/123dok_br/15974190.1101985/4.918.108.821.848.1019/table-results-uniaxial-cyclic-compression-origin-specific-gravity.webp)