Contents lists available atScienceDirect
Land Use Policy
journal homepage:www.elsevier.com/locate/landusepol
A land-cover based urban dispersion indicator suitable for highly dispersed,
discontinuously arti
ficialized territories: The case of continental Portugal
Pablo Urbieta
a,⁎, Emilio Fernandez
c, Luís Ramos
a, Gonzalo Méndez Martínez
d, Ricardo Bento
baDepartment of Engineering, University of Trás-os-Montes e Alto Douro, Quinta de Prados, 5000-801, Vila Real, Portugal
bCentre for Transdisciplinary Development Studies (CETRAD), Department of Engineering, University of Trás-os-Montes and Alto Douro (UTAD), Quinta de Prados,
5000-801, Vila Real, Portugal
cDepartment of Ecology and Animal Biology, University of Vigo, Campus Lagoas Marcosende, 36310, Vigo, Spain
dFacultade de Ciencias do Mar, Departamento de Xeociencias Mariñas e Ordenación do Territorio, Universidade de Vigo, Edif. Ciencias Experimentais. Campus
Universitario, 36310, Vigo, Spain
A R T I C L E I N F O Keywords: Artificialization patterns Low-density Highly-dispersed population Dispersion indicator Continental Portugal A B S T R A C T
Land-cover based indicators assessing the effect of the magnitude and spatial patterns of the artificialization process, including urban sprawl, barely consider the impact of the discontinuous spatial distribution of the artificialized built-up areas. In this study, we propose a new urban dispersion indicator, which incorporates the characteristic dynamics of the discontinuous urban artificial land cover class, characteristic of scarcely populated and highly dispersed territories, such as is the case of Continental Portugal. The indicator is based on the premise that the more built-up area, the higher the uptake of constructed area in a discontinuous pattern and the more dispersed this built-up area, the lower urban sustainability of the territory. Given that the minimum cartographic unit in Corine Land Cover (25 ha) is typically higher than most of the discontinuous urban patches in these territories, in this research we used national land use data from Portugal with a minimum cartographic unit of 1 ha.
The values calculated for this indicator show that the level of urban dispersion of continental Portugal in-creased by 14.2% in the 1990–2007 period. The artificialization process was geographically heterogeneous with notable differences being observed between regions and also along the urban to rural and coastal to hinterland gradients. The temporal changes in the indicator allowed the identification of distinct artificialization patterns: diffusion, sprinkling and coalescence, which were interpreted on the basis of the evolution of the artificialization process. The values derived from this indicator were related with two main environmental impacts associated with the artificialization process: the loss of arable land and the decrease in the carbon sequestration capacity of the territory. The proposed indicator can be a useful tool to monitor and evaluate the impacts of different public policies with a direct impact on land artificialization, as well as on the territorial and urban planning processes, whether at the national, regional or municipal level, allowing more detailed and consistent spatial analyses and diagnoses of urban sustainability to be undertaken.
1. Introduction
The explosive outburst experienced by the human populations since the industrial revolution, particularly over the lastfive decades, sig-nificantly increased the anthropogenic impacts on terrestrial and aquatic ecosystems (Vitousek et al., 1997). The human influence on the earth dynamics is nowadays of such magnitude that led some authors to postulate the entrance on a new geological era: the Anthropocene (Crutzen and Stoermer, 2000).
Land use transformation to produce goods and services represent
one of the most significant human-driven changes on the territory and its anthropogenic occupation potentially alters the structure and func-tioning of terrestrial ecosystems, thereby modifying the way they in-teract with the atmosphere and the aquatic systems. It was estimated that 80% of the Earth’s land surface has been modified by humans (Vince, 2011). In 2000, croplands covered 12% of Earth’s ice-free land, while pastures occupied another 26%. Altogether, agriculture accounts for about 38% of Earth’s terrestrial surface, the largest use of land on the planet, whereas 30% was covered by forests (Foley et al., 2011).
Enhanced artificial land cover is closely associated with the
https://doi.org/10.1016/j.landusepol.2019.03.048
Received 26 October 2017; Received in revised form 25 March 2019; Accepted 28 March 2019 ⁎Corresponding author.
E-mail address:pablourbieta@utad.pt(P. Urbieta).
0264-8377/ © 2019 Elsevier Ltd. All rights reserved.
expansion of cities and transport infrastructures, leading to a high rate of land and natural resources consumption and to significant effects on biodiversity and carbon pools (e.g.Seto et al., 2012). The Earth’s land surface occupied by urban areas was 0.51% in 2001 (Schneider et al., 2009). The global urban expansion rate is estimated at 2.0 million hectares per year, most of this expansion intruding into agricultural land (80%), 10% into forests and a similar fraction into woodland/ grassland (Angel et al., 2005). These accelerated land transformation rates have significant effects on the global carbon cycle. Urban areas control 20–25% of land carbon uptake and emissions and even new carbon pools of considerable magnitude, such as buildings or landfills, have been created (Churkina, 2016).
The availability of maps of the European environmental landscape based on the interpretation of satellite images, the CORINE Land Cover (CLC) analytical tool, allowed to explore changes in land cover, in particular artificial land, at the European national and regional levels (EEA, 2000). The analysis of European land-use dynamics between 2000 and 2012 showed that artificial surfaces were the class showing a higher increase. The estimated average annual land take for the Eur-opean Union Countries in that period was 926 km2(EEA, 2017). Por-tuguese, Irish and Spanish coastal zones showed the highest increases in artificial surfaces in the EU (20–35 % in the 2000–2006 period) (EEA, 2006).
One of the land artificialization patterns more frequently in-vestigated is urban sprawl. Sprawl was initially considered to be caused by the rise of car ownership and by single-use zoning policies, a phe-nomenon mostly associated to suburban extensions of American cities where leapfrog or scattered growth with large expansions of low-den-sity or single-use development prevailed (Ewing, 1997).
Urban sprawl has been a subject of scientific discussion in the last decades (see e.g., Frenkel and Ashkenazi, 2008), and a general con-sensus on its definition and, subsequently, on how it should be mea-sured is still to be achieved. Some studies refer to urban sprawl as the degree a given landscape is permeated by buildings. So that, the more area built over in a territory and the more dispersed the buildings, the higher the degree of urban sprawl. Urban sprawl therefore denotes the extent of the built-up area and its dispersion in the landscape, excluding the causes, consequences, and assessment of the phenomenon itself (Jaeger et al., 2010). Most of the investigations did not refer sprawl as an urban phenomenon, but as a low-density residential development (Burchell and Galley, 2003). Other studies, however, consider sprawl as a phenomenon of fast, disordered, unsystematic and weakly dense ar-tificialization of settlements mainly concentrated in suburban areas with a low population density affecting rural area in the fringes of urban agglomerations (Ermer et al., 1994;Romano and Zullo, 2014).
The impact of the artificialization process on territorial sustain-ability is not only related to the magnitude of anthropogenic transfor-mation of the natural landscape but is also dependent on the spatial pattern whereby this process takes place. The artificialization process based on dispersed settlement has been a feature of cities since the earliest times. Dispersion is an intrinsic urban process related to the economic development of cities. Thus, all industrialized cities have experienced a dispersal of population from the compact centre to the dispersed peripheries. Urban dispersion rose from the struggle against the first industrial cities, which were important focus of congestion, pollution and disease. Hence, for many years planners and reformers complained not of low-density settlements, but of high-density built environments. Conversely, decades later, the desire for the compact city resurfaced after the myriad of problems associated with the dispersed urban form (Catalán et al., 2008).
Enhanced discontinuous artificial land cover is generally caused by the spread of unplanned urban spots in the suburbs developed along the main roads, an artificialization pattern responsible for environmental and economic effects such as habitat degradation, fragmentation and loss (Council of the European Union, 2010), occupation of areas pre-viously occupied by agriculture and forests (Caetano et al., 2009), high
energy consumption in the residential, commercial and transport sec-tors (EEA, 2010) or elevated costs associated with the supply of public services (Silva and Clarke, 2002), among others.
Patterns of artificialization largely differ among territories implying that the particular characteristics of the regions must be taken into consideration. Urban sprawl, characteristic of environments with high population densities and predominantly urban growth, conform little with other situations where most of the new, low-density population settlements ARE not associated with urban and suburban economical activities but with the development of new artificial areas in non-urban landscapes. This is true, for example, in large regions of the Continental Portuguese territory, where urban diffusion largely consisted of a large land take with a partially spontaneous development, or subject to low controls, adding on to a historical structure. This artificialization pat-tern, characteristic of very low human population densities, was in-itially defined as sprinkling byRomano and Zullo (2016) in the Po Valley and later analyzed in the whole Italian territory (Romano et al., 2017a). These newly built-up areas account for a small fraction of the total territory. They are distributed in scattered patches, not homo-geneous in size and use, and generally characterized by a mixture of rural, residential, industrial, and tertiary functions (Romano et al., 2017a).The sprinkling phenomenon can be therefore considered as a sort of urban“pulverization” of the territory, i.e. diffusion is driven in this case by an increase in the number of urban patches throughout the landscape rather than by the extension of pre-existent patches. Conse-quently, the dispersion of buildings and related urban facilities is dif-ficult to detect and measure with common land cover maps, unless they are sufficiently detailed, as in our research.
Urban sprawl and sprinkling have been characterized based on the densities of human population and residential buildings (Saganeiti et al., 2018). Urban sprawl is characterized by low values of both variables, with values of 6 and 12 residential buildings per hectare and 20–150 inhabitants per hectare. Urban sprinkling, by contrast, has much lower densities with typical values of 0.1-0.8 residential buildings per hectare and 0.2–2 inhabitants per hectare. Sprinkling is a phe-nomenon that occurs in rural and semi-rural territories while sprawl is related with low density urban territories. The rural landscape is af-fected by sprinkling, a phenomenon which fragments the territory in many isolated urban patches, all of them aspiring to be adequately connected with the main public facilities and services. Both urban de-velopment patterns are examples of low-density urban diffusion con-trasting with compact urban development. Although compactness has not a widely accepted definition, several authors attempted to describe this urban pattern.Gordon and Richardson (1997)defined compactness as high-density or monocentric development whereas Ewing (1997) referred to a given concentration of employment and housing, as well as some mixture of land uses.Galster et al. (2001), described compactness as the degree to which development is clustered and minimises the amount of land urbanized in a given area. Regardless the approach, the different authors agree that compactness involves the concentration of urban development (Tsai, 2005).
The negative environmental impacts of sprinkling are probably of a larger magnitude than those derived from urban sprawl in terms of loss of fertile land, reduction of residual natural areas or exposure of per-manent structures toflood risks, among others, and is also associated with high energy costs and elevated expenses related to the supply of technical, economic and organizational utilities due to the distance among urbanized areas and the very low demographic density (Romano et al., 2017b). The Iberian, Mediterranean and the Balkan areas were identified as territories where sprinkling prevailed, whereas urban sprawl was characteristic of northern Europe and other continents (Romano et al., 2017b).
The discontinuous urban fabric is the most important and dynamic artificial land use class in Europe. In 2006, this class represented 70% of the total artificial surface of the European artificial land, with a 6% increase from 1990 to 2006 (CLC 1990, 2000, 2006). By contrast, the
continuous urban fabric class represented only 7% of the total artificial land-use and increased by 3% in the same period.
The discontinuous urban land cover class is particularly important in countries where low human population density and highly dispersed territories prevail, as is the case of Continental Portugal. In 2006, the discontinuous urban fabric occupied 69% of the total artificial land-use classes in Portugal, this class showing a 33% increase during the period 1990–2006, largely exceeding that measured for the European territory (3%). By contrast, the contribution of the continuous urban fabric to the total artificial land in 2006 was low (4%) in Portugal, increasing by 17% from 1990 to 2006 (CLC 1990, 2000, 2006).
The low-density, highly dispersed population settlement pattern characteristic of a significant fraction of Portugal constitutes a suitable “territorial laboratory” where the temporal evolution of land cover and the analysis of the spatial patterns associated to the artificialization process could be monitored and the magnitude of environmental im-pacts related to these changes could be assessed.
Several attempts to develop land-cover based urban diffusion in-dicators have been undertaken. They are typically based on the mag-nitude and intensity of the use of urban areas and explored the effect on territorial sustainability of the magnitude and spatial patterns of the artificialization process, including urban sprawl. Thus, for example, Ewing (1997)defined a sprawl indicator designed exclusively for urban territories based on the accessibility to residential and out-of-home activities as well as the lack of functional open space. Later,Ewing et al. (2002)published a multivariate indicator also focused on urban terri-tories, based on four components: density of residential buildings, mixed-uses factors (percentage of population near working areas, shopping centers and education centers), percentage of population near the center or sub-center of each settlement and street network prop-erties. Torrens (2008) proposed a new indicator to measure urban sprawl based on urban growth, population density, diversity of eco-nomic activities, decentralization estimated from spatial autocorrela-tion metrics, fragmentaautocorrela-tion and compactness of the urban spatial structure and accessibility and Laidley (2016) designed an indicator following a different methodological approach based on carbon emis-sions, hazardous pollution, housing value and affordability. In a recent study, Jaeger and Schwick (2014)published a Weighted Urban Pro-liferation (WUP) method that considers the level of artificialization, the number of built-up patches and the amount of artificialized area per capita.
These studies, and many others (e.g.Razin and Rosentraub, 2000; Hoffhine Wilson et al., 2003; Davis and Schaub, 2005; Tsai, 2005; Frenkel and Ashkenazi, 2008; Jaret et al., 2009) are representative examples of a large series of investigations, which yield metrics for the measurement of urban dispersion. However, these indicators are not suitable for semi-urban or rural territories, since they do not include the impact on sustainability generated by the discontinuous spatial dis-tribution of the artificialized built-up areas and have been barely ap-plied to Southern European territories (Pozoukidou and Ntriankos, 2017).
In addition, previous unpublished research carried out by our re-search group strongly suggest that assessment of the magnitude and associated impacts of the artificialization process using Corine Land Cover data is likely to be inadequate in low density and highly dis-persed countries, where the discontinuous urban land use class is pre-dominant. In this connection, several studies have already identified limitations in CLC datasets when used to study artificialization pro-cesses (Pageaud and Carré, 2009;Bousquet et al., 2013;Diaz-Pacheco and Gutiérrez, 2014;Lavalle et al., 2016). CLC was designed as a pan-European dataset with a classification structure and spatial resolution optimized tofit the wide range of European environmental regions and not to analyse urban land use changes or assessing changes at the na-tional territorial scale. The minimum cartographic unit (25 ha.) in CLC is typically higher than most of the discontinuous urban patches in these territories. In these cases, higher resolution land cover analytical
tools are required, such as the COS land use map for Portugal ( Direção-Geral do Território, 2018) with a 1:25,000 scale and a minimum car-tographic unit of 1 ha.
The objective of this study is to quantify the changes in the different land cover classes in Continental Portugal using medium spatial re-solution data, with the aim of deriving an urban dispersion indicator which incorporates the characteristic dynamics of the discontinuous urban artificial land cover class and relate this indicator with two of the main environmental impacts associated with the artificialization pro-cess: the loss of arable land and the decrease in the carbon sequestration capacity of the territory.
2. Material and methods
Land cover for the different classes used in this study were estimated from COS land cover maps produced by the Portuguese General Directorate for the Territory, namely COS 1990 and COS 2007 land cover maps at the 1:25,000 scale, with a minimal cartographic unit of 1 ha, based on ortophotomaps with four spectral bands (blue, green, red, and near infra-red). These datasets were photo-interpreted with an average interpretative accuracy of 95%. Land cover was divided into hierarchical levels, from level one containingfive primary types (arti-ficial areas, agricultural areas and agroforestry, forests and natural and semi-natural areas, wetlands and waterbodies) to levelfive containing up to 190 classes (Abrantes et al., 2016). In this study, the third level was used to adequately resolve the continuous and discontinuous urban area, industry, commercial and general facilities, road and railway areas, ports and airports areas, quarries, areas under construction, green urban cover and non-developable areas (rocks, rivers, etc.). Harmonization of the urban continuous fabric and discontinuous urban fabric classification was performed due to differences in the assignment of categories in COS 1990 and COS 2007. Specifically, a layer including these differences was used. On average, 35.75% of the area considered as discontinuous urban fabric in COS 1990 changed to continuous urban fabric in COS 2007, whereas no actual changes were apparent according to the orthophoto maps. The COS 2007 was considered as the standard for the assignation of a given land cover class to any of these polygons. Agricultural and forest land classes were also selected for the analysis of agricultural land and carbon stock losses. These are the only available maps covering continental Portugal at the appropriate scale as to detect the artificialization process in areas where sprinkling is the prevailing urbanization pattern.
As shown inFig. 1, differences in artificialized land derived from COS and CLC were remarkable in rural and semirural areas, as well as in disperse urban regions, where sprinkling is apparent. Nevertheless, artificialized land in highly populated regions were satisfactorily de-scribed.
The total artificialized area estimated for continental Portugal from COS 2007-derived data (396,660 ha) is 48% higher than the results obtained from CLC 2006 (267,897 ha). We found that CLC generates more omission than commission errors for most of the classes, except in the case of the Urban Residential and Non-Urban classes. This is basi-cally because of its scale, since CLC includes small polygons in Urban Residential or Non-Urban areas that should be actually allocated to other classes (Diaz-Pacheco and Gutiérrez, 2014). A similar effect oc-curs in the Italian territory, also characterized by sprinkling, where Romano and Zullo (2013) described that the artificialized area esti-mated from regional land use maps is 60% higher than the results ob-tained from CLC. We therefore concluded that CLC-derived data are not suitable to analyse urban land cover changes in the Portuguese terri-tory.
An Urban Dispersion Indicator (UDI) adapted to the characteristic Portuguese urban land cover pattern was designed in this study. This indicator compiles three important dimensions of the process of human appropriation of the territory:
a) The level of artificialization (AA), i.e. the total artificialized area (excluded roadway and railway areas) in a given landscape (ex-cluding not developable areas) expressed in hectares.
b) A component that accounts for the typical discontinuous spatial distribution of the artificialized built-up areas (Discontinuous area; DA) in continental Portugal expressed in hectares.
c) A component related to the territorial fragmentation associated to a specific type of urban sprawl, sprinkling, represented by the number of built-up patches (P).
The three components included in the indicator are measured in different units and orders of magnitude. Therefore, normalization of these variables was undertaken. The minmax method was applied to the
z-scored standardized variables to offset the limitations of analytical underperformance inevitable in the z-score method and ensure the in-corporation of the variability present in the obtained results ( Fitz-Gibbbon and Morris, 1987). The application of the minmax method to the z-scored standardized variables was performed by subtracting the maximum and minimum values of the entire range of values for each variable for the two periods of reference, according to the following expression:
NXi = (SXi-Xmini) / (Xmaxi- Xmini) Where,
NXi represents the i z-score normalized variable
SXi represents the value of the i z-score normalized variable. Fig. 1. Difference between CLC and COS artificial categories designations (except railway and highway facilities) for a high population density (Porto; left panel) and a low population density urban area (Vila Nova de Famalicão; right panel).
Xmini is the minimum reference value. Xmaxi represents the maximum reference value.
The UDI combines the three variables AA, DA and P, each capturing a fraction of the artificialization process. The final SI for a given mu-nicipality i is defined as:
= + + + UDI AA AA DA AA P 1 6* 1 ( *( )) *(1 )
It is worth mentioning that UDI combines the weight for each component by multiplication and not by summation. Thus, to avoid a null value for UDI, should any of the variables turn out to be zero, a value of“1″ was added to every variable value. Since the final values of UDI are used only for comparative purposes, relative amounts are sig-nificant in the context of this study.
Finally, given that the maximum possible value of the UDI is 6, the introduction of a 1/6 coefficient was used to normalize the calculated values, keeping UDI values between 0 and 1. Therefore, an UDI value close to 1 indicates that the municipality has the maximum level of dispersion, whereas an UDI value close to 0 indicates the maximum level of compactness.
We calculated the UDI values for the 278 municipalities of con-tinental Portugal. Eight municipalities were excluded from the 1990 data set (Beja, Mafra, Moura, Odivelas, Serpa, Sintra, Trofa and Vizela) due to deficiencies in data compilation.
To infer the impacts associated to the land artificialization process, we calculated the loss of productive land caused by artificialization and the associated effect on its capacity to act as a carbon sink by comparing the artificialized area derived from COS 1990 and COS 2007 data after being processed with ArcGIS® 10.5 software. We calculated the loss of productive soil by estimating the amount of territory catalogued as agricultural soil in COS 1990 that was transformed into artificialized area in 2007.
We then estimated the loss of carbon sink capability by calculating the amount of forest area transformed into artificial area in the 1990–2007 period. Subsequently, we used the emissions factors pro-posed by the LANDYN project as the most reliable for the Portuguese territory (DGT, 2014). We restricted the analysis to the reduction of carbon sink associated with the loss of forest area, obviating carbon sinks from a different origin. Forest categories were divided into three subcategories, broad-leaved forest except eucalyptus (B, T, Z, N, Q and F COS 90 categories), eucalyptus forest (E COS 90 category) and con-iferous forest (P, M and R COS 90 categories). Then, four values were taken as coefficients for each subcategory, to calculate the carbon sink corresponding to above-ground biomass, below-ground biomass, litter and soil organic matter (Melo, 2014).
3. Results
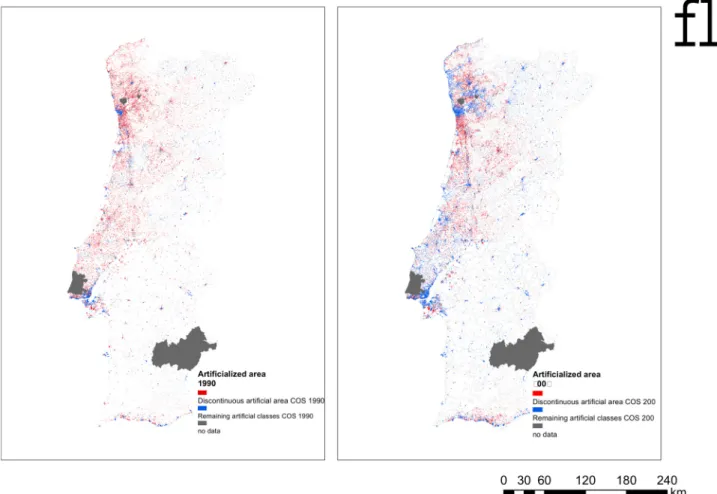
Fig. 2shows the spatial distribution of the total artificialized area and the discontinuous urban area in continental Portugal for 1990 and 2007. The comparative analysis of the two maps reflects the increase in both land cover classes showing that the total artificialized area creased annually by 3.4%, on average, representing a remarkable in-crease (57.9%) during the study period (Table 1). The artificialized discontinuous area was the land cover class showing the highest in-crease, with an average of 10.3% annual growth rate in the 1990–2007 period, i.e. a 174.3% throughout the period (Table 1).
The spatial distribution of the total artificialized and discontinuous artificialized areas as well as the number of patches by municipalities in 1990 and 2007 and the difference during that period is shown inFig. 3. The intensity of the artificialization process clearly differed among the Portuguese regions. This characteristic land transformation process was mainly produced in the coastal regions of Algarve, Lisboa, Porto and Braga, with its relevance declining progressively towards the inner re-gions. On average, the number of patches increased by 1.5% annually throughout the 1990–2007 period (Table 1). This variable showed
higher increases in the Centro region, Lisboa metropolitan area and Algarvian coast. In contrast, a reduction in the number of patches was observed in the Porto metropolitan area. Thus, the northwest region, the Lisbon metropolitan area and the Algarvian coastal area showed an intense artificialization process, giving rise to the anthropogenic transformation of 1.64% of the continental Portuguese in the 17 years studied.
The averaged values of the Urban Dispersion Indicator (UDI) for the municipalities of continental Portugal showed a 14.16% increase during the study period, from 0.21 ( ± 0.05) in 1990 to 0.24 ( ± 0.07) in 2007. The minimum values remained almost constant around 0.17, whereas maximum values were higher in 2007, showing a 30.4% higher standard deviation, indicating a higher spatial variability in terms of territorial dispersion.
The UDI reached higher values in coastal than in interior munici-palities, particularly in northern and central Portugal (Fig. 4). A general increase in dispersion was found in most of the Portuguese munici-palities from 1990 to 2007. The areas showing the largest increase in this indicator were the Braga metropolitan area, the municipalities surrounding Lisboa, the Leiria region and the Algarvian coastal zone. The capital towns in the inner regions also yielded high values. By contrast, the UDI remained unaltered in the rural areas corresponding to the inner regions.
An average of 7659 ha was converted annually from agricultural into artificial areas during the study period. The average loss of pro-ductive area due to the artificialization process is highly variable among municipalities (Table 2).Fig. 5shows the spatial distribution of the loss of productive capacity of the Portuguese territory resulting from the artificialization process. High rates of productive soil con-sumption were found in the northwest area, the nearby Porto and Braga hinterland together with the Lisboa metropolitan area. Low consump-tion rates were observed in all interior municipalities and in the Alen-tejo region.
On average, 2647 ha of forest were lost annually from 1990 to 2007 because of the artificialization process. Fig. 6shows the spatial dis-tribution of the relative loss of forest area in continental Portugal. The highest losses were observed in the highly populated municipalities located relatively close to the coast, such as Braga, Porto, Lisboa and Algarve. As in the case of the loss of productive area, an increasing trend was observed from interior to coastal municipalities, except in the Alentejo region.Table 3shows large differences in the loss of forest area results between municipalities.
The loss of carbon stocks resulting from changes in the transfor-mation of forests into artificial areas in Portugal is shown inTable 4. A marked gradient from coastal to inner regions was observed (Fig. 7), with higher losses of carbon stocks concentrated in municipalities south of Porto, in the municipalities surrounding Braga, in the Leiria region and also in the municipalities of Loulé and Viseu. By contrast, sig-nificant losses of carbon stocks were not observed in rural munici-palities of the inner regions.
4. Discussion
The results derived from the Urban Dispersion Indicator (UDI) cal-culated in this study show that the level of urban dispersion of con-tinental Portugal increased by 14.2% in the 1990–2007 period, with notable differences being observed between regions and also along the urban to rural and coastal to hinterland gradients.
The rate of increase in the artificialized area in Continental Portugal throughout the two decades prior to the crisis of the real estate sector caused by the collapse of subprime mortgages was 3.41% year−1. This rate was similar to that reported for France in the same period, 3.14% year−1, (SCEES, 2005), but well above other European countries such as Italy (1.68% year−1) (Corona et al., 2012), the Netherlands (1.31% year−1) (Hazeu, 2006), Slovakia (0.65% year−1) (EnviroPortal, 2016) and Germany (1.18% year−1) (Federal Statistical Office, 2015). By
contrast, the estimated rate was significantly lower than the values reported for the neighbour country of Spain, where the increase of ar-tificial area was estimated as 6.24% year−1
in the same period (OSE, 2014), almost doubling that of Portugal. These values were obtained with national land use cover maps methods comparable with COS da-taset.
The analysis of the results derived from changes in land cover and the values of the UDI obtained in this study clearly showed that the artificialization process was geographically heterogeneous and that this process followed different evolution patterns in the continental Portuguese territory. Three different artificialization patterns were observed: Diffusion in the form of sprawl, diffusion in the form of sprinkling and coalescence. In principle, diffusion and coalescence processes generally take place following a temporal sequence; there-fore, they can be interpreted as indicators of the state of evolution of the artificialization process in a given territory (Herold et al., 2006). The-oretically, both patterns of diffuse urban growth (sprawl and sprink-ling) might potentially derive into a coalescence phase. Furthermore, territories characterized by sprinkling diffusion patterns may evolve
towards sprawl provided they suffer a coalescence process resulting in a new urban structure more prone to develop in the form of sprawl.
The Algarve region registered an intense artificialization process during the 1990–2007 period. Until 1990, land consumption was moderate (Fig. 3a). From that date onwards, intensive growth of tour-istic activities, as reflected by the 41.6% increase in the number of hotels during the 1990–2007 period (INE, 2011;MAOTDR, 2004), was the driving force of the artificialization showed inFig. 3b. The increase in both the extension of artificialized area and the number of patches in the Algarve region, were above the average compared with the rest of the continental Portuguese territory (Fig. 3c). These two combined processes resulted in an artificialization pattern previously defined as sprawl, characterized by the increase of the urbanized area and the number of patches which reflects the establishment of peripheral de-velopment centers around the original core, followed by the allocation of a large number of new urban areas in the nascent urban system comprising the original core and peripheral development centers (Herold et al., 2006).
In the Norte and Centro regions, the spatial distribution and tem-poral evolution of the UDI was coherent with the historical evolution of land cover changes in the territory. The characteristic orography and hydrography, as well as the demographic pressure and the legal me-chanisms of inter-generational land transmission in the rural areas conducted to the development of agricultural and forestry exploitations based on smallholding (Coelho, 2003). The extension of the municipal discontinuous area and the number of patches at the Norte and Centro municipalities in 1990 were above the mean of the whole continental territory (Fig. 3a). The characteristic urbanization pattern intensified during the 1990–2007 period (Fig. 3c) leads to the process of sprinkling (Fig. 8).
Fig. 2. Spatial distribution of discontinuous artificial class and the rest of artificial land cover classes in continental Portugal in 1990 (left panel) and 2007 (right panel).
Table 1
Artificialized area (AA), discontinuous artificialized area (DA) and number of patches (P) in 1990 and 2007. The percentage of artificialized and dis-continuous artificialized areas with respect to the total surface of continental Portugal is also shown.
1990 2007 Difference (%)
AA (ha) 239852 (2,9%) 378077 (4,5%) 57,9% DA (ha) 49386 (0,6%) 135452 (1.6%) 174,3%
P 40099 49390 23,2%
The spatial expansion of the Porto metropolitan area occurring in the last decades of the XX century was a diffuse and fragmented pro-cess, which integrated surrounding municipalities with urban-industrial characteristics to the Porto urban area. These municipalities experi-mented a suburbanization process from the middle of the last century, which derived into a densification process in the 1990–2007 period due tofilling of unbuilt land induced by the development of the road net-work and of main transport infrastructures (Silva and Clarke, 2002), as showed in the different metrics involved in the UDI defined in this study (Fig. 3c). This type of temporal evolution in the urbanization process has been defined as coalescence, a pattern characterized by the
artificialization of the area between patches, thereby producing the decrease in the number of patches (Herold et al., 2006).
Regions showing a moderate transformation of natural and semi-natural land into artificial land were also observed. In the interior of the Norte and Centro regions, significant changes occurred just in district headquarters of towns that provide territorial balance. In the Alentejo region, stagnation in the increase of artificial land cover responds to different reasons. The inner Alentejo area was historically characterized by a concentrated distribution of urban settlements, mostly due to the existence of extensive agriculture. In the case of the coastal Alentejo area, severe restrictions on urbanization due to a strong conservation Fig. 3. Spatial distribution of the relative contribution of 1) total artificial area, 2) discontinuous urban area and 3) number of patches in a) 1990, b) 2007 and c) the difference between 1990 and 2007 by municipality.
policy, and the consequent establishment of large extension of pro-tected area, explains the low artificialization rate characteristic of this region.
In this investigation, we propose a new Urban Dispersion Indicator designed to identify the main patterns of artificialization described in the territory. This UDI includes the absolute magnitude of land artifi-cialization but also involves the discontinuous pattern of land trans-formation and the number of patches. The analysis of the temporal evolution of this indicator will allow monitoring the impact of the different policies operating on the territory.
Several studies about urban sprawl and the urbanization process in Europe addressed the temporal evolution of built-up areas in cities or urban regions. Variables such as total artificial area, land uptake per person or job, population density, mean patch size or metrics indicating territorial fragmentation, among others, have been frequently used in previously published indicators (e.g. Frenkel and Ashkenazi, 2008; Jaeger and Schwick, 2014). These, however, are not always suitable for their application to territories characterized by an intense sprinkling artificialization pattern, as is the case of continental Portugal. The main advantage of the UDI proposed in this investigation is that it captures
the characteristic disperse and split urban land use of continental Por-tugal, allowing a quantitative and objective territorial analysis, dis-carding subjective or ambiguous components that usually introduce more unknowns than certainties. The indicator we propose does not consider social data such as human population size, family income, etc., due to the difficulties inherent to the adequate interpretation of the results. For example, a decrease in population density could occur in a process of intensification of urban sprawl, with elevated amounts of land transformation or, alternatively, describe a depopulation process, without any land consumption associated.
The UDI can be used to explore the patterns of artificialization at any level, municipal, regional or national. The results supplied by this indicator for the continental Portugal municipalities demonstrated to be easily interpretable and sensitive to land use changes and, in particular, to urban growth in dispersed territories. The combination of artificial area, discontinuous area and number of patches results in an appro-priate quantitative representation of regions with high urbanization activity (Norte, Algarve) as well as stagnated areas (inner regions) or mature urban areas (Porto and Lisboa metropolitan areas), which is in accordance with qualitative expert opinion and literature (Coelho, Fig. 4. Spatial distribution of the UDI for a) 1990, b) 2007 and c) the difference between 1990 and 2007 by municipality.
Table 2
Average, standard deviation and minimum and maximum values of the productive area by municipality in 1990 and 2007 and the loss of productive area in that period due to artificialization processes in the different municipalities of continental Portugal.
Productive area 1990 (ha) Productive area 2007 (ha) Changes from productive area to artificial 1990-2007 (ha)
Maximum value 67701 101843 2764
Minimum value 130 105 19
Mean 9982 12557 441
Standard deviation 10343 16366 436
2003;Silva and Clarke, 2002).
The high rate of land uptake experienced by the Portuguese territory is associated to several environmental impacts. In this study, a sig-nificant loss of productive soil due to urbanization was found (4.08% of productive soil was transformed to artificial area in the 1990–2007 period), showing a coastal-inland trend, with a greater amount of agriculture land being transformed into urban area with the proximity to the littoral municipalities (Fig. 5). The loss of productive soil prob-ably results in increases in the amount of imported food, enhance in-tensive agriculture production and puts at risk food sovereignty. Our results also show a significant loss of carbon stocks (80,418 MgC/year). A sharp decline of this stock between 1990 and 2007 was observed. The spatial distribution of this variable was similar to that reported for the loss of productive land, although in this case rural municipalities are more exposed to this phenomenon.Muñoz-Rojas et al. (2011)studied variations in the carbon storage capability in Andalusia, a Spanish re-gion with similar characteristics to continental Portugal in terms of inhabitants and extension, showing that the annual loss of carbon sinks for the period 1990–2007 was considerably lower in Andalusia than in continental Portugal.
The urbanization dynamics occurring in Portugal over the last decades launched a national debate on the strategies to better tackle the impacts of excessive urban expansion and diffusion. First, a major re-form of the Portuguese spatial planning system was undertaken in 2014/15, with the new Law of Public Policy on Soil, Land-use Planning and Urban Planning (LBPPSOTU, 2014) which established the
framework legislation for the planning system, and the subsequent re-vision of the regulatory regime of territorial management tools (RJIGT, 2015). These changes aimed at strengthening the strategic dimension of the planning process, creating a clearer division between programs at the national and regional level with a primarily strategic component Fig. 5. Spatial distribution of the relative loss of productive area for the period
1990–2007.
Fig. 6. Spatial distribution of the relative loss of forest area for the period 1990–2007.
Table 3
Average, standard deviation minimum and maximum values of the loss of forest area due to artificialization for continental Portugal municipalitiesfrom 1990–2007.
Changes from forest area to artificial 1990-2007 (ha) Maximum value 1348
Minimum value 0.6
Mean 202
Standard deviation 162
Table 4
Average, standard deviation, minimum and maximum values of carbon sink in continental Portugal municipalities from 1990 to 2007.
Changes of carbon sink 1990-2007 (MgC)
Maximum value 43658.97 Minimum value 12.36
Mean 6368.60
and plans at the local level regulating specific land uses. They aimed at reinforcing patterns of urban containment with the aim of refraining urban sprawl and new greenfield developments, which are now con-ditioned to the demonstration of the economic andfinancial viability of investments, either public or private. Prior to the entrance into force of this law, delimitation of urban areas in the plans was not subjected to the assessment of their future need. The obligation to demonstrate both thefinancial viability of the infrastructure required for the new urban developments and the need to ensure maximum distance thresholds for urban functions could restrict urban dispersal processes and encourage urban concentration and densification. This modified law could po-tentially curb the historical oversizing of urban land addressed by Municipal Land Use Plans (PDM), which resulted in perverse con-sequences facing real estate speculation that stem from the classifica-tion of urban land by a simple administrative act (Cavaco, 2016), thereby promoting the reconversion of the land category suitable for development into rural land, particularly in regions with low intensity of the urbanization process as is the case of the inner regions of con-tinental Portugal. On the other hand, it should be noticed that a sig-nificant amount of the sprinkling results from the permissive municipal development laws for ‘rural’ land (e.g. agricultural and agroforestry areas) in several PDM. Unfortunately, the dynamics of the real estate market, the influence of the civil construction lobbying, and also the absence of a supervisory body responsible for the monitoring and as-sessment of master plans, building permits and unauthorized con-structions have highly constrained this planning system (Abrantes et al.,
2016).
Municipal spatial plans are generally based on territorial diagnosis and analysis of trends of the territorial dynamics, but there is a lack of monitoring capacity at the local level where several municipal autho-rities have an insufficient number of planners with little experience in comprehensive monitoring work. Regional authorities could play a decisive role in ensuring administrative coordination and supra-muni-cipal cooperation, establishing common forecasting and implementing the evaluation and monitoring procedures and indicators for municipal plans. This could be achieved by developing fully operational and technically robust regional territorial observatories, that in addition to identifying and gathering geographical and statistical information available to support the periodic municipal reports, should focus on the identification and monitoring of territorially adjusted indicators to as-sess spatial impacts of municipal plans accompanied by binding re-sponsibility or commitment consequences, and on the development of prospective studies and regular evaluation procedures.
Although municipal plans are the main land use regulatory instru-ments, the referred regional territorial observatories should develop strategic guidelines for municipal plans to address urban containment, and implement systems for the regular monitoring and evaluation of the urbanization process on each municipality, generating indicators using simple methods and detailed systematically acquired data at the na-tional scale, like the COS-derived data set used in the indicator pro-posed in this study. The ability of the UDI to identify different urba-nization processes at the municipal level, would also allow regional authorities to develop regional land use planning guidelines with the necessaryflexibility and sensitivity as to accommodate the diversity of territorial patterns, targeting distinct sub-regions or groups of munici-palities with customized land use guidelines.
For instance, in municipalities characterized by an urban stagnation process (low increase of the total urban area and of the number of patches) like the inner regions of continental Portugal, priorities should be given to standardizing the criteria to classify new urban land, in accordance to the new legal framework. A related example of public policy is the proposed Regional Plan of the Centre Region of Portugal (CCDR Centro, 2011), where the increase of urban area in the municipal plans is only allowed when the sum of the consolidated and the legally existing urban areas has reached 70% of the total urban classified area. By contrast, regions with high levels of sprinkling (high increase of the total urban area, with a high contribution of discontinuous areas and a high increase of the number of patches), the regional guidelines should be complemented with the definition of regulatory frameworks for di-minishing the permissive municipal development laws for‘rural’ land (e.g. agricultural and agroforestry areas) and the promotion of priority infill/densification areas.
In mature urban areas, with continuous urban growth and coales-cence where housing and land stock markets are more intense and ro-bust, regional guidelines should promote the strengthening of coales-cence through the definition of priority areas of urbanization and urban densification, benefiting for example of fiscal incentives for its im-plementation or through direct intervention of the public authorities in cases where there are insufficiencies and failures in the land market.
Besides all the suggested strategies to stop or dampen the process of urban land take and dispersion and its negative consequences, struc-tural policies at the land market level should be also developed, in particular on housing stocks and on the regulation of the private and public land market.
5. Conclusions
In conclusion, the land cover-based Urban Dispersion Indicator (UDI) proposed in this study, takes into consideration for thefirst time the discontinuous spatial distribution of the artificialized built-up areas and the territorial fragmentation associated to urban dispersion, is ex-peditious and reliable in identifying and quantifying the dynamics of Fig. 7. Spatial distribution of the relative loss of carbon sink for the period
1990–2007.
the artificialization process in countries characterized by low popula-tion density and highly dispersed territories, such as Portugal, and, to some degree, most of the Southern European countries. This indicator also qualifies the corresponding urbanization patterns and assesses their degree of dispersion in the light of the negative environmental impacts produced by the artificialization process, namely the loss of the most productive agricultural land or forest areas associated with terri-torial capacity of carbon sequestration. In this sense, the UDI can be a very useful tool to monitor and evaluate the impacts of different public policies with a direct impact on the land artificialization dynamics, as well as in the territorial and urban planning processes, whether at the national, regional or municipal level, allowing more detailed and con-sistent spatial analyses and diagnoses of territorial sustainability to be undertaken. Consequently, the urban dispersion indicator proposed in this study is expected to be useful for the formulation of norms and actions that may curb uncontrolled land artificialization and promote the best practices of integrated management and sustainable land use of the urbanization processes.
References
Abrantes, P., Fontes, I., Gomes, E., Rocha, J., 2016. Compliance of land cover changes with municipal land use planning: evidence from the Lisbon metropolitan region (1990-2007). Land Use Policy 51, 120–134.https://doi.org/10.1016/j.landusepol. 2015.10.023.
Angel, S., Sheppard, S.C., Civco, D.L., Buckley, R., Chabaeva, A., Gitlin, L., Kraley, A., Parent, J., Perlin, M., 2005. The Dynamics of Global Urban Expansion. Transport and Urban Development Department. The World Bank, Washington D.C September. Bousquet, A., Couderchet, L., Gassiat, A., Hautdidier, B., 2013. Les résolutions des bases
de données «occupation du sol» et la mesure du changement: Articuler l’espace, le temps et le thème. L’Espace géographique 42 (1), 61–76.https://doi.org/10.3917/eg. 421.0061.
Burchell, R.W., Galley, C., 2003. Projecting incidence and costs of sprawl in the United States. Transp. Res. Rec. 1831, 150–157.https://doi.org/10.3141/1831-17.
Caetano, M., Nunes, V., Nunes, A., 2009. CORINE Land Cover 2006 for Continental Portugal, Relatório Técnico. Instituto Geográfico Português.
Catalán, B., Saurí, D., Serra, P., 2008. Urban sprawl in the Mediterranean? Patterns of growth and change in the Barcelona Metropolitan Region 1993–2000. Landsc. Urban Plan. 85 (3-4), 174–184.https://doi.org/10.1016/j.landurbplan.2007.11.004. Cavaco, C., 2016. Habitat III, National Report Portugal (Coord.). Direção Geral do
Território (Retrieved from)ISBN: 978-989-8785-08-4. http://habitat3.org/wp-content/uploads/PT_UN-HabitatIII_NationalReport_2016_08_04_EN.pdf.
CCDR Centro, 2011. Plano regional do ordenamento do território do Centro. Comissão de Coordenação da Região Centro (CCDR Centro), Coimbra (Accessed September 2018).
http://www.ccdrc.pt/index.php?option=com_docman&view=download&id=1846 &Itemid=739.
Churkina, G., 2016. The role of urbanization in the global carbon cycle. Front. Ecol. Evol. 11.https://doi.org/10.3389/fevo.2015.00144.
Coelho, I.S., 2003. Propriedade da Terra e Política Florestal em Portugal. Silva Lusit. 11 (2), 185–199.
Corona, P., Barbati, A., Tomao, A., Bertani, R., Valentini, R., Marchetti, M., Fattorini, L., Perugini, L., 2012. Land use inventory as framework for environmental accounting: an application in Italy. iForest Biogeosci. For. 5 (4), 204–209.https://doi.org/10. 3832/ifor0625-005.
Council of the European Union, 2010. Council Conclusions on Biodiversity Post. EU and Global Vision and Targets and International Access and Burden Sharing Regime -3002nd Environment Council Meeting Brussels, 15 March 2010.
Crutzen, P.J., Stoermer, E.F., 2000. The“Anthropocene”. Global Change Newslett. 41, 17–18.
Davis, C., Schaub, T., 2005. A transboundary study of urban sprawl in the Pacific Coast region of North America: the benefits of multiple measurement methods. Int. J. Appl. Earth Obs. Geoinf. 7, 268–283.https://doi.org/10.1016/j.jag.2005.06.007.
DGT, 2014. Uso E Ocupação Do Solo Em Portugal Continental. Avaliação E Cenários Futuros. Projeto LANDYN. Lisboa: Direção-geral Do Território (DGT). ISBN: 978-989-98477-9-8..
Diaz-Pacheco, J., Gutiérrez, J., 2014. Exploring the limitations of CORINE Land Cover for monitoring urban land-use dynamics in metropolitan areas. J. Land Use Sci. 9, 243–259.https://doi.org/10.1080/1747423X.2012.761736.
Direção-Geral do Território, 2018. Especificações técnicas da Carta de uso e ocupação do solo de Portugal Continental para 1995, 2007, 2010 e 2015. Relatório Técnico. Direção-Geral do Território.
EEA, 2000. CORINE Land Cover Project. European Environmental Agency (EEA), Copenhagen, Denmark.
EEA, 2006. The Changing Faces of Europe’s Coastal Areas. EEA Report Nº6/2006. European Environment Agency (EEA), Copenhagen, Denmark ISBN: 9291678422. EEA, 2010. The European Environment: State and Outlook 2010– Land Use. European
Environment Agency (EEA)https://doi.org/10.2800/45773.
EEA, 2017. Land Take. Indicator assesment. Data and Maps. Available at:. European Environment Agency (EEA) (Accessed March 2019). https://www.eea.europa.eu/ data-and-maps/indicators/land-take-2/assessment-1.
EnviroPortal, 2016. Ministerstvoživotného prostredia Slovak Republic. Available at:. (Accessed October 2017). http://www.enviroportal.sk/indicator/detail?id=161.
Ermer, K., Mohrmann, R., Sukopp, H., 1994. Stadt und Umwelt. In: Buchwald, K., Engelhardt, W. (Eds.), Band 12 des Handbuches“Umweltschutz – Grundlagenund Praxis’’. Economica Verlag, Bonn, pp. 125.
Ewing, R., 1997. Is Los Angeles-style sprawl desirable? J. Am. Plan. Assoc. 63 (1), 107–126.https://doi.org/10.1080/01944369708975728.
Ewing, R., Pendall, R., Chen, D., 2002. Measuring Sprawl and Its Impacts. Smart Growth America, Washington, DC, pp. 31.https://smartgrowthamerica.org/app/legacy/ documents/MeasuringSprawlTechnical.pdf.
Federal Statistical Office, 2015. Bodenfläche nach Art der tatsächlichen Nutzung 2014. Fachserie 3, Reihe 5.1. Available at:. (Accessed September 2017). https://www. destatis.de/DE/Publikationen/Thematisch/LandForstwirtschaft/Flaechennutzung/ Bodenflaechennutzung.html.
Fitz-Gibbbon, C.T., Morris, L.L., 1987. How to Analyze Data. SAGE Publications Inc. ISBN: 0-8039-3133-6.
Foley, J.A., Ramankutty, N., Brauman, K.A., Cassidy, E.S., Gerber, J.S., Johnston, M., Mueller, N.D., O’Connell, C., Ray, D.K., West, P.C., Balzer, C., Bennett, E.M., Carpenter, S.R., Hill, J., Monfreda, C., Polasky, S., Rockström, J., Sheehan, J., Siebert, S., Tilman, D., Zaks, D.P.M., 2011. Solutions for a cultivated planet. Nature 478, 337–342.https://doi.org/10.1038/nature10452.
Frenkel, A., Ashkenazi, M., 2008. Measuring urban sprawl: How can we deal with it? Environ. Plann. B Plann. Des. 35 (1), 56–79.https://doi.org/10.1068/b32155. Galster, G., Hanson, R., Ratcliffe, M.R., Wolman, H., Coleman, S., Freihage, J., 2001.
Wrestling sprawl to the ground: defining and measuring an elusive concept. Hous. Policy Debate 12 (4), 681–717.https://doi.org/10.1080/10511482.2001.9521426. Gordon, P., Richardson, H.W., 1997. Are compact cities a desirable planning goal? J. Am.
Plan. Assoc. 63 (1), 95–106.https://doi.org/10.1080/01944369708975727.
Hazeu, G.W., 2006. Land use mapping and monitoring in the Netherlands (LGN5). 2nd EARSeL SIG Workshop on Remote Sensing of the Land Use and Land Cover: Application and Development.
Herold, M., Hemphill, J., Clarke, K., 2006. Remote sensing and urban growth theory. In: Qihao, W., Dale, Q. (Eds.), Urban Remote Sensing. 201–219. CRC Press.https://doi. org/10.1201/b15917-14.
Hoffhine Wilson, E., Hurd, J.D., Civco, D.L., Prisloe, M.P., Arnold, C., 2003. Development of a geospatial model to quantify, describe and map urban growth. Remote Sens. Environ. 86 (3), 275–285.https://doi.org/10.1016/S0034-4257(03)00074-9. INE, 2011. Instituto Nacional de Estatística (INE), Portugal. Estabelecimentos hoteleiros
(Série 2002-2008 - N.º) por Localização geográfica (NUTS- 2002) e Tipo (estabelec-imento hoteleiro); Annual. Available at:. (Accessed September 2017). https:// www.ine.pt/xportal/xmain?xpid=INE&xpgid=ine_indicadores&indOcorrCod= 0000392&contexto=bd&selTab=tab2.
Jaeger, J.A.G., Schwick, C., 2014. Improving the measurement of urban sprawl: weighted Urban Proliferation (WUP) and its application to Switzerland. Ecol. Indic. 38, 294–308.https://doi.org/10.1016/j.ecolind.2013.11.022.
Jaeger, J.A.G., Bertiller, R., Schwick, C., Cavens, D., Kienast, F., 2010. Urban permeation of landscapes and sprawl per capita: new measures of urban sprawl. Ecol. Indic. 10 (2), 427–441.https://doi.org/10.1016/j.ecolind.2009.07.010.
Jaret, C., Ghadge, R., Reid, L.W., Adelman, R.M., 2009. The measurement of suburban sprawl: an evaluation. City Commun. 8 (1), 65–84. https://doi.org/10.1111/j.1540-6040.2009.01270.x.
Laidley, T., 2016. Measuring sprawl: a new index, recent trends, and future research. Urban Aff. Rev. 52 (1), 66–97.https://doi.org/10.1177/1078087414568812. Lavalle, C., Batista e Silva, F., Baranzelli, C., Jacobs-Crisioni, C., Vandecasteele, I.,
Barbosa, A., Maes, J., Zulian, G., Perpiña Castillo, C., Barranco, R., Vallecillo, S., 2016. Land Use and Scenario Modeling for Integrated Sustainability Assessment. In European Landscape Dynamics: CORINE Land Cover Data, 237-262.https://doi.org/ 10.1201/9781315372860-25.
LBPPSOTU, 2014. Lei n.º 31/2014 de 30 de maio Lei de bases gerais da política pública de solos, de ordenamento do território e de urbanismo Diário da República n.º 104/ 2014, Série I de 2014-05-30. http://data.dre.pt/eli/lei/31/2014/05/30/p/dre/pt/ html.
MAOTDR, 2004. PROT Algarve. Volume II: Caraterização e Diagnóstico. Anexo F2– Turismo– Caraterização do Alojamento Hoteleiro. Available at:. pp. p.77. (Accessed September 2017). http://www.prot.ccdr-alg.pt/Storage/pdfs/Volume_II_ANEXO_F2. pdf.
Melo, J., 2014. Final Report: CO2 emissions and removals from the LULUCF sector. Direção-Geral do Território, Lisboa. Available at. (Accessed August 2017). http:// www.dgterritorio.pt/ficheiros/dgt/download_12.
Muñoz-Rojas, M., De la Rosa, D., Zavala, L.M., Jordán, A., Anaya-Romero, M., 2011.
Changes in land cover and vegetation carbon stocks in Andalusia, Southern Spain (1956-2007). Sci. Total Environ. 409 (14), 2796–2806.https://doi.org/10.1016/j. scitotenv.2011.04.009.
OSE, 2014. Sostenibilidad en España 2014 Observatorio de la Sosteniblidad en España (OSE). 2015, available at. pp. 92. (Accessed August 2017). http://www. observatoriosostenibilidad.com/sostenibilidad-en-espana-2014/.
Pageaud, D., Carré, C., 2009. La France vue par CORINE Land Cover, outil européen de suivi de l’occupation des sols. Observation et statistiques, no. 10, avril. La Défense: Commissariat général au développement durable, service de l’observation et des statistiques. Available at:. pp. 4 p. (Accessed August 2017). http://www. statistiques.developpement-durable.gouv.fr/fileadmin/documents/Produits_ editoriaux/Publications/Le_Point_Sur/2009/PointSur10_01.pdf.
Pozoukidou, G., Ntriankos, I., 2017. Measuring and assessing urban sprawl: a proposed indicator system for the city of Thessaloniki, Greece. Remote Sens. Appl. Soc. Environ. 8, 30–40.https://doi.org/10.1016/j.rsase.2017.07.005.
Razin, E., Rosentraub, M., 2000. Are fragmentation and sprawl interlinked? North American evidence. Urban Aff. Rev. 35 (6), 821–836.https://doi.org/10.1177/ 10780870022184697.
RJIGT, 2015. Regime Jurídico dos Instrumentos de Gestão Territorial, aprovado pelo Decreto-Lei n.º 380/99, de 22 de setembro Diário da República n.º 93/2015, Série I de 2015-05-14. http://data.dre.pt/eli/dec-lei/80/2015/05/14/p/dre/pt/html. Romano, B., Zullo, F., Fiorini, L., Ciabò, S., Marucci, A., 2017a. Sprinkling: an approach to
describe urbanization dynamics in Italy. Sustainability 9 (1), 97.https://doi.org/10. 3390/su9010097.
Romano, B., Zullo, F., Fiorini, L., Marucci, A., Ciabò, S., 2017b. Land transformation of Italy due to half a century of urbanization. Land Use Policy 67, 387–400.https://doi. org/10.1016/j.landusepol.2017.06.006.
Romano, B., Zullo, F., 2013. Models of urban land use in Europe: assessment tools and criticalities. Int. J. Agric. Environ. Inf. Syst. 4 (3), 80–97.https://doi.org/10.4018/ ijaeis.2013070105.
Romano, B., Zullo, F., 2014. The urban transformation of Italy’s Adriatic coastal strip: fifty years of unsustainability. Land Use Policy 38, 26–36.https://doi.org/10.1016/j. landusepol.2013.10.001.
Romano, B., Zullo, F., 2016. Half a century of urbanization in southern European low-lands: a study on the Po Valley (Northern Italy). Urban Res. Pract. 9 (2), 109–130.
https://doi.org/10.1080/17535069.2015.1077885.
Saganeiti, L., Favale, A., Pilogallo, A., Scorza, F., Murgante, B., 2018. Assessing urban fragmentation at regional scale using sprinkling indexes. Sustainability 10 (9), 3274.
https://doi.org/10.3390/su10093274.
SCEES, 2005. L’utilisation du territoire en 2004, nouvelle série 1992 à 2004. Agreste Chiffres et données Agric. 169, 65.
Schneider, A., Friedl, M.A., Potere, D., 2009. A new map of global urban extent from MODIS satellite data. Environ. Res. Lett. 4 (4), 44003.https://doi.org/10.1088/ 1748-9326/4/4/044003.
Seto, K.C., Guneralp, B., Hutyra, L.R., 2012. Global forecasts of urban expansion to 2030 and direct impacts on biodiversity and carbon pools. Proc. Natl. Acad. Sci. 109 (40), 16083–16088.https://doi.org/10.1073/pnas.1211658109.
Silva, E., Clarke, K., 2002. Calibration of the SLEUTH urban growth model for Lisbon and Porto, Portugal. Comput. Environ. Urban Syst. 26 (6), 525–552.https://doi.org/10. 1016/S0198-9715(01)00014-X.
Torrens, P.M., 2008. A toolkit for measuring sprawl. Appl. Spat. Anal. Policy 1 (1), 5–36.
https://doi.org/10.1007/s12061-008-9000-x.
Tsai, Y.H., 2005. Quantifying urban form: compactness versus“Sprawl.”. Urban Stud. 42 (1), 141–161.https://doi.org/10.1080/0042098042000309748.
Vince, G., 2011. An epoch debate. Science 334 (6052), 32–37.https://doi.org/10.1126/ science.334.6052.32.
Vitousek, P.M., Mooney, H.A., Lubchenco, J., Melillo, J.M., 1997. Human domination of Earth’s ecosystems. Science 277 (5325), 494–499.https://doi.org/10.1126/science. 277.5325.494.