ISSN = 1980-993X – doi:10.4136/1980-993X www.ambi-agua.net
E-mail: [email protected] Tel.: (12) 3631-8004
–
Linking geomorphologic knowledge, RS and GIS techniques for
analyzing land cover and land use change: a multitemporal study in
the Cointzio watershed, Mexico
doi: 10.4136/ambi-agua.956
Erna López-Granados1; Manuel E. Mendoza2*; Daniel I. González2, 3 1Universidad Michoacana de San Nicolás de Hidalgo, Morelia, Michoacán, México
Instituto de Investigaciones Metalúrgica, Departamento de Geología y Mineralogía 2Universidad Nacional Autónoma de México - Morelia, Michoacán, México
Centro Investigaciones en Geografía Ambiental,
3Instituto Nacional de Ecología y Cambio Climático. México, D.F
*Autor correspondente: e-mail: [email protected], [email protected], [email protected]
ABSTRACT
It is well-established that changes in land cover and land use (LCLU) are relevant to current local and global changes that are directly linked with food security, human health, urbanization, biodiversity, trans-border migration, environmental refuges, water and soil quality, runoff and sedimentation rates, and other processes. This paper examines LCLU change processes within the Cointzio watershed (Central Mexico). The analysis covers a 28-year time period from 1975 to 2003. LCLU changes were deduced from multi-temporal remote sensing analyses (1975, 1986, 1996, 2000 and 2003). Nearly all of the LCLU changes experienced in the Cointzio watershed occurred during the 1986-1996 period. Half of the 665 km2 of the watershed have changed during this period, in what corresponds to a ten-fold increase in the rate of change as compared to the 1975-1986 and 1996-2003 periods. These massive changes are probably related to the Immigration Reform and Control Act (IRCA) of 1986, which limited the transit of undocumented Mexican workers to the United States of America. The methodology applied in this research constitutes a low-cost alternative for evaluating the impact of LCLU change in watersheds. The magnitude of land use change differed during the periods of analyses in the watershed, functional zones and geoforms. The methodological approach applied in this analysis integrates standard procedures to evaluate land cover and land use change in watersheds. Due to the practical value of the results, the data and information generated during the analysis have been made available to local authorities.
Keyword: watershed management, Physical Geography, land cover and use change, remote sensing,
GIS.
Conectando conhecimento geomorfológico, percepção remota e
técnicas de geoprocessamento para a análise de cobertura da terra e
mudanças no uso da terra: um estudo multitemporal na bacia
Cointzio, México
RESUMO
19
biodiversidade, a migração transfronteiriça, os refúgios ambientais, a qualidade da água e do solo, o escoamento e taxas de sedimentação, entre outros processos. Este trabalho objetivou analisar os processos de mudança de LCLU dentro da bacia hidrográfica Cointzio (México Central). A análise abrangeu o período de 28 anos entre 1975 e 2003. As mudanças de LCLU foram detectadas por análise multitemporal baseada em técnicas de sensoriamento remoto (1975, 1986, 1996, 2000 e 2003). 46% das mudanças da LCLU ocorreram na bacia hidrográfica Cointzio no período de 1986 a 1996, o que corresponde a um incremento de dez vezes na taxa de mudança em comparação com os períodos 1975-1986 e 1996-2003. Essas modificações massivas estão provavelmente relacionadas com a Reforma da Imigração e a Lei de Controle (IRCA) de 1986, que limitou o trânsito dos trabalhadores mexicanos sem documentos de autorização aos estados Unidos da América. A metodologia aplicada nessa investigação constitui uma alternativa de baixo custo para avaliação do impacto da mudança LCLU em bacias. A magnitude dos processos de mudança de uso da terra varia durante os períodos de análise na bacia hidrográfica, nas zonas funcionais hidrográficas e nas geoformas. O enfoque metodológico aplicado nessa análise integra os procedimentos que avaliam mudanças de cobertura e uso da terra em bacias. Devido à utilidade prática dos resultados, as informações geradas foram colocadas a disposição das autoridades locais com o propósito de apoiar tomadas de decisão.
Palavras-chave: manejo de bacia hidrográfica, Geografia Física, mudança na cobertura vegetal e uso
da terra percepção remota, SIG.
1. INTRODUCTION
Land cover (LC) and land use (LU) are key elements in describing the terrestrial environment in relation to nature and human activity. LC refers to objects located on the
planet’s surface of either natural origin (lakes, rivers, forests, glaciers, etc.) or created and
maintained by humans (cities, dams, roads, etc.) (Jansen and di Gregorio, 2002). LU refers to the type of human activities that produce goods and services for societies and that occur
on the Earth’s surface. Studies of LCLU have historically been separated; LC was traditionally of interest to the natural sciences and described the physical status of land, such as, for example, the quantity and quality of vegetation or water that covered the surface of the land (Meyer and Turner II, 1994). Social scientists and management planners have mostly studied LU, ultimately describing the influence of humans on the environment. LU change plays a highly relevant role in the present processes of local and global change and is directly linked to food security, human health, urbanization, biodiversity, trans-border migration, environmental refuges, water and soil quality, runoff and sedimentation rates, among other processes (Dunjó et al., 2003; Milesi et al., 2005; Heistermann et al., 2006; Kamusoko and Aniya, 2006; Çakir et al., 2008). During the recent decades, the study of LCLU change has become a prominent research topic (Mwavu and Witkowski, 2008; Salehiet al., 2008; Li et al., 2009); in particular after such changes were recognized as one of the most important factors of global change (Xiao et al., 2006). In general terms, it is estimated that between 30 and 50% of the Earth’s surface has been
transformed or degraded by human activity (Vitousek et al., 1997).
The urgent need to preserve both aquatic and terrestrial natural resources within the framework of sustainable growth require the development of a set of indicators that are both easy to assess and capable of describing the state of health of watersheds (He, 2000; Mendoza et al., 2002): Deforestation, biodiversity losses, soil pollution and soil erosion are key factors in planning that seeks to minimize the environmental impacts of human activity.
LÓPEZ-GRANADOS, E.; MENDOZA, M. E.; GONZÁLEZ, D. I. Linking geomorphologic knowledge, RS and GIS techniques for analyzing land cover and land use change: a multitemporal study in the Cointzio watershed, Mexico. Ambi-Agua, Taubaté, v. 8, n. 1, p. 18-37, 2013. (http://dx.doi.org/10.4136/ambi-agua.956)
processes and patterns during a given historical period, and how these prevail or change throughout time, recognizing the dynamics of rates of change. Overall, using information from social science and environmental sciences, such as remote sensing and hydroclimatology with environmental history or anthropology, is the most efficient way to study LCLU change. This allows the establishment of relationships between the spatiotemporal patterns and processes and socioeconomic variables such as immigration (Fuller et al., 2003; López et al., 2006). Spatiotemporal analysis of landscape dynamics is crucial in formulating an appropriate set of actions in landscape management (Çakir et al., 2008).
The outputs of the present analysis are expected to contribute to the management of the Cointzio watershed. Watershed management has become an increasingly important issue in many countries, including Mexico and other developing countries. Principles, concepts and approaches related to watershed management have made important advances in the past few years, but still lack a universal methodology for achieving effective watershed management (Naiman et al., 1997; Bhatta et al., 1999; Gautam et al., 2003). Although LCLU are well known key environmental and socioeconomic indicators, their evolution has not been properly integrated in decision-making processes. Rates of change differ throughout time, so that different relative importance should be applied to each period in decision-making processes regarding natural resource management at a watershed level, and an effort should be made to identify the drivers of change during each period.
This paper seeks to analyze LCLU change processes over a 28-year time period within the Cointzio watershed, in Central Mexico. Specifically, the paper’s objectives are:
Mapping of LCLU at five time periods between 1975 and 2003 using remotely sensed data;
Quantifying LCLU change through transitional matrixes and identifying the main LCLU change processes.
2. MATERIAL AND METHODS
2.1. Study area
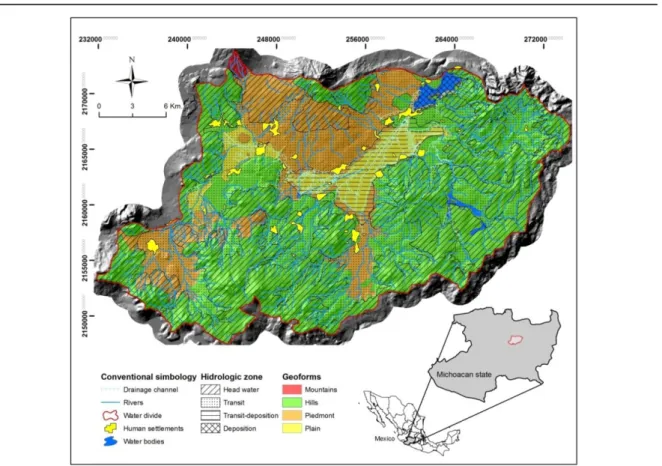
The Cointzio watershed is a sub-watershed of the Cuitzeo Lake watershed, located in the Lerma-Chapala hydrologic region, within the Trans-Mexican Volcanic Belt System in Central-Western Mexico. The sub-watershed (hereafter “watershed”) has an approximate surface of 665 km2 (Figure 1) and is comprised of mountains, hills, piedmonts and plains developed over volcanic material of intermediate to basic composition dating from the Miocene to the Recent. According to the three meteorological stations in the watershed, mean annual precipitation increases from north to south, (810, 849, 950 mm) while mean annual temperature increases from the south to the north (16.9, 16.1, 17.6 °C).
21
Figure 1. Study area. Shadow map of the Cointzio watershed depicting
geoforms and hydrologic functional zones in the watershed.
2.2. Land cover and land use mapping
LCLU was mapped in five different time intervals based on a set of remotely sensed data and existing cartography, as presented in Table 1. These data have different spectral and spatial characteristics; therefore, a uniform legend and mapping scale were developed prior to the analysis. In order to make the images comparable, they were rectified to Universal Transverse Mercator (UTM, NAD 27) projection and all mapped objects with areas of less than 3 ha (the minimum mapping area adequate for representation at the scale employed) were aggregated to their neighbouring objects. Spatial analysis was carried out in ILWIS Ver. 3.3 (ITC, 2005).
Table 1. Remote sensing data used in this research.
Aerial document Scale/resolution Year
Aerial photographs 1:50,000 1975 Landsat MSS image 60x60 m 1986 Digital Orthophotos 2x2 m 1996 Aerial photographs 1:37,000 2000
Fused Landsat ETM
LÓPEZ-GRANADOS, E.; MENDOZA, M. E.; GONZÁLEZ, D. I. Linking geomorphologic knowledge, RS and GIS techniques for analyzing land cover and land use change: a multitemporal study in the Cointzio watershed, Mexico. Ambi-Agua, Taubaté, v. 8, n. 1, p. 18-37, 2013. (http://dx.doi.org/10.4136/ambi-agua.956)
Figure 2 shows the methodological approach used in this study. LCLU were derived from photo-interpretation of panchromatic aerial photographs at an approximate scale of 1:50,000 for 1975 (acquired by National Institute of Statistics, Geography and Informatics- INEGI), and 1:37,000 for 2000 (acquired by GEOAIR). Aerial photographs at the above-mentioned scales ensured the appropriate detection of LCLU categories in a cost-effective way, as compared to very high-resolution satellite imagery (not available for 1975; Zomeni et al., 2008). In addition, conventional aerial photography allowed for the stereoscopic interpretation of relief–soil patterns. Available information sources (reports, thematic maps, censuses, etc.) were consulted simultaneously. This allowed for the identification of the most relevant LCLU types and, consequently, for the establishment of an ad hoc legend (Table 2).
Database updating (1986, 1996 and 2003) was based on satellite images and orthophotos. The databases of 1975 and 2000 were established as a reference, as these databases have cartographic confidence levels above 90% (López et al., 2006). Updating of maps was based on criteria and rules of aerial photo-interpretation (Anderson et al., 1976; Zonneveld, 1979; Lillesand and Kiefel, 1987). The interpretation of units of LCLU was made on a computer monitor, adjusting the interpretation of the year 1975 to update data of 1986 and 1996, and that of the database of the year 2000 to update data for the year 2003. Thus, five databases of LCLU were generated for a period of 28 years. Ground truth data obtained in 2002 was used to validate the classification and nine LCLU classes were generated for all of the maps (Table 2), which was essential to lessen the uncertainty arising both from the simultaneous analysis of several conditions and from their homogenization at a regional scale (Tran et al., 2002).
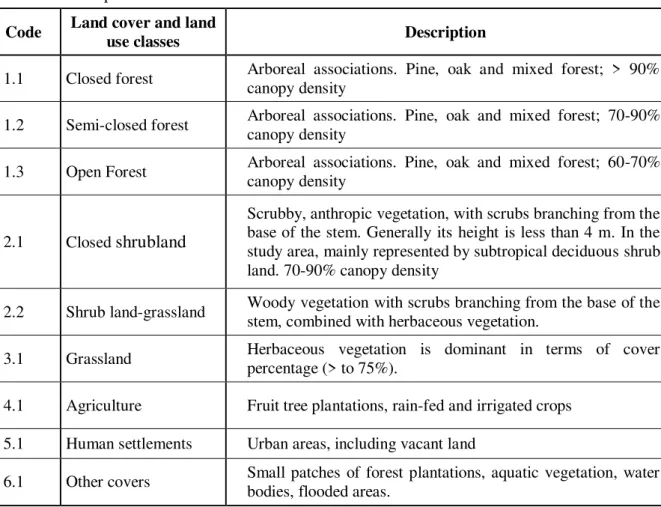
Table 2. Descriptions of LCLU classes for the Cointzio watershed.
Code Land cover and land use classes Description
1.1 Closed forest Arboreal associations. Pine, oak and mixed forest; > 90% canopy density
1.2 Semi-closed forest Arboreal associations. Pine, oak and mixed forest; 70-90% canopy density
1.3 Open Forest Arboreal associations. Pine, oak and mixed forest; 60-70% canopy density
2.1 Closed shrubland
Scrubby, anthropic vegetation, with scrubs branching from the base of the stem. Generally its height is less than 4 m. In the study area, mainly represented by subtropical deciduous shrub land. 70-90% canopy density
2.2 Shrub land-grassland Woody vegetation with scrubs branching from the base of the stem, combined with herbaceous vegetation.
3.1 Grassland Herbaceous vegetation is dominant in terms of cover percentage (> to 75%).
4.1 Agriculture Fruit tree plantations, rain-fed and irrigated crops
5.1 Human settlements Urban areas, including vacant land
23 Figure 2. Methodological flow diagram.
2.3. Geoforms mapping
Geoforms mapping was based on visual interpretation of aerial panchromatic B/W photographs, approximate scale 1:50,000 (INEGI, 1975). We followed the approach suggested by Bocco et al. (2001) for mapping regional geomorphology which is based on the land system and terrain analysis mapping schemes developed in the 1950s and 1960s, especially in Europe and Australia (Verstappen, 1983; Van Zuidam, 1985), and adaptation of the Geopedologic hieraquical classification system proposed by Zinck (1998). From the interpretation of aerial-photographs, six classes of geoforms were recognized: mountains, high hill, low hill, very low hill, piedmont, and plains. The interpretation was manually digitized directly from photographs and geometrically corrected using the mono-restitution capability of the GIS (McCullough and Moore, 1995). This method allowed the rectification of aerial photographs through ground control points and digital elevation data. Digital elevation data was derived from digital topographic data bases from original maps at a scale of 1:50,000 (INEGI, 1999).
2.4. Functional zones mapping
LÓPEZ-GRANADOS, E.; MENDOZA, M. E.; GONZÁLEZ, D. I. Linking geomorphologic knowledge, RS and GIS techniques for analyzing land cover and land use change: a multitemporal study in the Cointzio watershed, Mexico. Ambi-Agua, Taubaté, v. 8, n. 1, p. 18-37, 2013. (http://dx.doi.org/10.4136/ambi-agua.956)
Headwaters were defined as the area occupied from first order streams (scale 1:50,000), according to the Strahler classification system, and up to the water divide. The deposition zone started at the altitude where the last stream reached the main stream and ended at its mouth. Finally, the remaining area between headwater and deposition is called transit. The headwater zone is distributed over 356 km2 and comprises approximately the 53 % of the total area of the watershed, the transit zone comprises 268 km2 (40%), transit-disposition zone covers 42 km2 (6%) and the deposition zone only covers 6 km2 (4%).
2.5. LCLU change detection
A detailed analysis of the dynamics of LCLU change was made using the transition matrices. Transition matrixes are tables with symmetric arrays having in one of their axis the LCLU classes during the initial year, and in the other axis, these same classes present during the subsequent year (time period 1 and time period 2). Each cell of the main diagonal of the matrix contains the surface area (in km2) of each class of LCLU that remained unchanged during the time period analyzed, while the remaining cells contain the estimated surface of a given LCLU class that changed to a different class during the same time period (Luenberger, 1979), thus representing the dynamics of LCLU change at the local or regional scales. In a transition matrix, the conditional probability of LCLU at any given time mostly depends on the recent LCLU, and not on previous changes (Lambin, 1997).
In the present work, the transition matrixes were built using the area of the different classes derived from the LCLU maps for the time periods of 1975-1986, 1986-1996, 1996-2000, 2000-2003 and 1975-2003. It was assumed that the probability of transition (Pij) for each class in the matrix is proportional to the surface area of the corresponding class that remained without change throughout the analyzed periods (1975-1986, 1986-1996, 1996-2000, 2000-2003 and 1975-2003). In mathematical terms:
Pij = Sij (t1)/Sj (t2) where:
Sijis the surface area of the “ij” element of the LCLU transition matrix during each initial
year, and “Sj” is the surface area of the “j” LCLU class during the following year. Thus, for any “j” class:
SPij=100 2.6. Quantifying and mapping LCLU change processes
25
Finally, the LCLU change rates in the watershed were computed, using the approach proposed by FAO (1995) described in Equation 1:
100
*
1
1 2 1 1 2
t tA
A
q
[1]where:
q is change rate of land cover processes (deforestation-afforestation, urbanization, shrub
land increase) in percentage per year,
A1 is the surface area of the LCLU category for the time period 1,
A2 is the LCLU category for the time period 2,
t1 is the initial year (time 1) and
t2 is the final year (time 2).
3. RESULTS AND DISCUSSION
3.1. Land cover and land use changes at watershed level
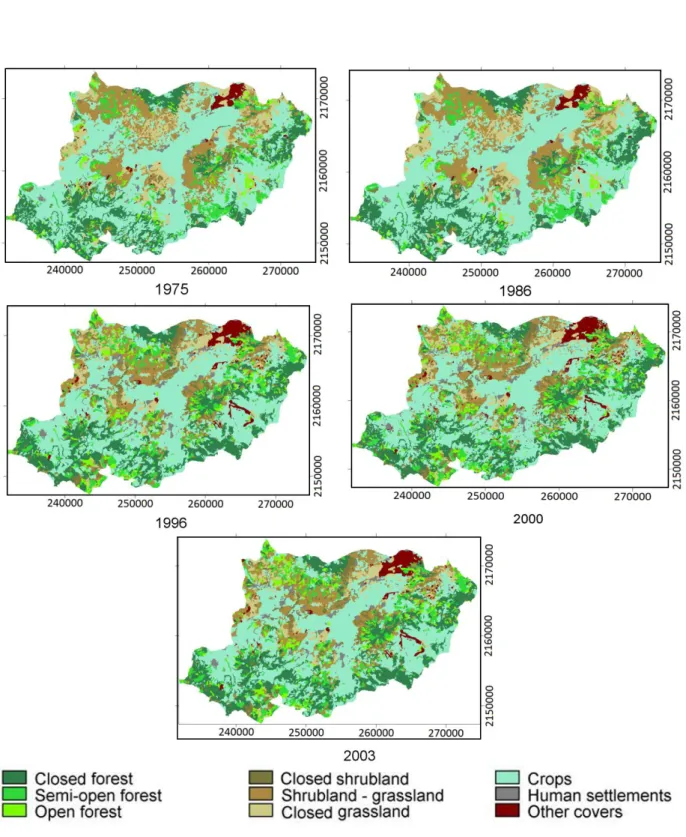
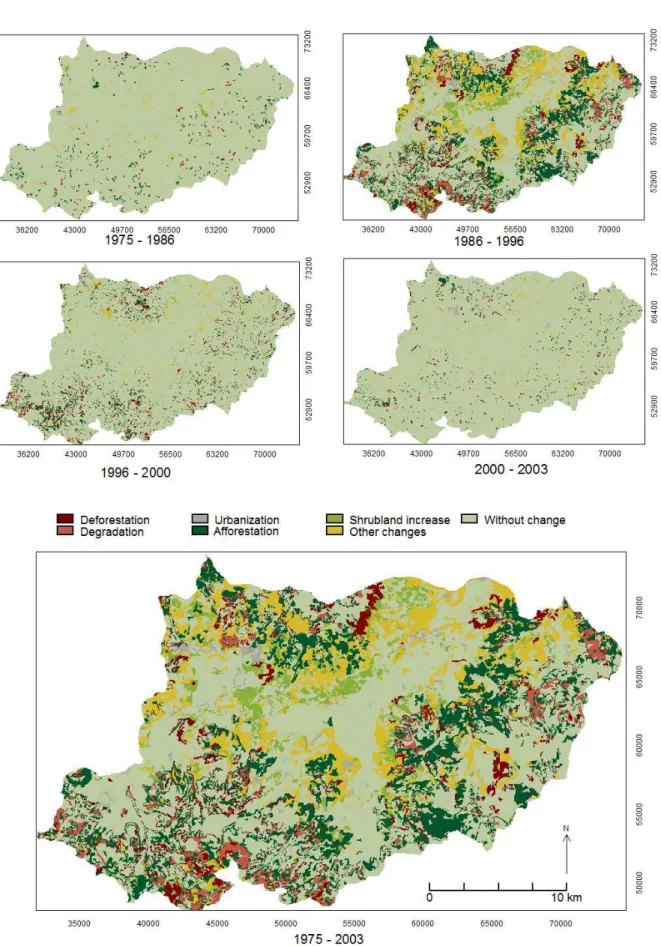
The spatial distribution of land cover land use analyzed in this study is depicted in Figure 3. The main land cover land use classes were, in order of extension: crops, closed forest, shrub land-grassland, grassland, semi-open forest, open forest, shrub land, human settlements and other covers.
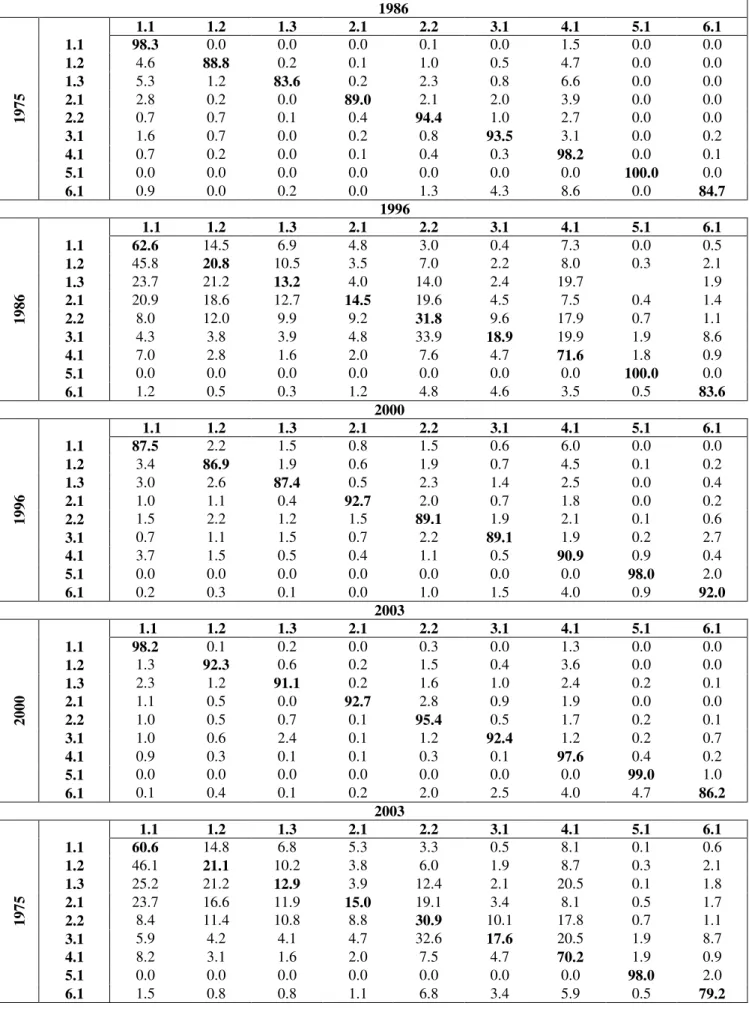
In the transition matrices shown in Table 4, it can be seen that all periods show high permanence values (>80%), with the exceptions of the 1986-1996 period and the global analysis 1976-2003, the latter resulting from the aggregation of processes along the prolonged study period; i.e., relevant change processes in the watershed only took place during the 1986-1996 period. During the remaining periods changes did not considerably affect the territory (Figure 4). Changes in the territory are largely associated with the slopes and piedmont of the watershed. In all periods, human settlements have the highest permanence probability per period, of between 98 and 100% (Table 4). Small differences observed are due to misinterpretation, and differences between databases. Urbanization is associated with areas having gentle slopes.
3.2. Change rates at watershed level
The annual rates of deforestation at the watershed level are near zero in each of the studied periods, the higher value of about 2.4 was calculated for the period 1986-1996. This was due to the dynamics of change between areas experiencing forest recovery and those with deforestation. The most conspicuous change processes throughout the entire study period are afforestation and deforestation; with a trend towards the increase of forest cover (Table 5).
LÓPEZ-GRANADOS, E.; MENDOZA, M. E.; GONZÁLEZ, D. I. Linking geomorphologic knowledge, RS and GIS techniques for analyzing land cover and land use change: a multitemporal study in the Cointzio watershed, Mexico. Ambi-Agua, Taubaté, v. 8, n. 1, p. 18-37, 2013. (http://dx.doi.org/10.4136/ambi-agua.956)
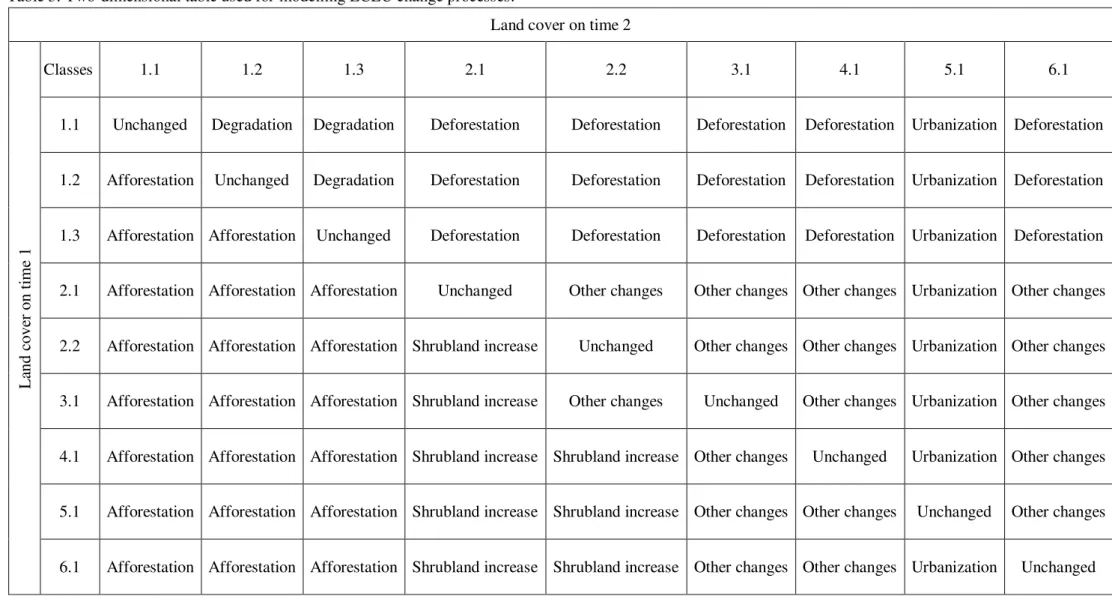
Table 3. Two-dimensional table used for modelling LCLU change processes.
Land cover on time 2
La
nd
cove
r
on
tim
e
1
Classes 1.1 1.2 1.3 2.1 2.2 3.1 4.1 5.1 6.1
1.1 Unchanged Degradation Degradation Deforestation Deforestation Deforestation Deforestation Urbanization Deforestation
1.2 Afforestation Unchanged Degradation Deforestation Deforestation Deforestation Deforestation Urbanization Deforestation
1.3 Afforestation Afforestation Unchanged Deforestation Deforestation Deforestation Deforestation Urbanization Deforestation
2.1 Afforestation Afforestation Afforestation Unchanged Other changes Other changes Other changes Urbanization Other changes
2.2 Afforestation Afforestation Afforestation Shrubland increase Unchanged Other changes Other changes Urbanization Other changes
3.1 Afforestation Afforestation Afforestation Shrubland increase Other changes Unchanged Other changes Urbanization Other changes
4.1 Afforestation Afforestation Afforestation Shrubland increase Shrubland increase Other changes Unchanged Urbanization Other changes
5.1 Afforestation Afforestation Afforestation Shrubland increase Shrubland increase Other changes Other changes Unchanged Other changes
27
LÓPEZ-GRANADOS, E.; MENDOZA, M. E.; GONZÁLEZ, D. I. Linking geomorphologic knowledge, RS and GIS techniques for analyzing land cover and land use change: a multitemporal study in the Cointzio watershed, Mexico. Ambi-Agua, Taubaté, v. 8, n. 1, p. 18-37, 2013. (http://dx.doi.org/10.4136/ambi-agua.956)
28
Figure 4. Maps of land cover and land use change processes by period in the Cointzio
29
Table 4. Transitional matrixes in percentage by period in the Cointzio watershed.
1986
1975
1.1 1.2 1.3 2.1 2.2 3.1 4.1 5.1 6.1
1.1 98.3 0.0 0.0 0.0 0.1 0.0 1.5 0.0 0.0
1.2 4.6 88.8 0.2 0.1 1.0 0.5 4.7 0.0 0.0
1.3 5.3 1.2 83.6 0.2 2.3 0.8 6.6 0.0 0.0
2.1 2.8 0.2 0.0 89.0 2.1 2.0 3.9 0.0 0.0
2.2 0.7 0.7 0.1 0.4 94.4 1.0 2.7 0.0 0.0
3.1 1.6 0.7 0.0 0.2 0.8 93.5 3.1 0.0 0.2
4.1 0.7 0.2 0.0 0.1 0.4 0.3 98.2 0.0 0.1
5.1 0.0 0.0 0.0 0.0 0.0 0.0 0.0 100.0 0.0
6.1 0.9 0.0 0.2 0.0 1.3 4.3 8.6 0.0 84.7
1996
1986
1.1 1.2 1.3 2.1 2.2 3.1 4.1 5.1 6.1
1.1 62.6 14.5 6.9 4.8 3.0 0.4 7.3 0.0 0.5
1.2 45.8 20.8 10.5 3.5 7.0 2.2 8.0 0.3 2.1
1.3 23.7 21.2 13.2 4.0 14.0 2.4 19.7 1.9
2.1 20.9 18.6 12.7 14.5 19.6 4.5 7.5 0.4 1.4
2.2 8.0 12.0 9.9 9.2 31.8 9.6 17.9 0.7 1.1
3.1 4.3 3.8 3.9 4.8 33.9 18.9 19.9 1.9 8.6
4.1 7.0 2.8 1.6 2.0 7.6 4.7 71.6 1.8 0.9
5.1 0.0 0.0 0.0 0.0 0.0 0.0 0.0 100.0 0.0
6.1 1.2 0.5 0.3 1.2 4.8 4.6 3.5 0.5 83.6
2000
1996
1.1 1.2 1.3 2.1 2.2 3.1 4.1 5.1 6.1
1.1 87.5 2.2 1.5 0.8 1.5 0.6 6.0 0.0 0.0
1.2 3.4 86.9 1.9 0.6 1.9 0.7 4.5 0.1 0.2
1.3 3.0 2.6 87.4 0.5 2.3 1.4 2.5 0.0 0.4
2.1 1.0 1.1 0.4 92.7 2.0 0.7 1.8 0.0 0.2
2.2 1.5 2.2 1.2 1.5 89.1 1.9 2.1 0.1 0.6
3.1 0.7 1.1 1.5 0.7 2.2 89.1 1.9 0.2 2.7
4.1 3.7 1.5 0.5 0.4 1.1 0.5 90.9 0.9 0.4
5.1 0.0 0.0 0.0 0.0 0.0 0.0 0.0 98.0 2.0
6.1 0.2 0.3 0.1 0.0 1.0 1.5 4.0 0.9 92.0
2003
2000
1.1 1.2 1.3 2.1 2.2 3.1 4.1 5.1 6.1
1.1 98.2 0.1 0.2 0.0 0.3 0.0 1.3 0.0 0.0
1.2 1.3 92.3 0.6 0.2 1.5 0.4 3.6 0.0 0.0
1.3 2.3 1.2 91.1 0.2 1.6 1.0 2.4 0.2 0.1
2.1 1.1 0.5 0.0 92.7 2.8 0.9 1.9 0.0 0.0
2.2 1.0 0.5 0.7 0.1 95.4 0.5 1.7 0.2 0.1
3.1 1.0 0.6 2.4 0.1 1.2 92.4 1.2 0.2 0.7
4.1 0.9 0.3 0.1 0.1 0.3 0.1 97.6 0.4 0.2
5.1 0.0 0.0 0.0 0.0 0.0 0.0 0.0 99.0 1.0
6.1 0.1 0.4 0.1 0.2 2.0 2.5 4.0 4.7 86.2
2003
1975
1.1 1.2 1.3 2.1 2.2 3.1 4.1 5.1 6.1
1.1 60.6 14.8 6.8 5.3 3.3 0.5 8.1 0.1 0.6
1.2 46.1 21.1 10.2 3.8 6.0 1.9 8.7 0.3 2.1
1.3 25.2 21.2 12.9 3.9 12.4 2.1 20.5 0.1 1.8
2.1 23.7 16.6 11.9 15.0 19.1 3.4 8.1 0.5 1.7
2.2 8.4 11.4 10.8 8.8 30.9 10.1 17.8 0.7 1.1
3.1 5.9 4.2 4.1 4.7 32.6 17.6 20.5 1.9 8.7
4.1 8.2 3.1 1.6 2.0 7.5 4.7 70.2 1.9 0.9
5.1 0.0 0.0 0.0 0.0 0.0 0.0 0.0 98.0 2.0
LÓPEZ-GRANADOS, E.; MENDOZA, M. E.; GONZÁLEZ, D. I. Linking geomorphologic knowledge, RS and GIS techniques for analyzing land cover and land use change: a multitemporal study in the Cointzio watershed, Mexico. Ambi-Agua, Taubaté, v. 8, n. 1, p. 18-37, 2013. (http://dx.doi.org/10.4136/ambi-agua.956)
30
Table 5 Annual rates in percentage of change in the Cointzio watershed.
Period/Processes Deforestation annual rate
Shrubland annual rate
Urbanization annual rate
1975-1986 0.00 -0.24 0.03
1986-1996 2.41 0.27 5.63
1996-2000 0.49 0.26 1.06
2000-2003 0.07 -0.46 0.44
1975-2003 0.93 -0.01 2.19
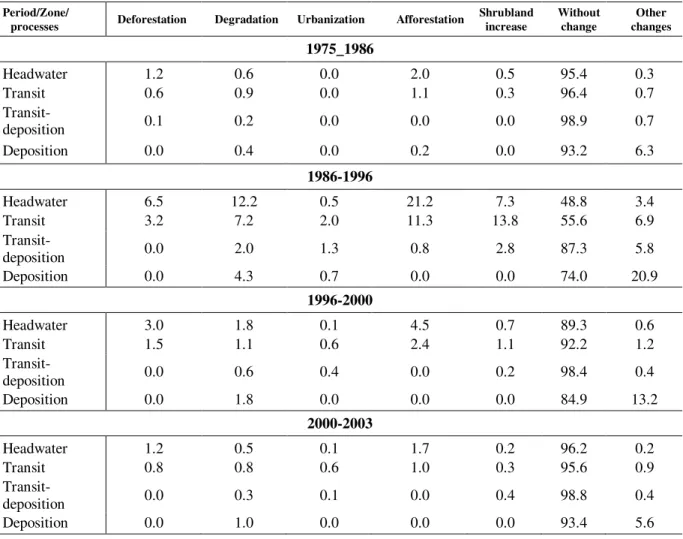
3.3. Aggregation of change processes by functional zones
The distribution of change processes in the functional zones (Table 6) shows that negative processes (deforestation and degradation) in the Headwater zone were only present during the 1986-1996 period, when the Headwater zone reduced its forest cover by 6.5% and was degraded in terms of cover density by 12.2%. However, during that same period (1986-1996), the forest cover in the Headwater experienced its largest expansion of 21% of its surface. A process of urbanization was present in the zone during the 1986-1996 period over a 2% of the surface. However, the most conspicuous change processes in the zone during the same period represented a positive impact of afforestation (10.9%) and shrub land increase (13.8%).
Table 6. Aggregation of change processes in percentage by functional zone in the Cointzio watershed.
Period/Zone/
processes Deforestation Degradation Urbanization Afforestation
Shrubland increase
Without change
Other changes
1975_1986
Headwater 1.2 0.6 0.0 2.0 0.5 95.4 0.3
Transit 0.6 0.9 0.0 1.1 0.3 96.4 0.7
Transit-deposition 0.1 0.2 0.0 0.0 0.0 98.9 0.7
Deposition 0.0 0.4 0.0 0.2 0.0 93.2 6.3
1986-1996
Headwater 6.5 12.2 0.5 21.2 7.3 48.8 3.4
Transit 3.2 7.2 2.0 11.3 13.8 55.6 6.9
Transit-deposition 0.0 2.0 1.3 0.8 2.8 87.3 5.8
Deposition 0.0 4.3 0.7 0.0 0.0 74.0 20.9
1996-2000
Headwater 3.0 1.8 0.1 4.5 0.7 89.3 0.6
Transit 1.5 1.1 0.6 2.4 1.1 92.2 1.2
Transit-deposition 0.0 0.6 0.4 0.0 0.2 98.4 0.4
Deposition 0.0 1.8 0.0 0.0 0.0 84.9 13.2
2000-2003
Headwater 1.2 0.5 0.1 1.7 0.2 96.2 0.2
Transit 0.8 0.8 0.6 1.0 0.3 95.6 0.9
Transit-deposition 0.0 0.3 0.1 0.0 0.4 98.8 0.4
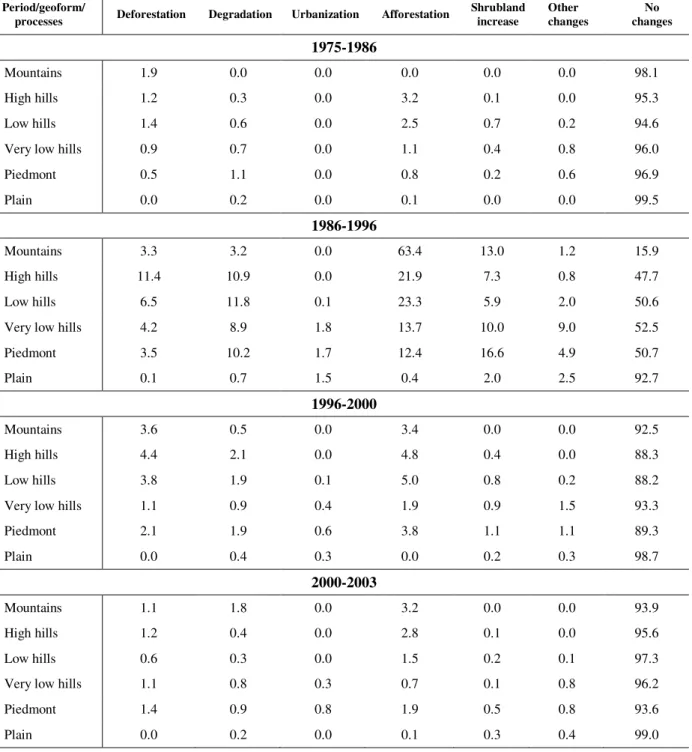
31 3.4. Aggregation of change processes by geoforms
The High hills are the geoforms with the more extensive surface showing negative changes, with 11.4% deforested area and 11% of its area experiencing forest degradation. However, change processes also had a considerable positive impact on this geoform, given that 22% afforestation occurred and shrub land increased by 7.5%. The Low hills (the most amply distributed geoform in the watershed) experienced 23% afforestation and a shrub land increase of 6%.shrub landThe Piedmonts and the Very low hills showed a greater shrub land increase, at16 and 10% of their total surfaces, respectively. During the intervals 1975-1986, 1996-2000 and 2000-2003 the dominant category is “no changes”, except for punctual events
of afforestation and deforestation during the period 1996-2000 (Table 7). Table 7. Land cover land use change in percentage processes by geoforms.
Period/geoform/
processes Deforestation Degradation Urbanization Afforestation
Shrubland increase
Other changes
No changes
1975-1986
Mountains 1.9 0.0 0.0 0.0 0.0 0.0 98.1
High hills 1.2 0.3 0.0 3.2 0.1 0.0 95.3
Low hills 1.4 0.6 0.0 2.5 0.7 0.2 94.6
Very low hills 0.9 0.7 0.0 1.1 0.4 0.8 96.0
Piedmont 0.5 1.1 0.0 0.8 0.2 0.6 96.9
Plain 0.0 0.2 0.0 0.1 0.0 0.0 99.5
1986-1996
Mountains 3.3 3.2 0.0 63.4 13.0 1.2 15.9
High hills 11.4 10.9 0.0 21.9 7.3 0.8 47.7
Low hills 6.5 11.8 0.1 23.3 5.9 2.0 50.6
Very low hills 4.2 8.9 1.8 13.7 10.0 9.0 52.5
Piedmont 3.5 10.2 1.7 12.4 16.6 4.9 50.7
Plain 0.1 0.7 1.5 0.4 2.0 2.5 92.7
1996-2000
Mountains 3.6 0.5 0.0 3.4 0.0 0.0 92.5
High hills 4.4 2.1 0.0 4.8 0.4 0.0 88.3
Low hills 3.8 1.9 0.1 5.0 0.8 0.2 88.2
Very low hills 1.1 0.9 0.4 1.9 0.9 1.5 93.3
Piedmont 2.1 1.9 0.6 3.8 1.1 1.1 89.3
Plain 0.0 0.4 0.3 0.0 0.2 0.3 98.7
2000-2003
Mountains 1.1 1.8 0.0 3.2 0.0 0.0 93.9
High hills 1.2 0.4 0.0 2.8 0.1 0.0 95.6
Low hills 0.6 0.3 0.0 1.5 0.2 0.1 97.3
Very low hills 1.1 0.8 0.3 0.7 0.1 0.8 96.2
Piedmont 1.4 0.9 0.8 1.9 0.5 0.8 93.6
LÓPEZ-GRANADOS, E.; MENDOZA, M. E.; GONZÁLEZ, D. I. Linking geomorphologic knowledge, RS and GIS techniques for analyzing land cover and land use change: a multitemporal study in the Cointzio watershed, Mexico. Ambi-Agua, Taubaté, v. 8, n. 1, p. 18-37, 2013. (http://dx.doi.org/10.4136/ambi-agua.956)
32
3.5. Aggregation of rates of change by functional zone
The change rates aggregated by functional zone (Table 8) behave similarly to those aggregated for the whole watershed. The Transit-deposition zone had a high annual rate of deforestation during the 1975-1986 period, which makes sense when analyzed in a relative manner inside the Transit-deposition zone; however, the involved area is small in absolute terms.
As in the above-mentioned analyses, the critical period corresponds to the period 1986-1996, during which the annual rate of deforestation was 2.08 % for the Headwater zone and 3.44 % for the transit zone, which represents a positive change in the watershed (afforestation). The global period (1975-2003) shows a slight trend to the increase of the area undergoing afforestation
The annual rates of shrub land increase for all functional zones and for all periods remain stable with a value close to zero; as mentioned above, this is due to the change dynamics of this LCLU class. The higher urbanization rate of 23.6% occurred during the 1986-1996 period in the Deposition zone.
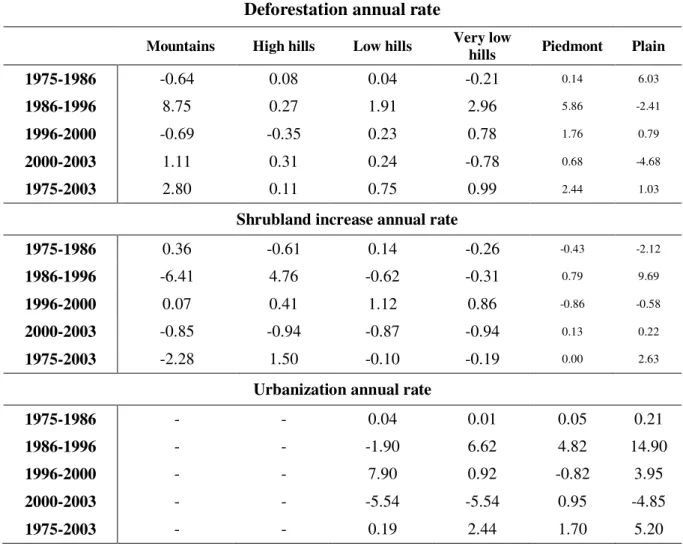
3.6. Aggregation of change rates by geoforms
The aggregation of change rates in the watershed by geoform (Table 9) indicates that the deforestation rates in all geoforms and for all periods remain stable with a value close to zero, with only a slight positive trend noticeable during the critical period of 1986-1996: 0.2 % in the High hills, 2.9 % in Very low hills, 1.9 % in Low hills, and the highest rate (8.7 %) in Mountains (the geoform with less representation in the watershed), and 5.9 % in Piedmonts. The only negative rate of -2.4 % occurred in the Plain, which shows a slight recovery of the forest.
The annual shrub land increase rates remained constant at values near zero, while urbanization processes were scarcely represented in the watershed, the higher rate of 16 % occurred in the Plains during the 1986-1996 period.
The rate and surface of the LCLU change processes assessed in the present work, both at the level of watershed and of hydrological functional zone, reach their highest values during the period 1986-1996, the period during which the rate of emigration to the USA increased, as did the residence periods in that country of emigrants (Corona, 1990). However, despite the lack of a precise quantification of undocumented migrants, indirect estimates and the results of several anthropological studies conducted both in the originating and destination communities of migrants (Corona, 1990) consistently register an increase in the number of migrants during that period compared to the same period in previous decades.
The change in the migration pattern is related to the Immigration Reform and Control Act (IRCA), or Simpson-Rodino Law, which according to Cornelius (1989), seems to have accelerated the change from temporal to permanent emigration and settlement in the USA of undocumented workers by providing the them opportunity to legalize their immigration status if they were able to prove they worked at least 90 days on farms during the twelve-month period ending on May 1st 1986.
Another important variable related to the LCLU patterns and processes of change is associated with the Mexican economic crisis during the eighties which, together with other pressure factors in the labour market, caused a generalized deterioration of the standards of
living. One of the consequences of such deterioration in the Mexican population’s wellbeing
33
Another change worth pointing out is the expansion of urban areas experienced during the 1986-1996 period. This process coincides with the aftermath of the September 19, 1985 earthquake that occurred in Mexico City. That tremor, which measured 8.1 degrees on the Richter scale, caused the death of tens of thousands of people and motivated the migration of thousands of families out of Mexico City. The earthquake also launched a federal decentralization policy, which promoted the rapid growth of mid-sized cities, such as Morelia, due to the arrival of federal government employees and their families. This consequently increased the demand for services for the growing population, which increasing human pressure on natural resources and negatively impacted environmental goods and services around the city.
Finally, deforestation in the headwater and zones reduces the water recharge capacity of the system, and increases the transportation of sediments and nutrients downstream, thus affecting the water quality of artificial and natural water bodies located in the deposition zone, to include the Cointzio reservoir. In addition, degradation in the higher zones of the watershed reduces the lifetime of the reservoirs due to the accumulation of sediments. Conservation programs are therefore important to the preservation of the headwater and zones, in particular the former, while deposition zones are more suitable for restoration and conservation policies.
Table 9. Annual change in percentage rates by geoforms.
Deforestation annual rate
Mountains High hills Low hills Very low
hills Piedmont Plain
1975-1986 -0.64 0.08 0.04 -0.21 0.14 6.03
1986-1996 8.75 0.27 1.91 2.96 5.86 -2.41
1996-2000 -0.69 -0.35 0.23 0.78 1.76 0.79
2000-2003 1.11 0.31 0.24 -0.78 0.68 -4.68
1975-2003 2.80 0.11 0.75 0.99 2.44 1.03
Shrubland increase annual rate
1975-1986 0.36 -0.61 0.14 -0.26 -0.43 -2.12
1986-1996 -6.41 4.76 -0.62 -0.31 0.79 9.69
1996-2000 0.07 0.41 1.12 0.86 -0.86 -0.58
2000-2003 -0.85 -0.94 -0.87 -0.94 0.13 0.22
1975-2003 -2.28 1.50 -0.10 -0.19 0.00 2.63
Urbanization annual rate
1975-1986 - - 0.04 0.01 0.05 0.21
1986-1996 - - -1.90 6.62 4.82 14.90
1996-2000 - - 7.90 0.92 -0.82 3.95
2000-2003 - - -5.54 -5.54 0.95 -4.85
LÓPEZ-GRANADOS, E.; MENDOZA, M. E.; GONZÁLEZ, D. I. Linking geomorphologic knowledge, RS and GIS techniques for analyzing land cover and land use change: a multitemporal study in the Cointzio watershed, Mexico. Ambi-Agua, Taubaté, v. 8, n. 1, p. 18-37, 2013. (http://dx.doi.org/10.4136/ambi-agua.956)
34
4. CONCLUSIONS
Quantitative information of processes of LCLU change presented herein is based on the interaction of remote sensing, geographic information system (GIS) and geomorphologic knowledge. The results of this analysis indicate that changes in LCLU are not constant during the analyzed period. It is concluded that most of the processes of change occurred in a period of less than ten of the 28 analyzed years, between 1986 and 1996. This period was associated with a profound economic crisis in Mexico, and is coupled also to the passage of the IRCA in 1986, which limited the transit of Mexican undocumented workers to the USA. This finding implies that the most important causes of LCLU change in the Lake Cuitzeo Watershed are due to public policy decisions, some of which were not even made within the country. One of the consequences of this decrease in the well being of citizens was the search for alternative and supplementary means for survival, among which is participation in marginal economic activities and new modalities of internal migration, in particular to the city of Morelia.
Both aforementioned events have as a consequence the change in patterns of pressure over natural resources in the Cointzio watershed, specifically on forests. The intense dynamics of change during critical periods modify the spatial distribution of LCLU, at the same time impacting both negatively and positively on the natural resources in the Cointzio watershed (e.g., afforestation vs. deforestation) in a differential manner throughout time and with different spatial patterns.
This study has provided important insights into the dynamics that occurred between 1975 and 2003 in a rural area with a high urbanization rate, and provides a solid quantitative foundation for the design and implementation of environmental policies and for institutional analyses.
The results depicted three spatial units of analysis (watershed, functional zones and geoforms), and were also useful for the provision of land use planning recommendations, such as identifying where, and over what quantity of land, LCLU changes are taking place in this area. As a consequence, we identified the spatial units in which restoration and conservation policies and associated implementation actions can best be conducted.
5. ACKNOWLEDGMENTS
The present research was partially funded by the European Union through a grant for the project Desertification Mitigation & Remediation of Land (DESIRE) and partially by the
UNAM through a grant for the project “Evaluación espacial y multitemporal de los cambios de cobertura y uso del terreno en la cuenca del lago de Cuitzeo: implicaciones para la sucesión forestal y el mantenimiento de la diversidad vegetal” (clave IN304408), The authors
thank S. Zárate for reading and commenting on a previous version of this paper, and V. Salinas for helping with GIS procedures. Authors acknowledge two anonymous reviewers for their comments.
6. REFERENCES
35
BHATTA; B. R.; CHALISE, S. R.; MYINT, A. K.; SHARMA, P. N. (Eds.). Recent concepts, knowledge, practices, and new skills in participatory integrated watershed management: trainers resource book. Kathmandu: ICIMOD; PWMTA-FAO; Department of Soil Conservation and Watershed Management, 1999.
BOCCO, G.; MENDOZA, M. E.; VELÁZQUEZ, A. Remote sensing and GIS-based regional geomorphologic mapping –a tool for land use planning in developing countries. Geomorphology, v. 39, n. 3/4, p. 211–219, 2001. http://dx.doi.org/10.1016/S0169-555X(01)00027-7
ÇAKIR, G.; ÜN, C.; BASKENT, E.; KÖSE, S.; SIVRIKAYA, F.; KELEŞ, S. Evaluating urbanization, fragmentation and land use/land cover change pattern in Istanbul city, Turkey from 1971 to 2002. Land Degradation & Development, v. 19, n. 6, p. 663-675, 2008. http://dx.doi.org/10.1002/ldr.859
CORNELIUS, W.A. Impacts of the 1986 US Immigration Law on Emigration from Rural Mexican Sending Communities. Population and Development Review, v. 15 n. 4, 689-705, 1989.
CORONA, R. La migración de mexicanos a los Estados Unidos: cambios en la década de 1980-1990. Revista Mexicana de Sociología, v. 55, n. 1, 213-233, 1990.
DUNJÓ G.; PARDINI, G.; GISPERT, M. Land use change effects on abandoned terraced soils in a Mediterranean catchment, NE Spain. CATENA, v. 52, 23 -37, 2003. http://dx.doi.org/10.1016/S0341-8162(02)00148-0
FOOD AND AGRICUTURE ORGANIZATION - FAO. Forest resources assessment 1990. Global Synthesis. Roma, 1995.
FULLER R. M.; SMITH, G. M.; DEVEREUX, B. J. The characterization and measurement of land cover change through remote sensing: problems in operational applications? International Journal of Applied Earth Observation and Geoinformation, v. 4, p. 243 253, 2003. http://dx.doi.org/10.1016/S0303-2434(03)00004-7
GAUTAM, A. P.; WEBB, E.; SHIVAKOTIA, G. P.; ZOEBISCH, M. A. Land use dynamics and landscape change pattern in a mountain watershed in Nepal. Agriculture, Ecosystems and Environment, v. 99, p. 83–96, 2003. http://dx.doi.org/10.1016/S0167-8809(03)00148-8
HE, C.; MALCOLM, S. B.; DAHLBERG, K. A.; FU, B. A conceptual framework for integrating hydrological and biological indicators into watershed management. Landscape and Urban Planning, v. 49, n. 1/2, p. 25-34, 2000. http://dx.doi. org/10.1016/S0169-2046(00)00047-5
HEISTERMANN, M.; MÜLLER, C.; RONNEBERGER, R. Land in sight? Achievements, deficits and potentials of continental to global scale land-use modeling. Agriculture, Ecosystems and Environment, v. 114, p. 141-158, 2006. http://dx.doi.org/10.1016/ j.agee.2005.11.015
INSTITUTO NACIONAL DE ESTADÍSTICA Y GEOGRAFÍA - INEGI. Conjunto de datos
vectoriales. Aguascalientes, 1999. Escala 1:50,000.
LÓPEZ-GRANADOS, E.; MENDOZA, M. E.; GONZÁLEZ, D. I. Linking geomorphologic knowledge, RS and GIS techniques for analyzing land cover and land use change: a multitemporal study in the Cointzio watershed, Mexico. Ambi-Agua, Taubaté, v. 8, n. 1, p. 18-37, 2013. (http://dx.doi.org/10.4136/ambi-agua.956)
36
JANSEN, L. J. M.; DI GREGORIO, A. Parametric land cover and land-use classification as tools for environmental change detection. Agriculture, Ecosystems and Environment, v. 91, p. 89-100, 2002. http://dx.doi.org/10.1016/S0167-8809(01)00243-2
KAMUSOKO, C.; ANIYA, M. Land use/cover change and landscape fragmentation analysis in the Bindura District, Zimbabwe. Land Degradation & Development, v. 18, n. 2, p. 221-233, 2006. http://dx.doi.org/10.1002/ldr.761
LAMBIN, E. F. Modeling and monitoring land-cover change processes in tropical regions. Progress in Physical Geography, v. 21, n. 3, p. 375–393, 1997. http://dx.doi.org/ 10.1177/030913339702100303
LI, X.Y.; MA, Y. J.; XU, H. Y.; WANG, J. H.; ZHANG, D. S. Impact of land use and land cover change on environmental degradation in lake Qinghai watershed, northeast Qinghai-Tibet Plateau. Land Degradation & Development, v. 20, n. 1, p., 69-83, 2009. http://dx.doi.org/10.1002/ldr.885
LILLESAND T. M.; KIEFEL, R. W. Remote sensing and image interpretation. 2nd ed. New York: Wiley, 1987.
LÓPEZ, E.; BOCCO, G.; MENDOZA, M. E.; VELÁZQUEZ, A.; AGUIRRE, R. Peasant emigration and land-use change at the watershed level. A GIS-based approach in Central Mexico. Agricultural Systems, v. 90 n. 1/3, p. 62-78, 2006. http://dx.doi.org/10.1016/j.agsy.2005.11.001
LUENBERGER, D. G. Introduction to Dynamic Systems: theory, models, and applications. New York: John Wiley & Sons, 1979.
MENDOZA, M. E.; BOCCO, G.; BRAVO, M. Spatial prediction in hydrology: status and implications in the estimation of hydrological processes for applied research. Progress in Physical Geography, n. 26, n. 3, p. 319-338, 2002. http://dx.doi.org/ 10.1191/0309133302pp335ra
MEYER, W. B.; TURNER II, B. L. Changes in land use and land cover: a global perspective. Cambridge: Cambridge University Press, 1994. 537 p.
MILESI, C.; HASHIMOTO, H.; RUNNING, S. W.; NEMANI, R. R. Climate variability, vegetation productivity and people at risk. Global and Planetary Change, n. 47, p. 221-231, 2005. http://dx.doi.org/10.1016/j.gloplacha.2004.10.020
MCCULLOUGH, D.; MOORE, K. Issues and methodologies in integrating aerial photography and digital base maps. Geographic Information Systems, v. 5, n. 3, p. 46–48, 1995.
MWAVU, E. N.; WITKOWSKI, E. T. F. Land-use and cover changes (1988-2002) around budongo forest reserve, NW Uganda: implications for forest and woodland sustainability. Land Degradation & Development, n. 19, v. 6, p. 606–622, 2008. http://dx.doi.org/10.1002/ldr.869
37
SALEHI, A.; WILHELMSSON, E.; SÖDERBERG, U. Land cover changes in a forested watershed, southern Zagros, Iran. Land Degradation & Development, v. 19, n. 5, p. 542-553, 2008. http://dx.doi.org/10.1002/ldr.860
SCHUMM, S. A. The fluvial system. New York: Blackburn Press, 1977. 338p.
TRAN, T. L.; KNIGHT, G. C.; O’NEILL, V. R.; RIITTERS, H. K.; WICKHAM, J. Fuzzy decision analysis for integrated environmental vulnerability assessment of the mid-atlantic region. Environmental Management, v. 29, n. 6, p. 845–859, 2002. http://dx.doi.org/10.1007/s00267-001-2587-1
VAN ZUIDAM, R. Aerial photointerpretation in terrain analysis and geomorphologic mapping. ITC Books VII-6. Enschede: [s.n], 1985. 309 p.
VERSTAPPEN, H.T. H. Applied geomorphology. Amsterdam: Elsevier, 1983.
VITOUSEK, P. M.; MOONEY, H. A.; LUBCHENCO, J.; MELILLO, J. M. Human domination of earth's ecosystems. Science, v. 277, p. 494–499, 1997. http://dx.doi.org/10.1126/science.277.5325.494
XIAO, J.; SHEN, Y., GE, J.; TATEISHI, R.; TANG, C.; LIANG, Y. et al. Evaluating urban expansion and land use change in Shijiazhuang, China, by using GIS and remote sensing. Landscape and Urban Planning, v. 75, n. 1/2, p. 69-80, 2006. http://dx.doi.org/10.1016/j.landurbplan.2004.12.005
ZINCK, J. A. Physiography and soils. Enschede: ITC Enschede, 1988.
ZOMENI, M.; TZANOPOULOS, J.; PANTIS, J. D. Historical analysis of landscape change using remote sensing techniques: An explanatory tool for agricultural transformation in Greek rural areas. Landscape and Urban Planning, v. 86, n. 1, p. 38-46, 2008. http://dx.doi.org/10.1016/j.landurbplan.2007.12.006