ENERGY POVERTY IN THE EUROPEAN UNION AND THE ROLE
OF POVERTY POLICIES: THE PARTICULAR CASE OF PORTUGAL
Ana Sofia Simões MalheiroDissertation
Master in Economics
Supervised by
Sandra Maria Tavares da Silva Joana Rita Pinho Resende
i
Abstract
The energy poverty problem has been gaining relevance in the European Union in recent years. Despite its importance, this concept has only recently started to receive a significant deal of attention both in the economic literature and in the public policy agenda, namely in the European Union framework. The problem has been officially recognized in the European legislation in 2009 through its explicit incorporation in the “Third Energy Package”. However, at the present moment, there is no common policy instruments in this area and only country-specific measures have been individually designed and implemented by each Member State.
The present dissertation investigates the state-of-the-art literature in this field, presenting an analysis of the concept of energy poverty, as well as an explanation of the different measures that have been suggested to quantify this phenomenon. The thesis also examines the evolution of the energy poverty concept in the framework of EU energy policies and performs a cluster analysis in order to group the EU countries according to their energy poverty characteristics. According to our results, the overall level of energy poverty of the Member States has globally decreased, and the countries have become more homogeneous in recent years.
In order to shed some light on the impact of energy poverty policies over the performance of the energy poverty indicators, we look at the Portuguese case. Our preliminary investigation on this case suggests that the Portuguese energy poverty policies may have only started to affect the performance of the energy poverty indicators after the extension of the eligibility criteria to benefit from social tariffs and the implementation of an automatic enrolment process (to get such benefits).
JEL codes:
I32, Q40, Q43, Q48Keywords:
Energy policy, energy poverty, European Union, Portugal, vulnerable consumersii
Contents Index
Contents Index... ii
Tables Index ... iii
Figures Index ... iv
Annexes Index ... v
Chapter 1. Introduction ... 1
Chapter 2. Literature Review ... 3
2.1. Energy poverty: concept and measurement ... 3
2.2. Energy poverty in the European Union ... 9
2.3. Energy Poverty Policies in the EU ... 17
2.3.1. Vulnerable Consumers Identification ... 19
2.3.2. Measures taken to Protect the Vulnerable Consumers ... 20
Chapter 3. Methodology ... 26
Chapter 4. Analysis of Main Results ... 29
4.1. Data description ... 29
4.2. Cluster Analysis: a cross-country comparison for 2007, 2010 and 2017... 31
4.3. The Portuguese case ... 48
Chapter 5. Conclusion ... 56
Bibliographic References ... 59
iii
Tables Index
Table 1 – Concept and measurement of energy poverty: a systematization ... 9
Table 2 – Energy poverty definition and measurement in some European countries ... 16
Table 3 – Measures by Member States to improve the energy efficiency of the buildings .. 21
Table 4 – Financial Support Measures in the EU ... 23
Table 5 – Additional Protection Measures ... 24
Table 6 – Consumers Information Measures ... 25
Table 7 – Information sharing ... 25
Table 8 – EPOV indicators data availability ... 29
Table 9 – Clusters and Outliers created with the application of the Nearest Neighbour Method (2007) ... 34
Table 10 – Clusters and Outliers resulting from the application of the Farthest Neighbour Method (2007) ... 37
Table 11 – Clusters and Outliers obtained with the application of the Ward’s Method (2007) ... 39
Table 12 – Clusters and Outliers created with the application of the Nearest Neighbour Method (2010) ... 40
Table 13 – Clusters and Outliers created with the application of the Farthest Neighbour Method (2010) ... 41
Table 14 – Clusters and Outliers created with the application of the Ward’s Method (2010) . 42 Table 15 – Clusters and Outliers created with the application of the Nearest Neighbour Method (2017) ... 42
Table 16 – Clusters and Outliers created with the application of the Farthest Neighbour Method (2017) ... 45 Table 17 – Clusters and Outliers created with the application of the Ward’s Method (2017) . 47
iv
Figures Index
Figure 1 – Electricity prices at the EU Member States (2007, 2010 and 2016) ... 12 Figure 2 – Population unable to keep their home adequately warm at the EU Member States (2007, 2010 and 2016) ... 13 Figure 3 – Timeline of the EU main energy poverty policies ... 18 Figure 4 – Dendrogram resulting from the Nearest Neighbour Method application (2007) ... 33 Figure 5 – Agglomeration graphic of the Nearest Neighbour Method application (2007) .. 34 Figure 6 – Dendrogram resulting of the Farthest Neighbour Method application (2007) ... 36 Figure 7 – Agglomeration graphic of the Farthest Neighbour Method application (2007) . 36 Figure 8 – Dendrogram resulting of the Ward’s Method application (2007) ... 38 Figure 9 – Agglomeration graphic of the Ward’s Method application (2007) ... 39 Figure 10 – Dendrogram resulting of the Farthest Neighbour Method application (2017). 45 Figure 11 – Dendrogram resulting of the Ward’s Method application (2017) ... 46 Figure 12 – Timeline of the implementation of energy poverty policies in Portugal ... 49 Figure 13 – Evolution of the indicator “Inability to keep home adequately warm” in Portugal, 2007-2017 ... 51 Figure 14 – Evolution of the indicator “Energy expenses” in Portugal ... 52 Figure 15 – Evolution of the indicator “Household electricity prices” in Portugal ... 53 Figure 16 – “Household electricity prices” in 2017, EU Member States (comparation of the value with and without taxes and levies) ... 54 Figure 17 – Evolution of the indicator “Presence of leak, damp, rot” in Portugal ... 54
v
Annexes Index
Annex 1 – EPOV definition of the energy poverty indicators ... 64 Annex 2 – Dendrogram and Agglomeration graphic resulting of the Nearest Neighbour Method application (2010) ... 65 Annex 3 – Dendrogram and agglomeration graphic of the Farthest Neighbour Method application (2010) ... 66 Annex 4 – Dendrogram and agglomeration graphic resulting of the Ward’s Method application (2010) ... 68 Annex 5 – Dendrogram and agglomeration graphic resulting of the Nearest Neighbour Method application (2017) ... 69 Annex 6 – Agglomeration graphic of the Farthest Neighbour Method application (2017) . 70 Annex 7 – Agglomeration graphic of the Ward’s Method application (2017) ... 70 Annex 8 – Clusters obtained for 2007, 2010 and 2017 ... 71
1
Chapter 1. Introduction
Energy poverty is a concept that captures the problem of inadequate access to energy, involving a wide range of dimensions, such as economic, infrastructural, social equity, education and health (Bouzarovski & Petrova, 2015b). However, in light of the novelty and the wide scope of this concept, a universally accepted definition of energy poverty does not exist yet.
According to the European Union Energy Poverty Observatory (EPOV) , energy poverty is a problem across many Member States in such a way that it affected nearly 10,2% of the European Union (EU) population in 2018 (Thomson & Bouzarovski, 2018). This implies that energy poverty is estimated to affect around 54 million people in Europe, with a significant number of European citizens living without the possibility to adequately heat their homes at an affordable cost, or to pay for other essential energy services such as lighting and cooking. In fact, these are the main factors analysed when assessing the basic energy needs: energy to cook, light and heat the house (Aristondo & Onaindia, 2018a; Bouzarovski & Petrova, 2015b).
Despite its importance, the energy poverty concept has only recently started to receive a significant deal of attention both in the economics literature and in the public policy agenda. Boardman (1991) was one of the first authors to introduce this subject, almost unknown until then, suggesting a way to measure fuel poverty: a situation where households spend more than 10% of their income in fuel expenditures. Since Boardman (1991) seminal work, both fuel and energy poverty started to receive a great deal of attention in the energy literature (namely in the field of energy economics), and in the area of public policy design (Aristondo & Onaindia, 2018a).
During the past few decades, the United Kingdom and the Republic of Ireland were pioneers in this field, being the only EU countries where the existence of energy poverty was widely recognized in public debates, policies and research. Yet, in recent years, this problem of domestic energy deprivation has started to gain increasing attention throughout the EU, with households located in Eastern, Central and Southern European countries being considered particularly vulnerable (Bouzarovski, 2014).
The increasing concern with energy poverty has also raised new challenges at the EU level, namely those related to the difficulties in defining and measuring this concept. Since
2 this phenomenon involves several dimensions, the measurement of its incidence and nature is rather complex. In fact, presently, it does not exist yet a EU global definition of energy poverty. Moreover, the current European political context urges Member States to develop their own energy poverty indicators and policies (Sánchez, González, & Aja, 2018). Hence, the implementation of global EU policies is difficult at the present stage, with each Member State being in charge of implementing unilaterally its own strategies.
Accordingly, this topic is of great importance and relevance in the European context, being one of the greatest societal challenges of the developed countries, with impacts on health, economy and environment, calling for new social and energy policies (Dubois & Meier, 2016; González-Eguino, 2015).
This dissertation aims at performing a cross-country analysis on the current energy poverty policies in the EU, which is a key step towards understanding the feasibility of implementing common energy poverty policies to all the EU countries. More precisely, the present work addresses the following research questions: (i) What is the intensity of energy poverty in the EU countries and how has it been evolving during the last years? (ii) What are the main energy poverty policies in the EU?
Thus, this dissertation starts with the study of the energy poverty concept, providing a systematic and integrated analysis of the conceptual proposals made by different authors. In this context, it will also be investigated which poverty policy concept underlies each EU country public policy. In this discussion, we will give particular attention to the analysis of the relationship between different types of energy poverty concepts and the corresponding measurement options. Afterwards, we intend to measure the intensity of energy poverty in the EU at the present moment, identifying how it has evolved in recent years. Then, we will rely on statistical tools to evaluate the degree of heterogeneity within the EU Member States’ energy poverty policies, examining how the EU directives were executed at a cross-country level.
The present dissertation is structured as follows. Chapter 2 discusses the concept of energy poverty and the recent contributions from the literature in this field. Chapter 3 briefly explains the methodological approach and Chapter 4 discusses the main results of our empirical analysis. In Chapter 5, conclusions, main limitations and future research paths are presented.
3
Chapter 2. Literature Review
2.1. Energy poverty: concept and measurement
Many different researchers and institutions have been trying to define energy poverty for over more than three decades now. Although the extant literature reveals that there is some agreement on the factors that constitute a source of energy poverty problems, there is still no terminological agreement about the whole set of dimensions to be included in the energy poverty concept. Therefore, there is still no consensus on its measurement.
According to Thomson, Bouzarovski, and Snell (2017) and Ntaintasis, Mirasgedis, and Tourkolias (2019) these difficulties in the definition of the conceptual framework underlying energy poverty exist because it is an individual condition. Indeed, energy poverty determinants vary over time and space, which implies that a household that is now classified as living in an energy poverty situation can see this state changed in the future by an alteration of some explanatory factor, and vice-versa (with a household that isn’t now considered as energy poor becoming so in the future).
Hereupon, these authors defend that in the study of the energy poverty it is crucial to account for the impact of risk factors such as the access to energy, its affordability, the flexibility of energy services, energy efficiency, energy needs and energy practices1. These are also designated by Bouzarovski and Petrova (2015b) as key factors to identify the energy vulnerable households.
These authors also agree that the problem of energy poverty can be summarized to a situation where “a household experiences inadequate levels of essential energy services” (Thomson et al., 2017, p. 879) and is presumed to be the result of the combination of high energy costs, household’s low income and energy inefficient buildings. Bouzarovski and Tirado Herrero (2017) go further and point to the lack of an adequate social protection action as a factor that allowed the intensification of this problem.
These characteristics are also identified by Papada and Kaliampakos (2016), who argue that energy poverty can be described as the inability to access to an adequate level of domestic energy services. Additionally, they find out that this situation is a consequence of a set of circumstances, pointing to the continuous increase of energy demand and the resulting
1 It is possible to observe patterns of energy use at a social level in the household’s everyday routines, which
4 higher energy prices. Together with the massive austerity policies felt in some European countries, this has leaded to a constant aggravation of the energy poverty problem, especially in some of the countries that have been more affected by the financial crisis (like Portugal). On the same viewpoint, Okushima (2017) and Aristondo and Onaindia (2018b) point out that the perception of energy poverty can be divided into energy availability and energy affordability. While the first one is the main issue of developing countries and refers to the problem of inadequate access to modern types of energy, the second one denotes the difficulties of having access to a “socially and materially necessitated level of domestic energy services” (Okushima, 2017, p. 1159) and it is the focus of the energy poverty debate in developed countries.
Along this debate, there are some studies that deserve to be highlighted by their role in the understanding of this complex issue, as it is the case of Isherwood and Hancock (1979) that was the first one to assume energy poverty as a real problem, and Boardman (1991), that years later inflamed the discussion about this problem in Europe, by giving a big step to its recognition and to the identification of a measurable definition of energy poverty.
However, although it exists consensus on the major conceptualization lines around the energy poverty problem, which frequently refers to a situation where a household is not capable to social and materially satisfy the essential levels of its minimum energy services, the same doesn’t occur with respect to the energy poverty measurement, where the discussion about the method to be used remains open, as shown in the critical reviews about the different methods of estimating energy poverty that were conducted by Herrero (2017) and by Thomson et al. (2017).
The difficulties in the definition of a consensual measurement criteria to assess the extent and the intensity of energy poverty are also a consequence of the multidimensionality of the poverty concept itself, whose dimensions are often difficult to delimit and characterize (Ribeiro, Silva, & Guimarães, 2015).
Poverty is commonly recognized as a material welfare measure, where a person is considered poor if his/her economic welfare is below a certain level, which depends on the standards of each society. However, several authors have been arguing that this understanding presents some limitations since “economic welfare” must encompass not only the consumption of goods and services but also other dimensions of human development
5 such as education and health, access to work, etc. (for example, Nolan and Whelan (2012) and Lipton and Ravallion (1995)).
It is then possible to find different concepts of poverty in the literature, as the concept of absolute poverty and relative poverty. The absolute poverty measurement considers those that cannot reach a poverty line, which is fixed over time. Relative poverty uses current data to calculate the poverty threshold to be used in the identification of poor people in a certain economy (Foster, 1998). However, it is the multidimensional poverty concept that seems to have performed better at capturing the existing poverty since it includes in its calculation 10 indicators related to all the dimensions of poverty, taking into consideration factors about health, education and basic live conditions (Ribeiro et al., 2015). This way, the multidimensional concept of poverty eliminates the problems above mentioned about the use of just one single factor in the identification of poverty.2
It is often possible to see that the difficulties found in measuring energy poverty are indeed also a result of the attempts to gauge poverty itself.
Herrero (2017) presents the advantages and disadvantages of the different methods of estimation, arguing against the use of a single indicator to measure energy poverty and defending the use of a multiple indicator approach.
In its turn, Thomson et al. (2017) presents a critical analysis of the existing estimation methods, concluding that the use of different data across the EU may result in different ways to identify energy poverty situations. The author points that three main factors should be considered in the identification of the energy poor households: the household’s income, the energy bills and the energy efficiency. Moreover, the author also points that the quality of the existing data should be improved in order to make it possible to measure energy poverty at an EU scale.
In this respect, it is possible to categorize the types of methods used to measure energy poverty in three groups:
(i) the objective methods, which calculate energy poverty through the proportion of the household’s income that must be spent to afford the basic domestic energy needs;
2 This argument concerning the multidimensionality of the poverty concept will furtherly be used when
debating the use of the objective methods to measure energy poverty, since the energy poverty concept is also a multidimensional concept.
6 (ii) the subjective methods, which consider a function of the households’ situation regarding different factors associated with their available level of domestic energy services; and
(iii) the composite methods, which are a combination of the household’s expenditure approach with some other indicators.
Regarding the first group of methods, the most commonly accepted definition is based on Boardman’s (1991) contribute. According to this seminal work, the energy poverty condition arises when the households spend more than 10% of their income on energy services. The establishment of the 10% threshold was justified, at the time, because the 30% poorest households were spending more than 10% of their income on energy services. Moreover, this threshold represented the double of the average of the households’ energy services expenditures, so that, facing energy expenses above this threshold was considered to be disproportionate. When calculating the energy services expenses, the author took into consideration the hypothetical fuel needed to guarantee a minimum level of heating, lighting and cooking services (Moore, 2012).
Since its inception, this measure has been used in a lot of energy poverty investigations, such as Heindl and Schuessler (2015) and Okushima (2016).
Yet, in the literature there are also several authors that refute this measurement method, urging that the use of the 10% cut-off has some problems, since it may happen that a rich household overconsuming energy can be unduly identify as suffering from energy poverty condition (Aristondo & Onaindia, 2018a). Another point that this method doesn’t capture is the fact that households that cannot afford to pay for an adequate level of energy services may reduce so drastically their energy consumption, to a point that they are not documented as energy poor (Ntaintasis et al., 2019).
Another argument pointed against the objective approach is the fact that energy poverty is a multidimensional problem and, consequently, its measurement shouldn’t be limited to the analysis of energy costs or to the household’s expenditures. Instead, energy poverty measurement should account for all the three central aspects: energy prices, households’ income and energy buildings efficiency.
Moreover, the objective method was also criticized by Hills (2012), by the fact of being too sensitive to variations on gas and electricity bills, as the result of the rises and falls
7 of the energy prices. Alternatively, he proposed a new method, that has become known as the Low Income High Cost (LIHC), where he defined as “fuel poor” the households whose fuel expenses are above the medium level spent by all the population, and, at the same time, the remaining income lies under the official poverty line.
Given the above limitations of this method, some authors argue that the measurement of energy poverty should be done through the study of subjective variables, which would capture the minimum conditions that a household should have in order to afford its basic life needs. This way, with the subjective methods, researchers may encompass the multidimensionality of the energy poverty concept by measuring its impact on more than a single variable.
Usually the researchers who use this method to analyse energy poverty consider three main indicators to capture the lack of essential energy conditions: the ability to keep the home adequately warm, the arrears on utility bills and the presence of leaking roof, damp walls or rotten windows. Examples of the application of this method can be found in Aristondo and Onaindia (2018a), Atsalis, Mirasgedis, Tourkolias, and Diakoulaki (2016), Bouzarovski (2014), and Okushima (2016).
Thus, this methodology is based on the household’s characteristics that are considered essential to assure a decent standard of living, and without which the household may be indeed energy poor. However, even if some authors claim this method is simple and contributes to a better understanding of the aspects that surround the problem of energy poverty, this methodology has some drawbacks as it may suffer from “errors of exclusion”. In other words, it depends on the household’s self-reports about their living conditions and, consequently, it may exclude from the analysis the households that do not identify themselves as energy poor (even if they effectively are energy poor). Furthermore, this methodology also considers that all the variables have the same weight in the explanation of the energy poverty problem. This option has led to some debate in the literature, with authors defending the use of other factors to catch this impact through the adoption of an additional estimation method based on composite indicators.
The composite measure of energy poverty can be translated into a function over a set of subjective indicators, which enter with different weights in the composite indicator and which can be themselves combined with objective indicators. This method was used by
8 Bouzarovski and Tirado Herrero (2017), Nussbaumer, Bazilian, and Modi (2012) and Papada and Kaliampakos (2016).
According to some of these authors, the composite method is expected to reflect in a more precise way the energy poverty problem, as it completes the flaws of the objective method: the inclusion of supplementary indicators enables researchers to capture other energy poverty aspects that the expenditure approach may miss.
In light of the previous analysis, we may conclude that all the aforementioned methods have their advantages and disadvantages. Moreover, although in Europe the objective method is still the most widely used one, there is no generally accepted method to measure the number of households living in an energy poverty situation. On the contrary, the discussion continues to grow steadily since the energy poverty estimation method choice is of great importance, to such an extent that the choice of alternative measurement methods may lead to very different conclusions regarding the prevalence and the extent of the energy poverty condition. Indeed, as mentioned by Ntaintasis et al. (2019), just a few numbers of households are considered simultaneously energy poor by all the approaches.
The next table presents a systematic and brief overview of the literature on the concept and measurement of energy poverty.
9
Table 1 – Concept and measurement of energy poverty: a systematization Concept
The energy poverty problem refers to a situation where a household is not capable to social and materially satisfy the essential levels of its minimum energy services.
Method Measurement Limitations Advantages
Objective method (Boardman, 1991; Heindl & Schuessler, 2015; Okushima, 2016)
The energy poverty condition arises when households spend more than 10% of their income on energy services (Boardman, 1991).
It is possible that some households are unduly identified as energy poors (Aristondo & Onaindia, 2018a).
It is the most commonly accepted definition. Households that are energy poors
may not be documented as such (Ntaintasis et al., 2019).
Doesn’t respect the multidimensionality of the energy poverty problem.
It is easy to implement. It is too sensitive to variations on
gas and electricity bills (Hills, 2012). Subjective method (Aristondo & Onaindia, 2018a; Atsalis et al., 2016; Bouzarovski, 2014; Okushima, 2016) Energy poverty is a function of indicators that capture the lack of essential energy conditions.
Depends on the household’s self-reports about their living conditions.
Respects the
multidimensionality of the concept.
Considers that all the variables have the same weight in the explanation of the energy poverty problem.
Contributes to a better understanding of the aspects that surround the energy poverty problem. Composite method (Bouzarovski & Tirado Herrero, 2017; Hills, 2012; Nussbaumer et al., 2012; Papada & Kaliampakos, 2016) Energy poverty is a function over a set of subjective indicators, which enter with different weights in the composite indicator and can be themselves combined with objective indicators.
Implementation difficulties due to the large amount of data and information required to compute the composite indicator.
Reflects in a more precise way the energy poverty problem, as it completes the flaws of the objective method.
Source: author´s elaboration.
2.2. Energy poverty in the European Union
Until a few years ago, the problem of energy poverty was only publicly recognized at the United Kingdom and the Republic of Ireland, where it was in the object of debates and academic research projects. As a result, in the past few decades, there have been efforts to fight energy poverty problems in these countries, leading to the design and implementation of public policies specifically designed to combat this problem. These policies have been based on a wide range of measures, such as the financial support to the households who have difficulties to pay for their energy bills and the encouragement of the investment on the
10 energy efficiency of the houses. These actions aiming at reducing the impact and the extent of the energy poverty condition were taken not only by the government but also by charitable organizations (Bouzarovski, 2014).
For example, in the UK, it should be emphasized the pioneering strategic plan implemented in 2001, “The UK Fuel Poverty Strategy”, which establishes the implementation of an unprecedented set of policies, targets and objectives aimed at reducing the problem of fuel poverty. Among these strategic goals, the improvement of the energy efficiency and the reduction of the fuel costs stand out, as this proposal presents how the Government intends to fight the fuel poverty and how the vulnerable consumers will be identified.
In order to identify the consumers living in an energy poverty situation, The UK Fuel Poverty Strategy also announced the official implementation of the concept of fuel poverty by the United Kingdom Government, who formally started to assume as fuel poor the households who need to spend more than 10% of their income to keep a satisfactory level of energy services. This concept was a reformulation of the concept suggested by Boardman (1991). However, it tried to clarify some of the controversies pointed to this author. In particular, the use of the expression “needs to spend” relates to a hypothetical level of energy costs and not to the current expenditure. In addition, this concept considers an “acceptable level of heating” based on the standards established by the World Health Organization, that defines as recommended minimum temperatures 21ºC for the living room and 18ºC for the bedrooms (Department of Trade and Industry, 2001).
Years later, the principles of this definition were questioned by Hills (2012), who criticized its large sensitivity to variations on the prices of gas and electricity (as described on Table 1). Hills (2012) also questioned the underlying assumptions about the adequate thermic conditions for living. Hereupon, he made an alternative proposal to assess energy poverty: the LIHC which has been adopted by the government of England.
Yet, this proposal has also led to a lot of disagreement since with this way of measuring the number of households under fuel poverty condition turned out to be significantly low and, consequently, the government expenses with the supporting policies decreased in about a quarter of their initial levels (Bouzarovski, 2014).
Consequently, there has been a shift in the energy poverty concept in the United Kingdom, with energy poverty being understood as the incapacity of a household to keep home adequately warm at a reasonable cost. At the same time, in Ireland, energy poverty was
11 considered as the inability to afford an adequate level of warmth in the house, therefore accounting for the possibility that energy poverty results from the building’s energy inefficiency (Thomson & Snell, 2013).
As mentioned earlier, the steps given by these two countries towards the establishment of an official definition of the energy poverty problem were considered a pioneering achievement. Not only this has significantly contributed to include energy poverty problems within the countries’ political agenda, with new national policies being implemented to combat it, but it also opened the path to innovative research about the causes, consequences and ways to mitigate this phenomenon.
This way, the UK and Ireland for several years, stayed ahead in relation to the other European Union countries. However, over the years, the concerns about this problem have spread all over the world and some studies have been made by other EU countries in order to characterize the impact of this problem.
For example, in France, where there was also an option for setting up an official definition of this concept, energy poverty has been characterized as the difficulty to afford a satisfactory level of basic energy needs due to the lack of financial resources or due to the building’s conditions (Thomson & Snell, 2013).
Still, what really triggered a major concern about this problem in the EU was the economic and financial crisis of 2008. Among other widely discussed problems, the crisis has intensified the social inequality and it led to an exponential increase of the energy prices. Accordingly, the problem of energy poverty that already affected a considerable proportion of the population, got even worse, especially in the countries that were deeply affected by this crisis, as it is the case of the Southern European countries (Greece, Portugal and Spain) (Bouzarovski, 2014).
To illustrate these arguments, Figure 1 presents the electricity prices supported by households in the different EU countries for the years 2007, 2010 and 2016, respectively.
12
Figure 1 – Electricity prices at the EU Member States (2007, 2010 and 2016)
Source: https://www.energypoverty.eu/ (accessed on 11 January 2019). Note: These data do not consider the Purchasing
Power Parity (PPP).
In the above figure, the darker the country’s colour, the higher the electricity price is at that country. Accordingly, the figure shows that along the 2008’s crisis the electricity prices have continuously increased in most of the Member States, and this upward pricing tendency has continued at least until 2016.
Although this aggravation in the electricity prices occurred all over the EU countries, there are some situations that deserve to be highlighted, as it is the case of Germany and Denmark, that all over the years presented the highest values for the electricity price.
This indicator by its own is not explanatory of the impact of the 2008’s crisis along the EU countries since, in general, all EU countries have suffered an aggravation of the energy prices along the considered period. Hence, in order to better discriminate the situation among countries, we will also look at the household’s inability to keep their home adequately warm. As already described in the previous section, several authors such as Aristondo and Onaindia (2018b) and Sánchez, González, and Aja (2018) argue that the household’s inability to keep their home adequately warm is one of the main indicators to identify the existence of energy poverty. For example, Dubois and Meier (2016) use this indicator as a proxy to explain the energy services deprivation.
In this context, Figure 2 presents the population percentage that is unable to keep their home adequately warm for each of the EU countries, for the years of 2007, 2010 and 2016 respectively. In the maps, the darker the country’s colour, the higher the percentage of population living in this situation.
13
Figure 2 – Population unable to keep their home adequately warm at the EU Member States (2007, 2010 and 2016)
Source: https://www.energypoverty.eu/ (accessed on 11 January 2019).
Figure 2 allows us to shed some light on the intensity of the energy poverty problem across the EU countries and its evolution during the last years.
Based on the evolution of the previous indicator, where it is visible a continuous increase of electricity prices over the years for most of the EU countries, it was expected the same tendency for the present indicator, with the percentage of population unable to keep their home adequately warm increasing over the analysed period. However, this is not the case. In fact, the analysis of the maps shows that the percentage of population unable to keep their home adequately warm has generally decreased over the years, with just a few exceptions, as it is the case of Lithuania and Greece, where the level worsened throughout the years. It should also be highlighted the performance of Portugal, Latvia, Poland and Romania that presented the most remarkable improvements at this indicator, with the percentage of population living under this situation considerably decreasing.
Nevertheless, in the three years under analysis, the EU countries that had a higher percentage of population living under energy poverty were Portugal, Italy, Greece, Bulgaria, Romania, Hungary, Poland, Lithuania and Latvia. This is in line with the investigation made by Bouzarovski (2014) that concluded that the EU most affected countries are the Southern, Central, and Eastern ones.
Bouzarovski (2014) and Bouzarovski, Petrova, and Sarlamanov (2012) explains the high intensity of this problem in the Eastern EU countries as being the result of a combination of factors, as the cold climates, the high inefficiency of the buildings, the income inequalities, and the remaining problems regarding the social welfare. These problems are pointed out as the result of the change of political movements, once with the fall of
14 communism the energy prices dramatically increased in way to push up the levels of the electricity and gas tariffs, that were before indirectly subsidized by the government.
Bouzarovski (2014) also highlights the case of Bulgaria, as one of the countries that has been most affected by energy poverty. This is also evident in Figure 2, as this country is painted in black for the year of 2010, meaning that more than 60% of the population was not able to keep their home adequately warm. In 2016 the colour became just a little softer, with this problem being slightly alleviated (it was still affecting 40% to 50% of the Bulgarian population, which is a very high percentage). It is interesting to highlight that, as Figure 1 shows, energy prices in Bulgaria are relatively low when compared with the remaining EU countries. This may be due, at least partially, to the fact that the values for the household
electricity prices do not consider the Purchasing Power Standard, which means that comparing electricity prices among countries may not be adequate, since the life standards vary over the countries, even among EU Member States.
The fact that the energy prices in Bulgaria are relatively small is also pointed out by Bouzarovski (2014), who argues that the level of energy poverty verified in Bulgaria is mainly caused by the energy inefficiency of the buildings and by the poor affordability of energy services. Giving the relevance and intensity of the energy poverty problem in Bulgaria, this is particularly and intensively studied by Bouzarovski et al. (2012).
On the other side, if we look at the case of Germany, Figure 1 shows that this country has one of the highest energy prices in the EU, although its level of energy poverty is one of the lowest, which can be confirmed by looking at Figure 2. This behaviour may be justified once again by the fact that energy prices are not considering the Purchasing Power Standard. Accordingly, although the energy prices in Germany are high, their impact on the households’ budget is small, since the standard of living in Germany is quite high. This means that even with high energy prices, the relative effort of the families is smaller when compared to other countries, as Greece and Portugal, where a small increase of the electricity prices has significant impacts on household’s budget. This occurs because these are countries with a low standard of living. Bouzarovski (2014) also came to these same conclusions.
According to Dubois and Meier (2016), Greece was the most affected country by the crisis, with the energy prices rising and the household’s income decreasing, resulting in an aggravation of the energy poverty problem. Figure 1 shows this negative evolution, depicting
15 an increase of the electricity prices, whereas Figure 2 shows a significant deterioration of the population capacity to keep their home warm.
Other country that deserves special attention is Portugal. As Figure 2 shows, it presents one of the highest levels of energy poverty in the EU, which can be in part explained by the increasing electricity prices. Dubois and Meier (2016) explain this impact as the result of the household’s income stagnation during the crisis conjugated with the increase on energy prices, and the lack of conditions of the buildings that were not properly equipped.
In view of this situation, the problem of energy poverty began to be extensively discussed among EU Member States, with its definition and measurement being widely debated. Moreover, some countries included this subject into its national legislation and others are still debating it (i.e. it isn’t official yet).
The following table summarizes the country-specific definitions of energy poverty and the corresponding measurement approaches.
16
Table 2 – Energy poverty definition and measurement in some European countries Member
State Energy poverty definition Measurement (Energy poor condition) Belgium Large fraction of disposable income spent on
energy expenses. Households that spend an abnormal low level of energy services are also considered to be living in a hidden energy poverty situation.
If the proportion of the income spent on energy is more than twice the average energy spending, or the expenses are below the medium level. Cyprus Low income (as reported by tax statements),
conjugated with other characteristics (professional status, matrimonial status and health conditions) make the household unable to pay for his basic energy needs, as the needed costs represent a significant proportion of his income.
If the expenditures on energy services correspond to more than 10% of the income.
France Difficulty to have enough energy to satisfy the basic needs due to the lack of financial resources or due to the building’s conditions.
It doesn’t exist a quantitative threshold yet.
Ireland Inability to afford an adequate level of home energy services due to the incapacity to pay for them.
If the expenditures on energy services correspond to more than 10% of the income. Higher thresholds may also be considered in order to measure the severity of energy poverty problems. Slovakia Large proportion of the average disposable
income spent on energy services (electricity, gas and heat).
It doesn’t exist a quantitative threshold yet.
UK
(England) Energy expenses above the national median level, and simultaneously, the remaining income is below the poverty line.
If the income reduced of house expenses (rents, payments,…) is below 60% of the net average income. UK
(Scotland, Wales and Northern Ireland)
Spending more than 10% of the disposable income on energy services in way to afford a satisfactory heating level.
If it is spent more than 10% of the income in way to attain an acceptable level of heating, which is calculated based on the standards established by the World Health Organization. Source: author´s elaboration based on Pye et al. (2015), Rademaekers et al. (2016) and Thomson and Bouzarovski (2018).
Although the remaining Member States don’t have an official definition of energy poverty, they do take into consideration some of the dimensions of the energy poverty problems, when defining the characteristics of vulnerable consumers and identifying measures to protect them (which is mandatory in the context of the European directives, as we will see later).
Table 2 above illustrates the wide variety of energy poverty concepts (and measurement criteria) within the EU. Some authors argue that the existence of multiple definitions makes the process of energy poverty mitigation more difficult. The authors claim that it is important to promote the adoption of a common definition within the EU, pointing that this option would allow for more accurate cross-country comparisons as well as for greater transparency in the implementation of the policies in this field (Boemi & Papadopoulos, 2019).
17 Recognizing these impacts and the consequences that the energy poverty problem caused in the society, the European Commission (EC) finally assumed the need to formally define and adequately measure this condition, underlining the need to embrace this subject at the European Union (EU) level (Bouzarovski & Petrova, 2015a).
2.3. Energy Poverty Policies in the EU
The energy poverty problem was officially recognized in the European legislation in 2009 through its explicit incorporation in the “Third Energy Package” (Bouzarovski & Petrova, 2015a).
More precisely, the Directive 2009/72/CE (defining common rules for the electricity market) and the Directive 2009/73/CE (focused on the gas internal market) assumed that energy poverty was a growing problem in Europe. Hence, all Member States were demanded to take specific actions addressing this issue, by formulating measures to identify vulnerable customers and implementing adequate safeguards to protect them, ensuring a viable access of vulnerable costumers to energy sources (Bouzarovski-Buzar, 2011).
However, this process to mitigate the impact of energy poverty proved to be complicated. To start, the EU has not defined a single strategy to overcome energy poverty, leaving to each country the autonomy to choose how to identify the vulnerable consumers and how to define energy vulnerability, according to the criteria that each country considers most appropriate, instead of proposing a global definition to be used by all the EU countries. Given the circumstances, this methodology did not have the expected results, with just a few countries (France, Ireland, Slovakia and the UK) adopting an official definition of energy poverty until 2013 (European Economic and Social Committee (EESC), 2013).
In light of this situation, in 2011, the EESC expressed its concern on the level of energy poverty experienced in the EU. The EESC also alerted for the continuous growth of the prices of the energy services and for the fact that forecasts showed a continuous growth path, which could lead to a worsening of the energy poverty problem if not properly fighted. Hereupon, the EESC proposed that the EU should adopted “a common general definition of energy poverty that can then be adapted by each Member State” (European Economic and Social Committee (EESC), 2011, p. 53), and beyond this, the EESC also highlighted the importance of harmonizing the statistical sources in order to ensure their increasing consistency. More
18 precisely, it claims that the “Eurostat and Member States' statistical offices adopt homogenous statistical methods that enable them to quantify the extent of energy poverty” (European Economic and Social Committee (EESC), 2011, p. 54) in order to avoid contradictions between the European statistics and the national ones (EESC, 2011).
In 2013, the EESC reiterated its opinion, presenting statistical data which demonstrate the constant growth of: (i) the prices of energy services, (ii) the percentage of people unable to pay for their bills; and (iii) the households with limited access to energy (for all the possible reasons). Consequently, there were growing concerns about the energy poverty problem in the EU. In order to promote further consistency among different EU countries, the EESC underlined the need to recommend at least common indicators. To this end, the EESC proposed the creation of a European Union Energy Poverty Observatory aiming at “help define European energy poverty indicators (in conjunction with Eurostat), make an inventory of the situation, identify best practices and draw up recommendations for preventing and addressing the problem more effectively” (European Economic and Social Committee (EESC), 2013, p. 23).
The European Union Energy Poverty Observatory (EPOV) was then created in 2013. This organization is a European Commission initiative created not only with the above cited objectives, but also to help the EU countries to address the energy poverty difficulties by improving the conditions for an informed decision-making process when countries try to design effective policies to overcome their energy poverty problems.
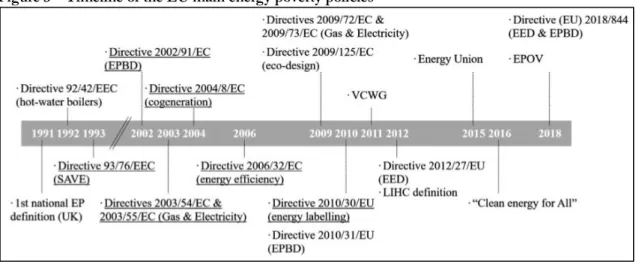
Figure 3 summarizes some of the most important marks on the EU conjuncture concerning the topic of Energy Poverty.
Figure 3 – Timeline of the EU main energy poverty policies
19 Additionally, the following sub-chapters exposes how the Member States executed the actions demanded by the above-mentioned Directives: the criteria each one used to identify the vulnerable consumers and the measures implemented to protect them.
2.3.1. Vulnerable Consumers Identification
Several criteria were used by the different countries to identify the vulnerable consumers. Thomson and Bouzarovski (2018) identify four main categories that have been taken into consideration when assessing who are the vulnerable consumers:
• Energy affordability - the households are classified as vulnerable according to their expenditures or to their difficulties in paying to cover their basic energy needs. This definition is used by France, Italy and Sweden.
• Participation in social benefit programmes - the vulnerable households are those who receive any type of social assistance. This definition is used by Bulgaria, Cyprus, Germany, Denmark, Estonia, Finland, Croatia, Hungary, Lithuania, Malta, Poland, Portugal and Slovenia.
• Health’s status - the existence of disabilities or health problems is considered as the key driver for consumers’ vulnerability condition. This definition is used by Czech Republic, Netherlands, Slovakia and Ireland.
• Variety of socioeconomic aspects - accounts for several characteristics as the household’s income, age and health situation. This definition is used by Austria, Belgium, Spain, Greece, Romania and United Kingdom.
As required by the Directives identified above, all Member States have defined their own concept of vulnerable consumer, whether explicitly (as the countries above listed) or implicitly (as in the case of Finland and Luxembourg that don’t have a specific terminology to define vulnerable consumer, although they also take actions to protect them). In fact, in Luxembourg all the consumers are considered as potentially vulnerable, and in Finland the vulnerable consumers are protected based on the legislation concerning the basic rights of living and based on the social security legislation (Pye et al., 2015).
The different identification of vulnerable consumers allows each country to delimit and implement the vulnerable consumer protection measures that each one considers more
20 adequate, accounting for the consumer characteristics that each country considers most important and worrying. Therefore, while some countries consider that the household’s vulnerability is related with their social context, and so their protection must be made through the implementation of social protection policies, others consider that this situation is the result of energy accessibility failures, and so the way to protect the consumers is through the implementation of energy policies.
2.3.2. Measures taken to Protect the Vulnerable Consumers
According to the Vulnerable Consumer Working Group (VCWG) (2013), the measures (instruments and practices) taken by each country to protect the vulnerable consumers can be grouped in five main categories, divided into measures that affect directly the households and others that have indirect implications. Here, the following elements are considered: (i) energy efficiency promotion; (ii) financial support measures; (iii) additional protection measures; (iv) initiatives to guarantee consumers’ empowerment through better information; and (v) incentives to promote more transparency and information sharing between the stakeholders (in order to better identify the vulnerable consumers and support them). In what follows, each of these aspects will be separately analysed.
(i) Energy Efficiency
One of the main causes of energy poverty is the buildings’ energy inefficiency, which results from the inadequate heating systems and the bad quality of the house stock. The measures adopted in order to mitigate this situation include actions such as: set higher standards and harder buildings regulation (in order to improve the building stock quality), and the attribution of subsidies for investments on houses energy efficiency (VCWG, 2013). Additionally, in some Member States, the social houses provided by the social assistance to the low-income families are equipped in way to guarantee energy efficiency, which is an important step to avoid the energy poverty problem between those vulnerable consumers (Thomson & Bouzarovski, 2018).
Measures to improve the energy efficiency are the most effective measures to address the energy poverty problem in the long term (Omic, 2019). In Table 3 the actions taken by
21 the EU countries to improve the energy efficiency of the vulnerable consumers’ buildings are summarized.
Table 3 – Measures by Member States to improve the energy efficiency of the buildings
Measures Country Specification
Incentives to improve the houses’ energy efficiency Austria; Croatia; Greece; Lithuania; Portugal; Spain
Energy efficiency subsidies.
France; Italy Reduction of taxes for investments on energy savings.
UK The energy supplier has the obligation of improve the energy efficiency to domestic consumers.
Consumers’
assistance Belgium Energy tutors to help consumers take better energy decisions and free energy checks. Standards and
regulations Austria Obligation to have an energy performance certificate for the building. France The landlords become in charge of investing in the energy
efficiency of their buildings.
UK Subsidies to help landlords improve the energy savings of their buildings, and prohibition of renting buildings whose level of EPC (Energy Performance Certificate) is below rating E. Social houses Germany; France;
Italy; Poland; UK The social houses attributed to the low-income families have to be energy efficient. Source: author´s elaboration based on EPOV; Pye et al. (2015); VCWG (2013).
(ii) Financial Support
Around 40% of the Member States use financial support measures to protect the vulnerable consumers through social policies. This happens because, for many Member States, the attribution of a financial support is itself a way to identify the vulnerable consumers and to be able to provide them additional support. In fact, this kind of interventions are focused on households, whose energy costs represent a high percentage of their disposable income, receiving a monetary support to alleviate their financial efforts. This support can also be given to low income households, pensioners or unemployed individuals (Pye et al., 2015).
Other types of social policies that many Member States use are the social tariffs, which aim at guaranteeing the access to the energy services at a fair price. An example of its application is the implementation of progressive tariffs on energy bills, where households with higher energy consumptions pay a higher tariff (Dobbins, Nerini, & Pye, 2016).
However, for several reasons, in the last years, the social tariffs measures have raised some debate in the countries that adopted the. Example of that disagreement occurs in Belgium, where a household that has at least one member classified as vulnerable is eligible to receive a social tariff on gas and electricity, raising questions about the efficiency and
22 fairness of this type of financial interventions. Similarly, this kind of measure was also not very well accepted in Croatia, where progressive tariffs on electricity were implemented. As the vulnerable consumers, in some cases, were those that consume higher levels of energy due to the weak conditions of building or the lack of energy efficiency of their energy tools, this measure has contributed to an aggravation of their situation, by increasing their energy bills (instead of protecting them) (Pye et al., 2015).
In view of these undesirable results, alternatively, for example, the UK opted, for providing fuel payments in the winter to the oldest people (considered as vulnerable consumers). Some countries have also opted to provide some payment facilities to the households with difficulties to pay for their energy bills (see Table 4). For example, consumers living in vulnerable situations may not be charged with interest on late bills payments. They may also benefit from the renegotiation of better payment plans, which take into consideration their ability to pay. In this context, some countries have financial support mechanisms based on direct payments to the energy providers (who receive the monetary support assigned to consumers that are not able to pay for their energy bills). These mechanisms assure that the monetary support doesn’t go directly to the consumers’ hand, with the guarantee that it has the intended use (Vulnerable Consumer Working Group (VCWG), 2013).
Although these financial supporting measures were used by several Member States, it should be highlighted that they don’t provide a long-term solution for the energy poverty problem. Thus, several other measures have been proposed in order to mitigate the energy poverty problem (Thomson & Bouzarovski, 2018).
The measures taken by each Member State in what regards the vulnerable consumer’s financial support are presented in Table 4.
23
Table 4 – Financial Support Measures in the EU
Measures Country Specification
Social policies Austria Electricity Assistance Fund
Belgium Household’s support to compare energy providers’ contracts. Denmark; Malta;
Sweden; UK Energy costs subsidies (directly assigned by the social security systems) Social tariffs Belgium; Romania All households freely receive a certain amount of electricity and
gas. Belgium; Bulgaria; Croatia; Cyprus; France; Italy; Greece; Portugal; Romania; Spain
Social tariff on Electricity and Gas.
Hungary Families with three or more children have a discount on gas prices.
Energy Payment
Facilities UK Energy suppliers need to provide a range of payment methods for the consumers, and their repayment plans, taking into consideration the household ability to pay.
Greece; Hungary Vulnerable consumers have special payment plans for their energy bills (e.g. special conditions for equipment installation).
Source: author´s elaboration based on Dobbins et al. (2016); Pye et al. (2015); VCWG (2013).
(iii) Additional Protection
All the vulnerable consumers need legislative protection since there are dysfunctional markets or markets with low levels of competition; weak contractual policies and practices, particularly regarding debts and pre-contractual agreements; and insufficient payment method choices (Vulnerable Consumer Working Group (VCWG), 2013).
In relation to the problems that may surge with contracts, some countries adopted measures in order to regulate them, with suppliers signing up good conduct codes against unfair practices (Dobbins et al., 2016). Still, these measures may not be enough to protect some consumers, who may need additional protection, as it is the case of the older people and the individuals with health problems or disabilities. Taking this in consideration, some countries adopted extra protection measures to protect these consumers, as it is explicit in Table 5.
These measures are not only enforced by the government but also by the regulatory agencies. In this context disconnection safeguards have been a priority (Pye et al., 2015). The latter are indeed essential as they guarantee the non-disconnection of the energy services for the vulnerable consumers in critical times, as in winter, or in case of consumers whose life depends on energy equipment’s (Dobbins et al., 2016).
24
Table 5 – Additional Protection Measures
Measures Country Specification
Additional
protection Austria Belgium; France; Electricity Assistance Fund Greece; Portugal;
UK
Free independent energy mediator between consumers and companies.
UK Free services as security checks. Contracts
Regulation Belgium; Ireland; Italy; Luxembourg; Netherlands; Sweden; UK
Code of good conduct.
Netherlands Agreement between the energy suppliers and debt organizations. Disconnection
safeguards France; Hungary; Italy; Portugal In case of debts, the supplier has a minimum period to notify the consumer before disconnecting the service. Hungary Non-interruptible electricity supply for disable consumers whose
life depends on electric equipment.
Netherlands; UK Protection for disconnection in winter (for the vulnerable consumers).
Source: author´s elaboration based on Pye et al. (2015); VCWG (2013).
(iv) Information provision
In some countries the consumers themselves need to identify their living situation as vulnerable to receive the benefits entitled to vulnerable consumers, whereby they need to be aware if their living circumstances qualify them as such. Thus, measures to increase consumers’ awareness about their rights and duties about this issue should be implemented (Kyprianou et al., 2019). This may be particularly important since the vulnerable consumers are even more exposed to this problem: they are more affected as they may not have enough capacities to make the most appropriate choices when they sign up energy services contracts. Moreover, this problem tends to be exacerbated by the lack of appropriate access to the media, namely to the Internet.
Although the government may also play a role in this matter, facilitating consumers’ access to free advice help, the key role in this subject has mainly be attributed to the energy suppliers (as they are in direct contact with the consumers). In this regard, some Member States have taken steps to ensure a great transparency and simplicity on the bills composition to make the consumers more aware of their energy spending’s and to allow them to consciously decide if they should switch service provider. In particular, the suppliers agreed to clearly inform the consumers about all the essential points of the contract, which represents a great support to the most vulnerable consumers. Also with this objective, there are countries that provide to consumers mechanisms that enable them to compare prices
25 and, thus, find the most appropriated tariff for their consumption profiles. These tools also intensify market competition (Pye et al., 2015).
Also for this purpose, the EU legislation is creating a “single point of contact” to support the consumers in need to clarify doubts related to their energy consumption choices (Vulnerable Consumer Working Group (VCWG), 2013).
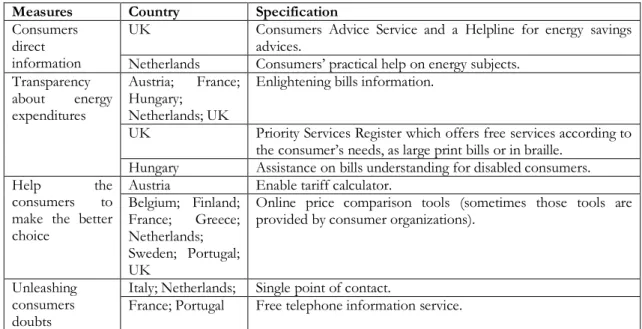
Table 6 – Consumers Information Measures
Measures Country Specification
Consumers direct information
UK Consumers Advice Service and a Helpline for energy savings advices.
Netherlands Consumers’ practical help on energy subjects. Transparency about energy expenditures Austria; France; Hungary; Netherlands; UK
Enlightening bills information.
UK Priority Services Register which offers free services according to the consumer’s needs, as large print bills or in braille.
Hungary Assistance on bills understanding for disabled consumers.
Help the
consumers to make the better choice
Austria Enable tariff calculator. Belgium; Finland;
France; Greece; Netherlands; Sweden; Portugal; UK
Online price comparison tools (sometimes those tools are provided by consumer organizations).
Unleashing consumers doubts
Italy; Netherlands; Single point of contact.
France; Portugal Free telephone information service. Source: author´s elaboration based on Pye et al. (2015); VCWG (2013).
(v) Information sharing between stakeholders
The sharing of consumers’ information among suppliers can be useful since it allows everyone to keep the information about vulnerable consumers updated. Likewise, the data sharing between energy providers and the National Regulatory Authorities also allows for the monitoring of prices and bills’ components, as well as the supplier’s practices.
Table 7 – Information sharing
Measures Country Specification
Information
sharing UK Portugal Available gas and electricity supply market indicators. Suppliers’ information is shared with the National Regulatory Authority.
26
Chapter 3. Methodology
The objectives of our empirical study are two-folded. First, we intend to group the European countries in what concerns their current and past energy poverty condition. Then, we want to ascertain to which extend energy poverty public policies may effectively change countries’ energy poverty conditions.
To this end, the empirical part of this dissertation will rely on a two-step methodology. First, we will develop a cluster analysis using the EPOV indicators (to investigate how EU countries may be grouped in terms of their energy poverty conditions). Second, we will look at the Portuguese case study, using the EPOV indicators for this country to evaluate to which extend energy poverty policies may have affected the country’s condition in this matter.
As explained in the previous chapter about the energy poverty policies in the EU, the EPOV suggests some energy poverty indicators that should be considered by the EU Member States in their assessment of the extent and the intensity of energy poverty. Accordingly, the methodology used in this work to characterize the EU situation regarding the energy poverty problem is based on the indicators suggested by the EPOV.
We will start our analysis by looking at how the groups of the EU-countries and their indicators have evolved over the years, in order to understand if they have changed as a result of the energy poverty policies implemented by each Member State, as demanded by the Directives 2009/72/CE and 2009/73/CE. To this end, three different years will be considered: 2007, 2010 and 2017. The first year will enable us to analyse how the countries were clustered before the above-mentioned Directives were implemented in the European Legislation, the second one will allow us to verify if there were any short-run changes after the introduction of the Directives, and the last one is the most recent year with available information. Hereupon, this analysis will allow us to split the EU countries into groups of similar countries. The analysis will be done for the EU- 27, with Croatia being excluded because the country did not belong to the EU before 2013.
In the second step, based on the EPOV´s energy poverty indicators, it will be examined their evolution over the years for the particular case of Portugal, aiming to analyse if the implementation or alteration of energy poverty policies in the country has led to variations on the performance of the indicators.
27 In what concerns the first step of our methodological approach, as mentioned earlier, the present dissertation will rely on a cluster analysis since this technique enables us to represent how the energy poverty problems in the EU may differently affect different groups of countries. This method has the advantage of allowing us to endogenously aggregate the Member States into groups of countries that have similar characteristics In other words, the use of clustering techniques allow us to endogenously group the countries that according to the EPOV ‘s indicators have a similar level of energy poverty.
In the context of our cluster analysis, we intend to create clusters through the examination of previously defined variables, relying on the hierarchical method. In this process, the variables are ascendingly grouped into a cluster until a matrix of similarities is created, where each element of the matrix describes the degree of similarity between each two cases (in our study, each two countries), based on the chosen variables.3
This way, with the hierarchical cluster analysis, a graphic representation will be obtained – a dendrogram. This corresponds to a tree diagram that represents the similarity between the cases for each of the variables under analysis.
The similarity measure that will be used here to group the similar cases is the “Square of the Euclidean Distance”, which expresses the similarity between two variables as a function of the square of the distance between two points, thereby assuming that the smaller is the distance between the points, the greater is the similarity between them with respect to the variable under analysis. In light of this, the hierarchical method will group the pairs of points that are closest to each other (according to the Euclidean distance between them), and replace them with a new point located at half the distance between them. This procedure will be repeated until all points are grouped into a single point (Neto & Moita, 1998; Raftery & Fraley, 1998).
In this analysis, beyond the similarity measure, it is also necessary to define the aggregation criteria that will be used in the construction of the similarity dendrogram. In this respect, there is no optimal method to adopt, with Marôco (2011) suggesting that it should be used more than just one method in the analysis for the sake of robustness. Thus, we will follow Raftery and Fraley (1998), using the three most commonly adopted criteria in the literature:
3 (Raftery & Fraley, 1998)