A Systematic Comparison of Spatial Search
Strategies for Open Government Datasets
A Systematic Comparison of Spatial
Search Strategies for Open Government
Datasets
Desertation Supervised by: Dr. Auriol Degbelo
Institute for Geoinformatics (IFGI), Westf¨alische Wilhelms-Universit¨at,
Muenster, Germany.
Desertation Co-Supervised by: Dr. Roberto Henriques
NOVA Information Management School, Universidade Nova de Lisboa, Lisbon,
Portugal
Dr. Sven Casteleyn
Institute of New Imaging Technologies, Universitat Jaume I,
Castell´on, Spain
Declaration of Authorship
I, Brhane Bahrishum Teka student of the Erasmus Mundus Master of Science in Geospatial Technologies program declare and certify that the thesis entitled A Sys-tematic Comparison of Spatial Search Strategies in Open Government Datasets is entirely the result of my own work guided by my supervisors.
All content in my thesis for which other sources, including electronic media, have been used have been acknowledged and cited.
I understand that my thesis will be checked and acknowledge that it will be rejected in case of plagiarism.
Signature:
Date:
Acknowledgements
First and foremost, I am very grateful to the European Union/Erasmus Mundus Program for offering me the scholarship to conduct my studies.
Secondly, I would like to express my profound gratitude to my supervisor Dr. Auriol Degbelo for his continuous support, encouragement, and criticism from the beginning until the end of my Masters thesis. Without his guidance and supervision, this work would not have been possible.
I am also very grateful for my co-supervisors Dr. Sven Casteleyn and Dr. Roberto Henriques for their support and feedback in my thesis. Additionally, I would like to express my gratitude to all my teachers and staff in UJI, and Ifgi for the lifelong lessons throughout the masters.
Last but not least, I also thank all the participants of my study for their time and help in the study.
Abstract
Datasets produced or collected by governments are being made publicly available for re-use. Open government data portals help realize such reuse by providing list of datasets and links to access those datasets. This ensures that users can search, inspect and use the data easily.
With the rapidly increasing size of datasets in open government data portals, just like it is the case with the web, finding relevant datasets with a query of few keywords is a challenge. Furthermore, those data portals not only consist of textual information but also georeferenced data that needs to be searched properly. Currently, most popular open government data portals like the data.gov.uk and data.gov.ie lack the support for simultaneous thematic and spatial search. Moreover, the use of query expansion hasn’t also been studied in open government datasets.
In this study we have assessed different spatial search strategies and query ex-pansions’ performance and impact on user relevance judgment. To evaluate those strategies we harvested machine readable spatial datasets and their metadata from three English based open government data portals, performed metadata enhancement, developed a prototype and performed theoretical and user evaluation.
According to the results from the evaluations keyword based search strategy re-turned limited number of results but the highest relevance rating. In the other hand aggregated spatial and thematic search improved the number of results of the baseline keyword based strategy with a 1 second increase in response time and but decreased relevance rating. Moreover, strategies based on WordNet Synonyms query expansion exhibited the highest relevance rated first seven results than all other strategies except the keyword based baseline strategy in three out of the four query terms.
Regarding the use of Hausdorff distance and area of overlap, since documents were returned as results only if they overlap with the query, the number of results returned were the same in both spatial similarities. But strategies using Hausdorff distance were of higher relevance rating and average mean than area of overlap based strategies in three of the four queries.
In conclusion, while the spatial search strategies assessed in this study can be used to improve the existing keyword based OGDs search approaches, we recommend OGD developers to also consider using WordNet Synonyms based query expansion and hausdorff distance as a way of improving relevant spatial data discovery in open government datasets using few keywords and tolerable response time.
Acronyms
OGD Open Government Data
CKAN Comprehensive Knowledge Archive Network
AO Area of Overlap
HD Hausdorff Distance
QE Query Expansion
GIR Geographic Information Retrieval
IR Information Retrieval
NGO Non-Governmental Organizations URL Universal Resource Locator RDF Resource Description Framework API Application Programming Interface
CSV Comman Separated Values
JSON JavaScript Object Notation SDI Spatial Data Infrastructure
MBB Minimum Bounding Box
Keywords
Open Government Data, Spatial Search, Relevance Judgment, Geographic Informa-tion Retrieval, Query Expansion
List of Figures
1 ConceptNet Structure . . . 8
2 Relevance Judgment . . . 9
3 Strategies. . . 11
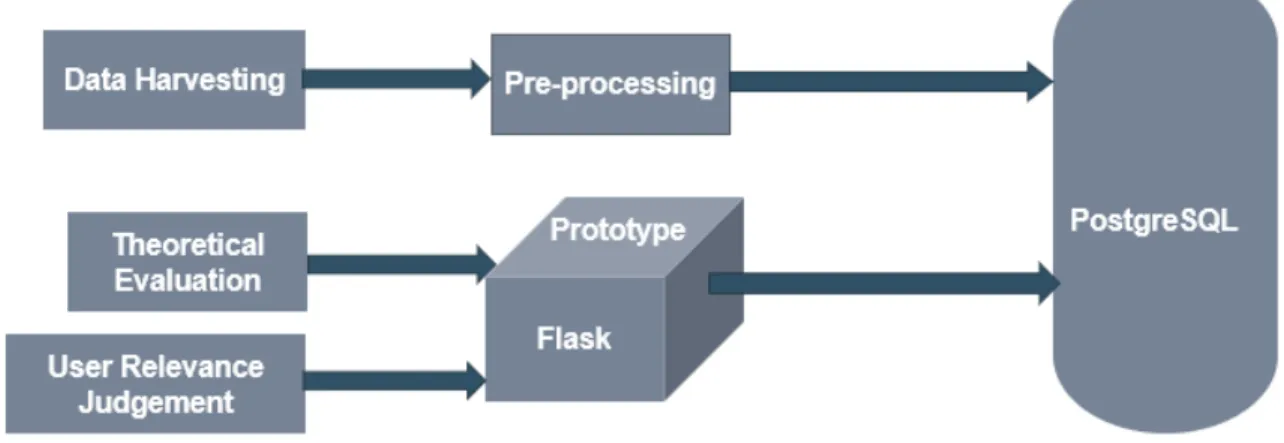
4 Methodology. . . 12
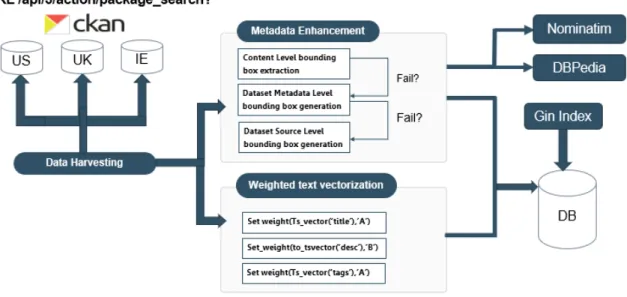
5 Data Harvesting and Preprocessing. . . 13
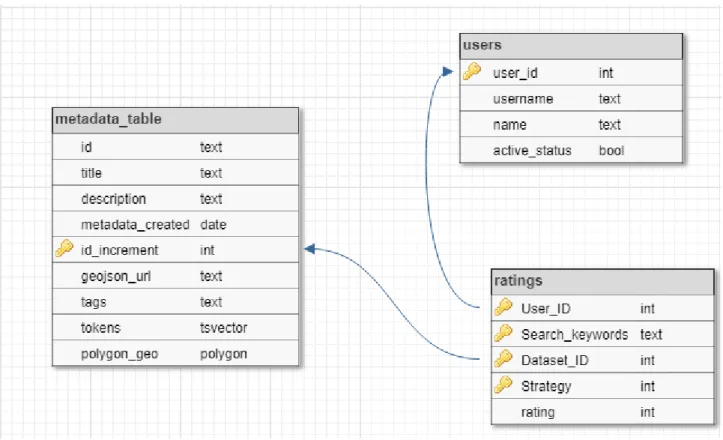
6 Database Schema.. . . 15
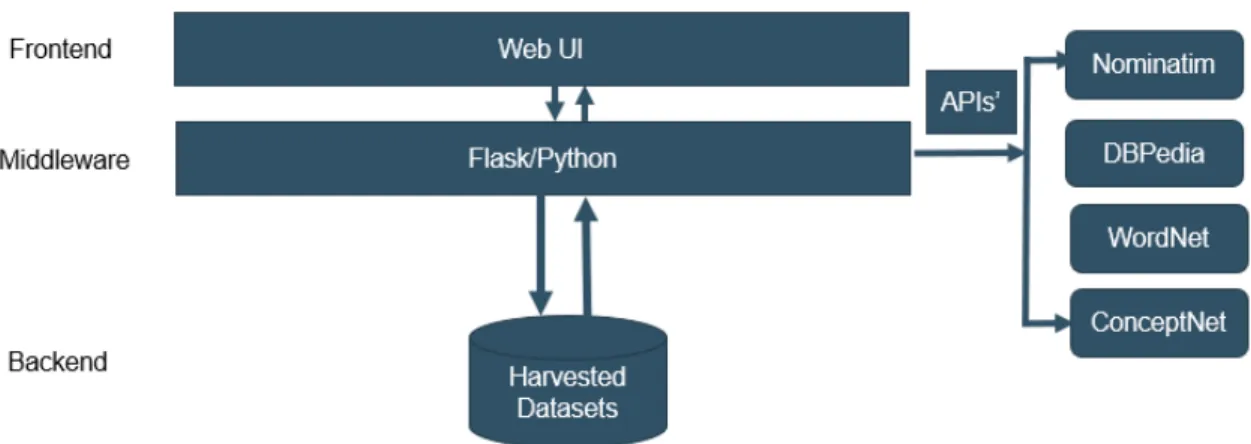
7 High Level System Architecture. . . 16
8 Prototype User Interface. . . 21
9 Example Query and Result. . . 22
10 Performance in Seconds and Number of Results of Query Population England . . . 24
11 Performance in Seconds and Number of results for Query Transport Fairfax . . . 25
12 Performance in Seconds and Number of Results for Query Communities Republic of Ireland . . . 26
13 Performance in Seconds and Number of results for Query Learning Wales 27 14 Results from existing data portals . . . 29
15 User relevance ratings for results of query “Population England” . . . 31
16 User relevance ratings for results of query “Learning Wales” . . . 32
17 User relevance ratings for results of query “Learning Wales” . . . 33
18 User relevance ratings for results of query “Communities Republic of Ireland” . . . 34 19 Participants Gender. . . G 20 Participants open data use . . . G 21 Number of datasets(results) rated by user in a minute . . . H 22 Participants feedback about the difficulty of relevance Judgment . . . H 23 Further feedback from participants . . . I
List of Tables
1 WordNet Query Expansion Weights . . . 18 2 ConceptNet Query Expansion Weights . . . 18
List of Equations
1 Greg Janee’s and James Frews Area of overlap . . . 19
2 Greg Janee’s and James Frews Hausdorff Distance . . . 19
3 PostgreSQL Thematic Ranking . . . 20
Contents
Declaration of Authorship I Acknowledgements II Abstract III Acronyms IV List of Figures V 1 Introduction 11.1 Background and Problem Statement . . . 1
1.2 Research Question . . . 2
1.3 Aim and Objectives . . . 2
1.3.1 Aim . . . 2
1.3.2 Objectives . . . 2
2 Related work and Theoretical Framework 3 2.1 Open Government Data (OGD) . . . 3
2.1.1 Linked Open Government Data(LOGD) . . . 3
2.1.2 OGD Spatial Information Retrieval and Related Works . . . 4
2.1.3 Open Government Data Portal Platforms . . . 5
2.2 Spatial Similarity Functions. . . 6
2.3 Query Expansion. . . 7
2.3.1 WordNet . . . 7
2.3.2 ConceptNet . . . 8
2.4 Relevancy Ranking and Relevance Judgment . . . 9
3 Research Methodology 11 3.1 Strategies Overview . . . 11
3.2 Overall Methodology Architecture . . . 12
3.3 Data Harvesting and Preprocessing . . . 13
3.4 Database Schema . . . 14
3.5 Prototype, and Business Logic . . . 15
3.5.1 Prototype . . . 15
3.5.2 Business Logic. . . 16
3.6 Evaluation Setup. . . 21
3.6.1 Experimental Setup. . . 21
3.6.2 User Interface . . . 21
4 Evaluations and Results 23 4.1 Theoretical evaluation . . . 23
4.2 Results from theoretical evaluation and discussion . . . 24
4.4 User Relevance Judgment . . . 30 4.5 Results from user relevance judgment . . . 31
5 Results Interpretation and Discussion 35
6 Conclusion, Limitations and Future Works 36
6.1 Conclusion . . . 36 6.2 Limitations and Future works . . . 37
Bibliography A
Appendices E
A Appendix Google Form E
B Appendix - Participants demographics and feedback G B.1 Participants demographics . . . G B.2 Number of Results Rated by a user in a minute . . . H B.3 Users feedback about difficulty of relevance rating . . . H B.4 Open Feed back from users . . . I
1
Introduction
1.1
Background and Problem Statement
Ever since Barack Obama’s announcement for “unprecedented level of openness in government” to promote efficiency and effectiveness in government, the world-wide open data movement has increased dramatically [Whitehouse.gov, 2015]. Showcas-ing the rise in awareness internationally the Open Data Soft, aggregated a list of more than 2600 open data portals around the world in their open data inception project. Such rapid increase in awareness of transparency of government operations has in turn increased the size of datasets being published. The US dataset
cata-log, Data.gov, a result of the aforementioned announcement had as of the writing of
this report more than 300,000 datasets published by 165 Agencies/Subagencies and 758 Publishers [Data.gov, 2018]. Another popular open data portal, the European
data portal, consists of more than 880000 datasets when writing this report. Those
datasets are published by public institutions by providing metadata describing each dataset and included resources. Such open government data portals, therefore, facil-itate the retrieval and use/re-use of those datasets by providing lists of datasets and links to access those datasets [Huijboom and Van Den Broek, 2011].
With such an exponential rise in datasets published in open government data portals, just like it is the case with the web, the capability of finding relevant datasets easily is of higher significance.
In an attempt to improve the challenge of information retrieval on the web, the web information growth has been accompanied by query expansion approaches that expand query with terms of similar importance to extract as many relevant search results as possible [Pal et al.,2013]. Query expansion is needed first due to uncertainty of users about what they are specifically looking for until they see them. Second, even if they know, they aren’t certain how to formulate the query. Third, user’s also have challenge of expressing their query in few keywords given the average size of a users web search size is 2.4 words [Jansen et al., 2001]. Fourth, these short keywords can have several meaning and therefore return different results from the user’s focus [Azad and Deepak,2017]. But while enhancing the chance of retrieving more relevant information, it also greatly affects precision or even response time [Azad and Deepak,
2017]. Therefore, the use of query expansion needs to be evaluated both based on loss on performance and relevant information retrieval gain.
Regarding to the use of query expansion in open government data, however, data.gov.uk and others haven’t yet utilized ontologies for query expansion [Lacasta et al., 2017].
Moreover, open government data portals not only consist of thematic datasets but also georeferenced data that needs to be searched properly.
Most open government data portals in general, CKAN based data portals like
box based spatial search. Nonetheless, queries in the UK data portal cannot include textual and spatial features simultaneously [Lacasta et al.,2017].
Different studies have been done in open government data regarding efficient data access and reuse mainly focusing on linked open government data (LOGD) [ Shad-bolt et al., 2012]. Meanwhile, [de Fernandes Vasconcelos et al., 2017] implemented spatial search at the resource level to improve recall and precision but without due consideration to thematic queries. But, we weren’t able to find more studies in the integration of spatial and thematic queries nor studies about query expansion in open government data.
Therefore, in an attempt to address this research gap, we have assessed different spatial search strategies and query expansions’ performance both in terms of time, number of results and user relevance judgment in this work.
The rest of this paper discusses the related works and theoretical frameworks used in this study in Section 2, the research methodology in Section 3, the evaluation and results from the evaluations in Section 4, Results interpretation and discussion in Section 5, and Conclusion, limitation and future works in Section 6.
1.2
Research Question
What is the impact of different spatial search strategies on performance(time and number of results) and user relevance Judgment?
1.3
Aim and Objectives
1.3.1 Aim
To assess different spatial search strategies and query expansion’s performance(both in terms of time and number of results) and impact of those strategies on user relevance judgment
1.3.2 Objectives
• Assess the performance of different search strategies with or without query expansion in open government datasets
• Assess the performance of different spatial search strategies in open government datasets
2
Related work and Theoretical Framework
In this section we will discuss the related works and the theoretical frameworks’ this study covers.
2.1
Open Government Data (OGD)
With the emergence of open government data portals around the world in the last decade, open government data have attracted the attention of researchers as a hot area of research topic. As a result various works have attempted to address open government data from different directions including but not limited to OGD man-agement, policies, legal issues, usage and values perspectives in the field of social sciences to OGD infrastructure and interoperability, cleaning, quality assessment, vi-sualization, linking, publishing, mining, rating and feedback methods in the field of information sciences [Charalabidis et al., 2016]. As the main focus of this research is on data discovery, we have reviewed current attempts on linked open government data, OGD spatial information retrieval, OGD platforms and working principles, and other theoretical foundations of this work.
2.1.1 Linked Open Government Data(LOGD)
Despite government’s reduced cost of providing data to consumers thanks to open government data portals instead of reports and applications, making OGD datasets available as raw datasets has made the human workload of making them machine understandable bigger. The need for effective infrastructure therefore rises from this need of distributing this workload and facilitate easier use of government data by the community of users and developers [Ding et al., 2011].
The prominent semantic web 1 and linked data 2 based linked open government data (LOGD) [Ding et al., 2010] overcomes these provision, reuse and integration limitations by exposing OGD as incrementally interlinked datasets to the public via RDF(Resource Description Framework) and SPARQL3 endpoints. This allows users and developers to access linked data in JSON and XML and easily build applications that make use of LOGD.
With those goals in mind, [Ding et al., 2011] developed a Semantic Web-based
LOGD Portalto facilitate the usage of LOGD, increase the reuse of data and thereby
serve the growing international community of open government data. This work has been used as a base for data.gov by converting the datasets in data.gov into RDF
1The Semantic web is a web of any possible data provided by RDF as a foundation for data publishing and linking.
2Linked data is a method of publishing structured data using ontologies likeschema.orgso that they are interlinked and machine readable [Berners-lee,2009].
and then again back to data.gov to enable users easier discovery of open data and relationships between these data.
[Rozell et al., 2012] in the other hand developed an International Open Govern-ment Data Search system that performs information retrieval on a catalog of open governement datasets aggregated from 43 countries government represented as RDF triples and solves queries using SPARQL. It allows users to filter datasets by keyword terms from titles and descriptions, source catalogs, countries of origin, category tags and so on.
2.1.2 OGD Spatial Information Retrieval and Related Works
Although the LOD works are relevant regarding open government data portal, data reuse, and give insight into the goal and research focus of OGD, they do not solve spatial information retrieval research issue approached by this work.
More related to our work, [de Fernandes Vasconcelos et al., 2017] proposed to improve spatial queries in open government data portal concerning the resolution of queries by performing spatial similarity of area of overlap based on bounding box and ranking at resource level and therefore improve low recall and precision of queries. They achieved this by performing an iteration of bounding box metadata genera-tion, spatial similarity of area of overlap between query bounding box and document bounding box, spatial relevance function and spatial ranking defined as a weighted sum of both the spatial similarity function and spatial relevance function. They then performed evaluation of spatial queries and harvested datasets from OGD Brazil using CKAN API and stated to have improved the accuracy of results.
But their work only considers spatial search without due consideration to thematic queries which we incorporated in this work.
Another set of works reviewed which are mainly about spatial data infrastructures or geospatial catalogs based on metadata but were of interest for our work include [Chen et al.,2018,Lacasta et al., 2017, Jiang et al.,2018, ,Corti et al., 2018].
[Lacasta et al.,2017] proposed an information retrieval method for geospatial data resources to solve the discovery of related geospatial resources divided into indepen-dent resources with different spatial and thematic metadata so that it takes all the metadata records of resources that partially fulfill a query (intersect the bounding box or the themes) and finds the spatial and thematic relations between them to generate sets of metadata records that are a better answer to the query than each one individually. For example, while looking datasets about highways in spain, the results “highways in south spain” and “highways in north spain” are partially match-ing results. But an aggregate of those results matches the query result better. Even though, their work is not exclusively for open government data, it was of interest for our research work for three reasons. In their implementation they used Hausdorff distance as a way of result ranking which they deemed as appropriate for ordering geometries of different size like country vs region. They also reported their inability
to perform simultaneous spatial and thematic search in data.gov.uk. Third, they pointed out the absence of ontologies for query expansion in such data portals. Those directions were also considered in our systematic comparisons.
In another geographic information retrieval and ranking in spatial data infras-tructures related work, [Chen et al., 2018], proposed using artificial neural networks to learn from knowledge of experts to integrate the characteristics of geospatial data to overall similarity. Among the similarities integrated, one is thematic similarity in which they used WordNet similarity methods. They stated to have achieved a higher precision interms of similarity computation of geospatial data but pointed out the availability of limited geoscience related vocabularies in WordNet and the need for continuous similarity results. The use of advanced knowledge base that improves WordNet and Hausdorff distance for continuous similarity results has, therefore, been motivated from this work.
Meanwhile, [Jiang et al., 2018]’s conducted two studies which are also in spatial data infrastructure. They first developed a system that improved search experience with Oceanographic Data by utilizing data relevancy from user behavior using seman-tic query expansion and machine learning based ranking to assist users in finding more relevant data. In addition, they, [Jiang et al., 2018] also attempted to incorporate users’ multidimensional preferences by identifying spatial similarity and metadata at-tributes and thereby improve the optimal user experience by using a machine learning based discovery and ranking of relevant datasets.
Those relevant works about geospatial data infratructures, advanced as they might be regarding OGD and spatial information retrieval, have been used as the main direction for the strategies being compared in this work.
2.1.3 Open Government Data Portal Platforms
Different platforms are being used as open data solutions like CKAN, DKAN4, Socrata5,
Junar6 etc [Millette and Hosein,2016]. Most popular government data portals nowa-days are based on CKAN, the world’s leading open source data portal [Open Knowl-edge Foundation, 2009].
CKAN, Comprehensive Knowledge Archive Network, is a web-based management system developed by the Open Knowledge Foundation and is being used by more than 192 governments, institutions, and other worldwide organizations to manage open government data [Open Knowledge Foundation, 2009]. The popular open gov-ernment data portals reviewed in this work like theEuropean Data Portal,Data.gov,
Data.gov.uk, Data.gov.ie are also based on CKAN. It provides RESTFUL API for
4DKAN is an open data cataloging, publishing and visualization platform by CivicActions al-lowing governments and to easily publish data to the public.
5Socrata is an open data platform hosting corpus of government datasets accessible via open-datanetwork.com and an API opening it up for automated exploration and research.
6Junar is also an early leader in Open Data publishing which offers a Software-as-a-Service (SaaS) hosting model with a fully fledged infrastructure of hardware, software, and storage.
data access which has been used for harvesting in this work [Open Knowledge Foun-dation, 2009].
In open government data portals in general and CKAN in particular, full-text Search is one integral functionality. Full-text search, defined by [Kilic and Karabey,
2016], as the ability to query and possibly rank documents based on relevance, in its simplest form helps us to find documents containing given keywords ranked by their frequency in the document. CKAN, which is written in Python, uses Solr, a java based open source information retrieval library, to achieve full-text search functionality on the datasets stored in it’s PostgreSQL backend [Targett, 2015]. But Solr is not the only popular information retrieval alternative [Kilic and Karabey, 2016].
Despite the use of external libraries on top of PostgreSQL for full-text search, PostgreSQL also provides full-text functionality of its own which is powerful enough for simpler applications [PostgreSQL Global Development Group,2016,Belaid,2015]. PostgreSQL’s Full-text search uses pre-processing and indexing to prepare documents and save for later rapid searching. The pre-processing is done by breaking documents into words, removing stop words, converting words into lexemes, optimizing and storing the preprocessed documents [PostgreSQL Global Development Group,2016]. While the storage of preprocessed queries is done using vector datatype, tsquery is used for making preprocessed queries [PostgreSQL, 2018]. Both of them are used in this work for full-text searching and ranking.
2.2
Spatial Similarity Functions
In geographic information retrieval, in general, the representation of the geographic data is an essential issue for indexing and for retrieval. Toponyms(place names), geographic points, MBR or MBB(minimum bounding rectangle or minimum bounding box), and Complex polygons are the four common representations for geographic information [Larson, 2011]. Despite being prone to error due to its imprecision, minimum bounding rectangles are most commonly used in standards, and are simpler to work with. In the other hand, complex polygons are more accurate representations of geographic area and may represent the full representation of an area’s borders but they are much more difficult to deal with (compared to simple MBRs) [Larson,2011]. As mentioned by [Foundation, 2014], CKAN provides spatial search through Solr and PostGIS depending on the choice of backend with the first offering a spatial relevance sorting based on bounding box geometries. Solr filters search results using a bounding box or circle or by other shapes and sorts or boosts scoring by distance, or relative area in spatial searches like intersects, within, contains, disjoint, equals 7.
However, those capabilities haven’t yet been utilized in open government datasets. [Frontiera et al., 2008] compared 4 area of overlap, one Hausdorff distance and two probabilistic linear regression based spatial similarity functions using both MBBs and convex hulls. For both MBBs and convex hulls, among the area of overlap based
spatial similarity functions the following two functions were found out to have higher mean average query precision.
Hill(1990) = (2 ∗ Areaof Overlap)
(Areaof query + Areaof document)
J anee(2003) = (Areaof OV erlap)
(Areaof query ∪ Areaof document)
In the other hand, the only Hausdorff distance compared in the study is given by J anee(2003)HD = max(HD(Q, D), HD(D, Q))
Both Janee’s area of overlap and Hausdorff distance spatial similarity function have been utilized in this study.
2.3
Query Expansion
Another relevant topic for this study is query expansion. With the huge amount of data on the internet which is still growing exponentially, the discovery or extraction of relevant information from the web with a query of few keywords has been a challenge and an area of research interest. To overcome this, query expansion has been proposed as a way of improving search results by adding similarly significant expansion terms to users search keywords [Azad and Deepak, 2017]. The source of query expansion terms is an issue of interest in such studies. Ontologies like WordNet are of high interest in this case because they are built manually by experts (in MIT) and are regarded as highly accurate [Pal et al., 2013]. In the other hand, WordNet is also indicated to have fewer coverage of geospatial keywords [Chen et al., 2018]. As our work considers open government data with potential geospatial terminologies, another knowledge graph alternative was considered, ConceptNet.
Despite the difficulty of using concepts as query expansion terms, it has been evaluated for query expansion by [Hsu et al., 2008, Rivas et al., 2014, Hsu et al.,
2006, Bouchoucha et al., 2013, Azad and Deepak, 2017]. We will look at a deeper look of each knowledge bases in the next section.
2.3.1 WordNet
WordNet is a linguistic database of English words(nouns, verbs, adverbs, adjectives) organized into Synonyms which in return represents an underlying linguistic concept [Miller et al., 1990]. The following relations are represented in WordNet.
• The basic relation in WordNet is Synonymy which represents word senses and a symmetric relation between word forms. Synonyms can be changed inter-changeably without completely changing their meaning in some context E.g:-communities and residential areas or residential district(residential areas and residential district are both Synonyms to community).
• Hyponymy and Hypernymy in the other hand represent sub type and super type relations between synsets that are used to organize the hierarchichal structure of WordNet nouns. E.g: learning and education(direct Hyponym and Hyper-nym), communities and neighbourhood or village(HypoHyper-nym), communities and people(Hypernym)
• Meronymy and holonymy (part -whole) , antonymy(opposites) and troponymy(which indicates manners) are other relations used to represent semantic relations in WordNet.
2.3.2 ConceptNet
ConceptNet, in the other hand, is a knowledge base consisting over 1.6 million facts
spanning the every day spatial, physical, social, temporal, psychological and other aspects of life generated from 700000 sentences from the Open Mind Common Sense Project — a collaboration of over 14000 authors. It is designed to help computers understand how it is expressed in natural language and consists of knowledge from sources including but not limited to Wiktionary,OpenCyc, Multilingual WordNet and so on. [Speer and Havasi, 2012, MIT, 2019]
Figure 1: ConceptNet Structure - Source [Speer and Havasi,2012]
ConceptNet’s structure, as it can be seen in figure 1, is mainly made up of edges and relations. While edge is the basic part of knowledge representation in ConceptNet, a relation in return captures the relationship among edges [Speer and Havasi, 2012]. ConceptNet has several types of relations, but the main relations are defined as follows [MIT-Media-Lab,2018]
• Synonym - Represents edges of similar meanings. This is the Synonym relation in WordNet as well. E.g: sunlight and sunshine
• IsA-A subtype or specific instance. It corresponds the Hyponym relation in WordNet. E.g: car IsA vehicle; Chicago IsA city
• MannerOf - Similar to IsA but for verbs. E.g:- auction and sale
• Other relations include RelatedTo, FormOf, PartOf, HasA, UsedFor, Capa-bleOf, Causes, Antonym, UsedFor, DerivedFrom, SymbolOf, DefinedAs, En-tails, SimilarTo
In our study, after attempting combination of WordNet relations for different queries only Synonym, Hyponyms, Hypernyms were making changes in the results so only those three relations were considered for this study. Moreover, ConceptNet’s Synonym, IsA and MannerOf are the relation types which correspond to WordNet’s Synonyms and Hyponyms/Hypernyms respectively with 100% certainty [ MIT-Media-Lab,2018].
2.4
Relevancy Ranking and Relevance Judgment
The last theoretical concept relevant for this study, and information retrieval in gen-eral is relevance(relevancy ranking) which is mainly concerned with matching the information need of users.
For effective information retrieval and user satisfaction, evaluation of information retrieval system performance and to assess whether the system has addressed the information needs of users is done by operating user-based evaluation or system-based evaluation [Samimi and Ravana,2014].
In addition to traditional information retrieval, geographical information retrieval adds the spatial dimension of document representation and advances information retrieval [Cai, 2011].
Stating the difficulty of clearly understanding what relevance is, [Mizzaro, 1998] classified relevance as a four dimensional space to understand its nature as follows.
Inf Res = (Surrogate, Document, Inf ormation); (1)
Repr = Query, Request, P IN, RIN ; (2)
T ime = t(rin0), t(pino), t(ro), t(qo), t(ql), t(rl), .., t(qn), t(f )); (3) Comp = f T opic, T ask, (Context), ..., (T opic, T ask, Context) (4) where the first dimension represents information resources which includes the meta-data or representation of the document of an IR system, the physical entity of an IR system, and the entity the user receives up on reading the document. The second di-mension is the representation of the user’s problem which is given as real information need, perceived information need, request and query. The fourth dimension consists of subject area of the user problem(topic), activities the user will perform with the retrieved results and context.
Based on this classification, the type of relevance judgment which will be evaluated in this work will be given in the form of
3
Research Methodology
This section discusses the research methodology and implementation architecture used to conduct the comparisons in this work. First section 3.1 discusses the search strategies under comparison 3.2 highlights the overall architecture of the implemen-tations, 3.3 details the data harvesting and preprocessing phase, 3.4 explains the prototype and business logic 3.5 discusses the details of evaluation set up.
3.1
Strategies Overview
Before presenting our comparison methodology, lets look at the strategies we will compare.
Figure 3: Strategies.
As it can be seen from figure 3, four top level strategies were considered at the beginning of the study. The first strategy, baseline strategy, is based on only full text search while the other strategies consider spatial search. The baseline strategy is similar to the current working approach in Data.gov.uk and Data.gov.ie(except in this study we performed queries like (theme and space) instead of (theme or space)). In the second strategy, baseline spatial, location names are parsed and geocoded for spatial search. Therefore, a simultaneous spatial and thematic search is employed in this strategy. The second strategy addresses the missing simultaneous thematic and spatial search functionality in the aforementioned OGDs.
The third strategy in return improves the second strategy by expanding the the-matic keywords with expansion terms from WordNet and then apply weighted
simul-taneous full text search and spatial search. This strategy in the other hand is used to assess the impact of query expansion in OGD. Finally, the fourth strategy improves again the second strategy but by using ConceptNet for query expansion instead of WordNet and again apply simultaneous weighted full text search and spatial search and ranking.
The query expansion is done in two different alternative paths. The first is done using only Synonyms while in the second we have used a combination of Synonyms, Hypernyms and Hyponyms. The same is true in ConceptNet based query expan-sion. First we only considered ConceptNet Synonyms and secondly a combination of Synonyms, IsA and MannerOf which correspond to Synonyms, Hypernym, Hyponym relations in WordNet.
In all of these strategies except the first strategy the two selected spatial simi-larity functions discussed in section 2.2 are applied. Therefore, the strategies being compared totally are 11 strategies.
3.2
Overall Methodology Architecture
The overall methodology followed to compare the different strategies, is given in the following diagram.
Figure 4: Methodology.
As it can be seen from the figure the first task was harvesting of datasets and their corresponding metadata from selected data portals. This was followed by enhancing and preprocessing of the metadata. Preprocessed metadata of the harvested datasets were in return stored in PostgreSQL. We then developed a prototype application using Python flask. Finally, the prototype was used to evaluate the suggested strategies based on theoretical evaluation and user relevance judgment.
3.3
Data Harvesting and Preprocessing
As stated in the previous section the initial task in this work was data harvesting. We have harvested machine readable datasets of GeoJSON formats and corresponding JSON and CSV resources from CKAN based data portals of 3 English speaking countries (data.gov.uk 959, data.gov 1003, and data.gov.ie 547 datasets) using the CKAN API.
All CKAN based data portals have the same api URL pattern as follows U RL + /api/3/action/package search?
where URL stands the base data portal address.
Therefore, the harvesting iteration over the data portals is done using the above URL pattern. The response is a JSON of metadata about the datasets and re-sources. While the metadata and dataset harvesting is done iteratively, the metadata enhancement(pre-processing) is done in two different operations, spatial metadata pre-processing and thematic metadata pre-processing.
Figure 5: Data Harvesting and Preprocessing.
For the spatial metadata enhancement, we first look at the metadata extent of the spatial dataset(resource) harvested in the metadata or else in the GeoJSON bbox field. Since the metadata of the spatial datasets didn’t always had spatial extent in the metadatas’ harvested, the spatial metadata enhancement is done in case of miss-ing spatial extent either in the metadata or the GeoJSON file’s bbox field. The spatial metadata enhancement in return is done in three alternative bottom up approaches. The three approaches are: first by collecting minimum and maximum coordinates
from each feature in the GeoJSON’s feature follection. This is achieved as an aggre-gated bounding area of envelopes of each feature using OGR Envelope which returns a tuple (minX, maxX, minY, maxY) [GDAL/OGR contributors,2018].
In case the first operation based on aggregate of minimum and maximum coordi-nate from each collection in the GeoJSON feature collection fails, the second alterna-tive is applied using a combination of DBPedia Spotlight8 to parse place names in title or description in the dataset metadata and OSM Nominatim9 to find the bounding
polygon of the place name. .
Moreover if the second option yet again fails, the third and last option uses the source data portal URL and OSM Nominatim to geocode the country’s spatial extent as the dataset’s spatial extent.
Following the spatial metadata enhancement using either of the above alterna-tives, the thematic metadata is preprocessed and stored in PostgreSQL. The thematic metadata preprocessing is done by vectorizing(tokenizing) the textual metadata us-ing PostgreSQL’s ts vector function for weighted vectorization dependus-ing whether it appeared in the title, description or tags as follows.
setweight(to tsvector(0pg catalog.english0, coalesce(new.title,00)),0A0) setweight(to tsvector(0pg catalog.english0, coalesce(new.description,00)),0B0) setweight(to tsvector(0pg catalog.english0, coalesce(new.tags,00)),0A0); Higher weight, ’A’, is given to title and tags while description is given a reduced weight of ’B’.
3.4
Database Schema
The pre-processed metadata is stored in PostgreSQL database. The database schema therefore looks as follows:
8DBPedia spotlight is a tool for annotating mentions of natural language entities like place names [Mendes et al.,2011].
9OSM Nominatim is an open street map search tool used to search by name and address and generate addresses from Open street map data. [Open Street Map,2018]
Figure 6: Database Schema.
The database schema has the metadata table which consists of the harvested and pre-processed metadata and also users and ratings tables for user relevance judgment. The metadata table consists of title,description,and tags describing each metadata in text form, and tokens which is a column of weighted vectorized form of those textual descriptions. Moreover, the GeoJSON url stores the locally stored dataset used for automatic generation of envelope(spatial extent) by iterating over each GeoJSON featurecollection’s feature while polygon geo stores the spatial extent of the dataset. In the other hand, the users and ratings tables store the ratings done by a user on a result dataset in relation to search keywords and strategy. This is used in later stage for user relevance ratings evaluations.
3.5
Prototype, and Business Logic
This section discusses the implemented prototype and the detailed working principles of the business logic between the front end and back end.
3.5.1 Prototype
Aiming to compare and assess the different strategies on the harvested datasets (meta-data of (meta-datasets), we developed a web application using flask, a python web
micro-framework.
Figure 7: High Level System Architecture.
The inner workings of the prototype is explained in the next section. 3.5.2 Business Logic
As indicated in section 3.1, our prototype operates based on 11 different strategies. Therefore, when a user searches for a dataset, the following happens depending on which strategy the user is using to search for the datasets.
1. Strategy 1: Baseline - Keyword
A full text search of both thematic and spatial keywords is applied on the metadata stored in PostgreSQL without any spatial consideration. The ranking of the results is then returned using only PostgreSQL’s TS Rank.
2. Strategy 2: Baseline - Spatial (Area of overlap)
First a spatial similarity using area of overlap and spatial query with intersects condition is performed in the metadata stored in PostGIS. Then a full text search of the thematic query is applied on the spatially restricted results. Finally the results are ranked based on aggregated ranking of the thematic and spatial ranking results.
3. Strategy 3: Baseline - Spatial (Hausdorff distance)
First a spatial similarity using Hausdorff distance and spatial query intersects condition is performed in the metadata stored in PostGIS. Then a full text search of the thematic query is applied on the spatially restricted results. Finally the results are ranked based on aggregated ranking of the thematic and a reverse weighted spatial ranking.
4. Strategy 4: WordNet QE - Synonyms (Area of overlap)
First user thematic input queries are expanded with Synonyms from WordNet, followed by an area of overlap based spatial similarity with intersects condition in PostGIS. The weighted full text search using the thematic term and corre-sponding expansion Synonyms terms from WordNet are then applied on the spatially restricted results of the query. Finally, the results are ranked based on aggregated ranking of the thematic and spatial ranking results.
5. Strategy 5: WordNet QE - Synonyms (Hausdorff Distance) The same as strategy 4 but with Hausdorff distance.
6. Strategy 6: WordNet QE - Synonyms, Hypernyms and Hyponyms (Area of overlap)
First user thematic input queries are expanded with Synonyms, Hypernyms, and Hyponyms from WordNet, followed by an area of overlap based spatial similarity with intersects condition in PostGIS. The weighted full text search using the thematic term and corresponding expansion Synonym, Hypernym, and Hyponym terms from WordNet are then applied on the spatially restricted results of the query. Finally, the results are ranked based on aggregated ranking of the thematic and spatial ranking results.
7. Strategy 7: WordNet QE - Synonyms, Hypernyms and Hyponyms (Hausdorff Distance)
The same as strategy 6 but using Hausdorff distance instead of Area overlap 8. Strategy 8: ConceptNet QE - Synonyms (Area of overlap)
First user thematic input queries are expanded with terms from Synonyms edge of ConceptNet, followed by an area of overlap based spatial similarity with spatial intersects condition in PostGIS. The weighted full text search using the thematic term and corresponding expansion terms from Synonym edges in ConceptNet are then applied on the spatially restricted results of the query. Finally, the results are ranked based on aggregated ranking of the thematic and spatial ranking results.
9. Strategy 9: ConceptNet Query Expansion - Synonyms (Hausdorff distance)
The same as strategy 8 but using Hausdorff distance instead of Area overlap 10. Strategy 10: ConceptNet Query Expansion - Synonyms, IsA,
Man-nerOf (Area of Overlap)
First user thematic input queries are expanded with terms from Synonyms, IsA, MannerOf edges of ConceptNet, followed by an area of overlap based spatial similarity with intersects condition in PostGIS. The weighted full text search using the thematic term and corresponding expansion terms from Synonym,
IsA, and MannerOf edges in ConceptNet are then applied on the spatially re-stricted results of the query. Finally, the results are ranked based on aggregated ranking of the thematic and spatial ranking results.
11. Strategy 11: ConceptNet Query Expansion - Synonyms, IsA, Man-nerOf (Hausdorff Distance)
The same as strategy 10 but using Hausdorff distance instead of Area overlap As defined by [Hsu et al.,2008] the following weighing techniques has been applied for each query expansion in this work
Table 1: WordNet Query Expansion Weights
Thematic user input Synonym Hypernym Hyponym
Weight 1.0 1.0 0.8 0.9
WordNet Query Expansion Weights
Table 2: ConceptNet Query Expansion Weights
Thematic user input Synonym IsA MannerOf
Weight 1.0 1.0 0.9 0.9
ConceptNet Query Expansion Weights
Spatial Similarity
PostGIS Area and Intersection functions
PostGIS functions are utilized to perform spatial similarity operations in this work. PostGIS provides ST Area and ST Intersection functions to calculate the area of inter-section(overlap) of the query input and the document to be queried. The ST Intersection which is defined as:
ST Intersection(geoA, geoB);
Moreover, area of the intersection is calculated using ST Area function as: ST Area(geo);
which returns the area of the shared portion geometry, where geo is the shared geometry. Both of them work with geography and geometry. Using those functions from PostGIS, the area of overlap function definition is therefore computed, using Greg Jan´ee and James Frew’s formula [?] as
Areaof Overlap = Area(geoA ∪ geoB))
Area((geoA ∩ geoB) (1)
where geoA and geoB are location of the user query and document being queried.
PostGIS Hausdorff function
Alternatively, Hausdorff distance is also used to calculate the similarity of query location and database location. Hausdorff distance defined as the greatest of all the distances from a point in one polygon(geometry) to the closest point in the other polygon(geometry) [Larson,2011, ] is given in PostGIS as:
ST Hausdorf f Distance(geo1, geo2);
which implements euclidean distance algorithm. The Hausdorff distance between two polygons is in return computed as defined by Greg Jan´ee and James Frew [?] as follows:
Hausdorf f Distance = max(HD(geo1, geo2), HD(geo2, geo1)); (2)
where HD=Hausdorff Distance and geo1 and geo2 refer to the query location and location of the document to be retrieved respectively.
Thematic Search and Ranking
After spatial similarity operation two ranking operations are performed. One at the thematic level performed by PostgreSQL full text search and another our aggregate ranking function applied to the final result of both thematic and spatial search.
TS RANK
PostgreSQL provides the capability to rank relevant documents using TS RANK and TS RANK CD functions in relation to a given query taking into account “lex-ical proximity and structural information”, that is, how often, how close, and how
important the query terms are as part of the document being retrieved[PostgreSQL,
2018].
The ranking function TS RANK is given as:
T S Rank = ts rank([weightsf loat4[], ]vectortsvector,
querytsquery[, normalizationinteger]) (3)
The weights optional argument offers the ability to weigh word instances in the order:
D-weight, C-weight, B-weight, A-weight If no weights are provided, then these defaults are used: 0.1, 0.2, 0.4, 1.0 In our work, however, weights are given during vectorization based on their appearance in title,tags,category,and description respec-tively.
Aggregation
After the full text search applied is returned with the ranking of the thematic simi-larity and spatial simisimi-larity as part of the result, an aggregate function is performed. The Aggregation of the ranking results from both the thematic and spatial ranking is performed using the following formula:
Aggregate = n X
i=1
N (R(t)) + N (R(s)) (4)
where N(R(t)) is Normalized ranking of the full text search as returned from PostgreSQL’s Ts rank which is then normalized by dividing each rank by the range of the maximum and minimum to make the range between 0 and 1. N(R(s)) is Normalized ranking of the spatial query result which can either be of area of overlap or Hausdorff distance. This in return is normalized by dividing by the difference between the max and min. The normalized area of overlap produces similarity scores ranging from 0(none similarity) to 1(complete similarity) while the opposite is true with Hausdorff distance. Therefore, inverse weighting is used before normalizing the results of Hausdorff distance [Larson,2011]. Finally, result is ranked by the aggregated summation. This is done in all strategies except the keyword based baseline strategy which is based on only full text search ranking.
3.6
Evaluation Setup
3.6.1 Experimental Setup
The prototype is developed, tested and evaluated on a computer with the following characteristics:
Computer Manufacturer: HP
Processor: AMD A6-9220 RADEON R4, 5 Compute Core 2c+3G 2.50 GHz RAM: 8GB
System type: 64-bit operating system, x64-based processor Operating System: Windows 10
Therefore, the conclusions we made regarding performance are dependent on this system’s characteristics.
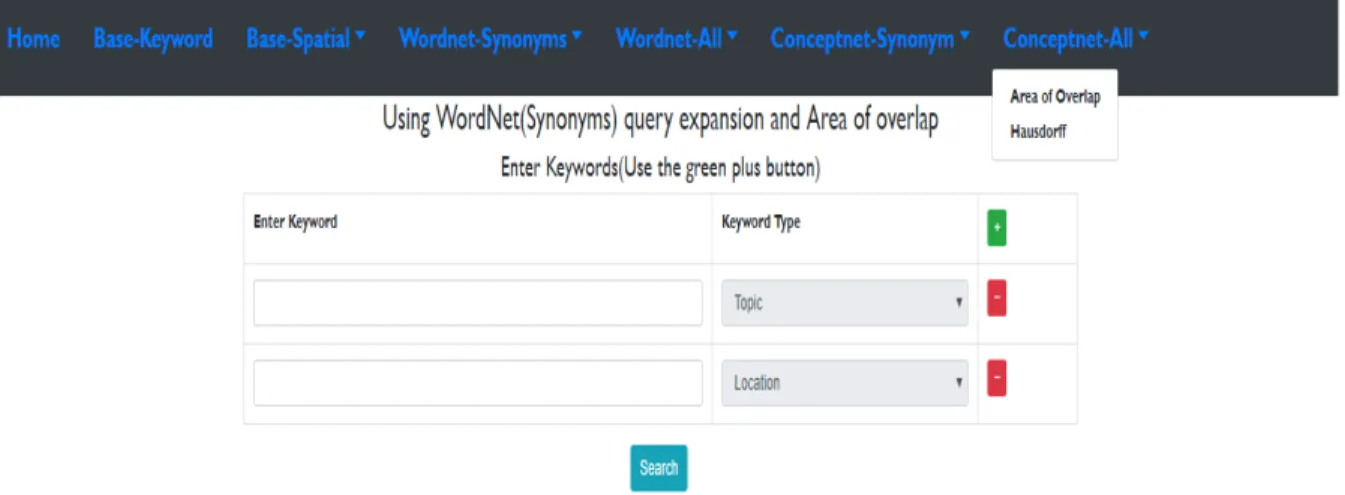
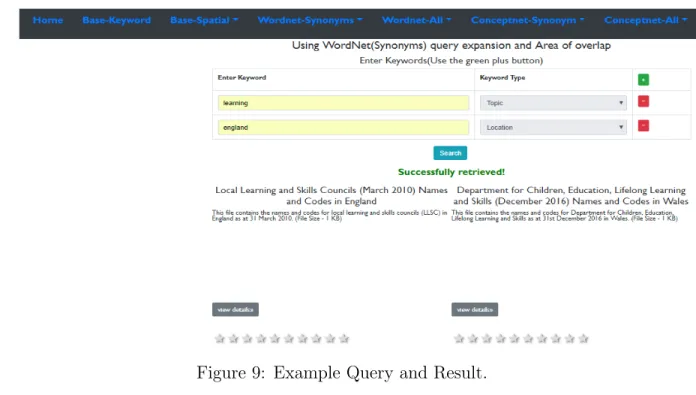
3.6.2 User Interface
The prototype user interface prior to the theoretical evaluation looks as follows:
Figure 9: Example Query and Result.
4
Evaluations and Results
Evaluation of this work was done both in-terms of system based evaluation and user based evaluation to assess both the performance (response time and number of results) of the strategies and the relevance rating of the results of the strategies using user relevance judgment [Samimi and Ravana, 2014].
4.1
Theoretical evaluation
To evaluate the performance of the strategies both in terms of time in seconds and number of results, the following four thematic and spatial query combinations were selected after testing multiple adhoc queries.
1. Population England 2. Learning Wales
3. Communities Republic of Ireland 4. Transport Fairfax
4.2
Results from theoretical evaluation and discussion
Query Terms Population and England
Figure 10: Performance in Seconds and Number of Results of Query Population England
In the first query we tested “Population England”, strategy 1(the base keyword strategy) resulted in 3 datasets while strategy 2, 3, 4, 5, 8, 9, 10, and 11 all resulted in 21 datasets. On the the other, both the spatial approaches with WordNet expansion using combination of Synonyms, Hypernyms and Hyponyms returned 101 results. So, while every other strategies applied resulted in the same number of results except the baseline keyword strategy, the query expansion using WordNet’s combination of Synonyms, Hyponyms, and Hypernyms applied increased the number of results. The performance (response time), on the other hand, increased from baseline to Con-ceptNet query expansion with ConCon-ceptNet query expansion being too expensive(15 seconds response time). But despite the increase in response time with ConceptNet approach number of results remained the same as the baseline spatial strategies.
Query terms Transport and Fairfax
Figure 11: Performance in Seconds and Number of results for Query Transport Fairfax • In this case, strategy 1 resulted in 7 datasets while the strategies 2 and 3 re-turned 16 datasets. Strategies 4 and 5 in return resulted in 18 results while strategies 6 and 7 returned 74 datasets. Strategies 8 and 9 in the other hand re-turned 21 results in 18 seconds while it was 33 results in 18 seconds for strategies 10 and 11.
As in the previous set of queries, with a performance (response time) of 18 seconds using strategies 8, 9, 10, 11 proved to be very expensive.
Query terms Communities and Republic of Ireland
Figure 12: Performance in Seconds and Number of Results for Query Communities Republic of Ireland
In our third query test, strategy 1 didn’t result in any datasets while the ap-proaches with strategies 2,3,8,9,10,11 resulted in 79 results. In the other hand, the number of results increased to 83 datasets when using strategies 4 and 5 and to 296 when using strategies 6 7 while the performance increased from 3 to 5 seconds. Interestingly, the datasets returned included datasets about residential areas and neighbourhoods meaning 75 datasets specifically about communities and 4 additional datasets about residential areas. In the other hand, response time of ConceptNet query expansion decreased in comparison to WordNet query expansion. This is be-cause Communities is a different edge than community in ConceptNet despite being of the same root word community. Moreover, Communities have fewer concepts(edges), 10 to be specific, in ConceptNet, of which community is one edge itself while com-munity has more than 1600 concepts(edges).
Query terms Learning and Wales
Figure 13: Performance in Seconds and Number of results for Query Learning Wales In the last query we tested, Learning Wales, 13 datasets from strategy 1 and 14 datasets from strategies 2 and 3 are retrieved. In the other hand, strategies 4 and 5 resulted in 44 datasets while strategies 6 and 7 returned 129 datasets. More-over, Strategies 8 and 9 resulted in 31 datasets and 53 datasets were retrieved using strategies 10 and 11.
Meanwhile, the response time of 3 seconds for strategies 4 and 5 increased to 4 seconds in strategies 6 and 7, the response time increased for strategies 8 through 11 to 14 and 13.
4.3
Discussion Based on Theoretical Evaluation
According to the theoretical evaluation, as the response time increases from baseline keyword based strategy to WordNet query expansion the number of results returned also increases. While the performance (response time) differences between strategy 1 through strategy 5, which is between 1 and 2 seconds, is tolerable [Nielsen, 1993,
MILLER, 1968], the response time of strategies 6 and 7 slightly increased in most cases when using three of the four query terms.
In the other hand, strategies 8 through 11 have exhibited a very long response time 15, 18 and 12 seconds in the worst case and 3 seconds only in one case. This is significantly affected due to the fluctuating response time from ConceptNet API. The results in those strategies are also affected because we weren’t able to find the WordNet Synonym, Hypernym and Hyponym relations’ in corresponding edges in ConceptNet with 100% consistency. Therefore, despite the coverage of more knowl-edge than WordNet, the fluctuating response time from it’s API and not significant impact on results due to difficulty of finding the synonyms, hypernyms and hyponyms relations with 100% certainty in specific edges, we deemed ConceptNet was costy for user evaluation.
Comparison with Existing Systems
At the end of the evaluations we also checked the results of the same queries in the existing systems which is given below.
Figure 14: Results from existing data portals
As it can be seen from the results, searching for the queries “population england” in data.gov.uk resulted in 1170 GeoJSON datasets while the queries “population” and ”england” separately resulted in 40 and 1162 datasets. In our case, the queries “pop-ulation england” returned 21 datasets either of the four strategies based on baseline spatial(area of overlap and Hausdorff) or wordnet(Area of overlap and Hausdorff). Our assumption is that data.gov.uk uses only keywords based search with or operator. This is also proven by testing the query, “Learning Wales”. Strategies 2 and 3 returned 14 datasets while 44 datasets were the results of strategies 4 and 5. The same query in data.gov.uk resulted in 762 GeoJSON datasets while for query Learning returned 761 and Wales returned 23 datasets independently.
Moreover, We also tested data.gov.ie for queries “communities and republic of ireland” which operates the same way as data.gov.uk. Results from baseline spa-tial strategies returned 79 for “communities republic of Ireland” while 83 datasets were returned using WordNet query expansion. The 4 more datasets returned in the WordNet QE strategy are datasets about residential areas in republic of ireland as it can be seen from the histogram. Because “Residential areas” and ”communities” are Synonyms in WordNet.
Finally, for the queries “Transport Fairfax” data.gov returned 7 GeoJSON datasets. This is the same number of results as our strategy from baseline keyword. But we couldn’t determine if they used ”and” operator like in our strategy 1 or it was spatial search. Strategies 2,3 in our comparison however resulted in 16 datasets. A depth
look into our results indicate, they include transport related datasets that partially match the query because they were assigned country bounding box after failure of the first two metadata enhancements. Those datasets include “National Forest System Trails (Feature Layer)” or “National Forest System Roads closed to motorized uses (Feature Layer)”.
4.4
User Relevance Judgment
After the theoretical evaluation, ConceptNet based four strategies were excluded from the user study for reasons mentioned in the previous section. Therefore, the user study was carried out using 16 participants based on the first 7 strategies and four queries in each strategy.
As specified in section 2.3, based on [Mizzaro, 1998]’s classification of relevance, we defined the relevance to be evaluated as
rel = (surrogate, request, (topic, task, context)
This means users were given the topic of the datasets to be retrieved, the rep-resentation of the information in need in human language, the tasks the user will perform with the results are as follows
1. You are interested in datasets about anything related to Learning in Wales. (a) Search for these datasets using
Query Theme: Learning Query Location: Wales
(b) For each of the first seven results, assign a number of stars indicating its relevance to your information need: the more number of stars, the more relevant the result.
After the study completion which was accompanied with video recording, we noticed one participant skipped several query results without rating so the result analysis was done based on only the 15 users who completed the relevance rating.
The relevance ratings distribution, mean and standard deviations of the ratings, and percentage of the first seven results rated more than half in each strategy are presented next. Average results rated in a minute, users judgment about the difficulty of the overall process and their feedback in the other hand is given at the end of this report.
4.5
Results from user relevance judgment
Query terms Population and England(a) Rating Distribution (b) Mean and Standard Deviation
(c) Percentage of the first seven results with relevance rating ≥ 5 out of 10
Figure 15: User relevance ratings for results of query “Population England” Using the query terms Population England, while strategy 1 had the highest mean of relevance rating strategies 6 and 7 showed a very high number of low rated datasets among the first seven ranked results. This is also shown from the mean and standard deviation of the ratings. Search Strategy 7, and 6 has the lowest average ratings of the first seven results than the other strategies with 5.98 and 5.64 mean respectively. Strategies 5 and 4 in the other hand have higher mean than strategies 2 and 3.
Moreover, according to the percentage of first seven results rated 5 and above strategy 1 has the highest relevance rating. Among the remaining strategies in the other hand, strategies 4 and 5 standout with a 75.5% and 72.9% of the first 7 results rated 5 and above.
Regarding, the spatial similarity functions higher relevancy rating was gained in two out three Hausdorff distance based strategies. That is, strategy 7 and strategy 3 which are based on Hausdorff distance resulted in higher relevance rating than area of overlap based strategies 6 and 2 respectively.
Query terms Learning and Wales
(a) Rating Distribution (b) Mean and Standard Deviation
(c) Percentage of the first seven results with relevance rating ≥ 5 out of 10
Figure 16: User relevance ratings for results of query “Learning Wales”
Using learning wales query, strategy 1(9.1), strategy 5 (9.0) and strategy 4 (8.7) have highest mean with lowest standard deviations 1.0, 0.9 and 1.4 respectively. In the other hand, strategies 6 and 7 have the lowest mean with 7.2 and 7.1 and highest standard deviation 2.9 and 2.8 respectively. Moreover, as it can also be seen from the histogram, strategies 6 and 7 have higher number of less relevant results than the other strategies in the first 7 results. This is also emphasized in the relevance rating diagram with Strategies 5 and 4 having the lowest percentage of results rated 5 and above.
Overall, like in the previous query terms, strategies 1, 5 and 4 have the highest relevance rating with 100%, 100% and 99% the first seven results rated 5 and above respectively.
Regarding the spatial similarity functions, Hausdorff distance based strategies had the highest relevance rating than area of overlap based strategies in all cases.
Query terms Transport and Fairfax
(a) Rating Distribution (b) Mean and Standard Deviation
(c) Percentage of the first seven results with relevance rating ≥ 5 out of 10
Figure 17: User relevance ratings for results of query “Learning Wales”
In the third thematic and spatial query combinations we evaluated, transport fairfax, strategy 1 has highest mean of relevance ratings with 8.02 while strategy 2 and 4 have the second and third highest mean of relevance ratings 7.57 and 7.54 respectively. Based on the ratings distribution histogram and ratings percentage diagram, in the other hand, strategy 4 have higher percentage of highly relevant datasets ranked in the first seven results than all the other strategies except strategy 1. Strategy 2, and 3 also had 89% percentage of their first seven ranked results with 5 and above rating. In terms of the Hausdorff distance and area of overlap in the other hand, area of overlap based strategies(4 and 6) had higher relevance rating than the corresponding Hausdorff distance based strategies ( 7 and 5).
Query terms Communities and Republic of Ireland
(a) Rating Distribution (b) Mean and Standard Deviation
(c) Percentage of the first seven results with relevance rating ≥ 5 out of 10
Figure 18: User relevance ratings for results of query “Communities Republic of Ireland”
The fourth and final set of queries we tested, Communities and Republic of Ireland, had higher percentage of relevant results ranked in the first seven results in strategy 7(7.38 mean and 86% relevance) and strategy 3(7.37 mean and 82% relevance rating of 5 and above). This is also shown in the ratings distribution histogram. Strategy 4 and 5 on the other hand have 77% and 79% of the the first seven results were rated 5 and above while they also had an overall average rating of 6.51 and 7.24 respectively. For this specific query combination, all Hausdorff distance based strategies resulted in higher relevance rating than the area of overlap counterparts. E.g: strategy 7 (85.7%) has more relevance rating percentage than strategy 6(63.7%) while strategy 3 with 78.8% relevance rating showed greater than that of strategy 4’s 77.2% relevance rating. The same is true for strategies 3 and 2.
5
Results Interpretation and Discussion
Overall, as expected the response time(performance) increased from baseline keyword through the query expansion strategies. Strategy 1 has the fastest response time but lowest number of results in all cases. This is because, unlike the data.gov.uk and data.gov.ie which seem to use query like “Population or England”, we used logic “and” like “Population and England” for a combination of spatial and thematic search. The decision was made out of the logic, while searching for population related datasets in england one should query “population and england” not “population or england”.
Strategies 2 and 3 in the other hand increased the number of results in all cases at a cost of 1 second delay. It can be seen that the number of results was improved by the spatial metadata enhancement of the pre-processing phase.
Moreover, strategies 4 and 5 increased the number of results in three out of the four queries still at a cost of 1 second. This increase was noticed in query terms with Synonyms in WordNet which happen to be used in open government datasets. For example, communities and residential areas.
For strategies 6 and 7 in the other hand the number of results increased signifi-cantly in all cases at the cost of increasing the response time.
Based on user relevance, however, a different trend was noticed. Strategy 1 ap-peared to have highest relevance rating among the limited retrieved results in all strategies. Among the other strategies, Strategies 4 and 5 had highest relevance ranking in three of the four queries with 75% and 73% for query terms Population england, 99% and 100% for learning and wales query terms and 90% and 87% for query terms transport and fairfax. Strategy 7 and strategy 3 exhibited higher rele-vance rating(86%) for query terms communities and republic of Ireland.
In relation to the spatial similarity functions, the strategies using Hausdorff dis-tance exhibited higher relevance rating than the area of overlap according to the percentage of results from the first seven results with more than half relevance rating. Overall, Hausdorff based strategies were of higher relevance rating in query terms “population england” in two out of three strategies than area of overlap while all Hausdorff based strategies had higher relevance rating than area of overlap based strategies for query terms “learning wales” and “communities republic of ireland”. It can easily be noticed the fact that minimum bounding box of england completely covering wales has reduced the relevance rating of area of overlap based strategies.
6
Conclusion, Limitations and Future Works
6.1
Conclusion
Datasets produced or collected by governments are being made publicly available for re-use. Open government data portals help realize this by providing list of datasets through which users can search, inspect and use easily.
With the rapidly increasing size of datasets in such data portals, just like it is the case with the web, finding relevant datasets with a query of few keywords is a challenge. Furthermore, those data portals not only consist of textual information but also georeferenced data that needs to be searched properly. Currently, most popular open government data portals like the data.gov.uk and data.gov.ie lack the support for simultaneous thematic and spatial search. Moreover, the use of query expansion hasn’t also been studied in open government datasets.
In this study we have assessed different spatial search strategies and query expan-sion’s performance and impact on user relevance judgment. To evaluate those strate-gies we harvested machine readable spatial datasets and their metadata from three English based open government data portals, performed preprocessing and metadata enhancement, developed a prototype and evaluated theoretically and with users using four queries.
Although the results demonstrated are limited to the datasets and the test queries of this study, the following conclusions result from the compared strategies and the investigated data portals.
Among all strategies while the number of results being retrieved are the lowest, the keyword based spatial search strategy retrieved highest relevance rated results. In the other hand, aggregated spatial and thematic search improved the number of results in all tested queries but at a reduced cost of relevance judgment of the first seven results. We noticed this was affected by datasets that were assigned the source country’s bounding box as spatial extent after failure of the first two metadata enhancement operations and were returned as results because they partially matched the query.
Moreover, the WordNet Synonyms based strategy resulted in higher relevance rating of the first seven results than all other strategies except the baseline keyword based strategy in three out of the four query terms. This is especially noticed in the results for query terms with commonly used Synonyms in open government data like “Communities” and “Residential areas”. Combination of WordNet Synonyms, Hyponyms, Hypernyms, however, had lower relevance rating of the first seven results in three of the four strategies.
Finally, regarding the use of Hausdorff distance and area of overlap, since doc-uments were returned as results only if they overlap with the query, the number of results returned were the same in both spatial similarities. But strategies using Haus-dorff distance were of higher relevance rating and average mean than area of overlap
based strategies in three of the four queries.
In conclusion, while the spatial search strategies assessed in this study can be used to improve the existing keyword based OGDs search approaches, we recommend OGD developers to also consider using WordNet Synonyms based query expansion and hausdorff distance as a way of improving relevant spatial data discovery in open government datasets using few keywords and tolerable response time.
6.2
Limitations and Future works
Despite the attempt to cover as many possible strategies as possible, the time con-straint has been a challenge. Based on our experience in this work, the following directions can be taken for further possible improvements.
1. Using ConceptNet (or any other knowledge base or ontology that extends Word-Net for that matter) for query expansion can be further tested independent of API and using different combination of edges, to improve the performance is-sues and thereby alleviate the lack of geospatial terminologies in WordNet [Chen et al., 2018],
2. As reported by [Frontiera et al., 2008], convex hull and logistic regression based geometric similarity functions have significant improvement over min-imum bounding box(MBB) geometric similarity functions used in this work. Therefore, this work can be extended by using those more efficient geometric similarity functions.
3. Prior knowledge in the number of datasets harvested can also help make the comparisons using precision and recall and check our conclusions from another direction.
4. Currently open government data portals are mostly based on lucene, especially CKAN based data portals, and some elastic search. Despite early attempts in this work to use either of those options, inability to match their learning curve in this short period and also because we decided it was enough for comparison purposes we have opted for PostgreSQL full text search. Therefore, future stud-ies can be made based on those platforms to match the current open government working platforms.
5. Last but not least, this work is based on only keyword based search. Early attempts to make use of semantic parser like Google SLING [Ringgaard et al.,
2017] to make use of longer text were unsuccessful because of Google SLING’s platform dependency (works only on Linux). Therefore, Google SLING or other semantic parsers can also be utilized for extending this work.
![Figure 1: ConceptNet Structure - Source [Speer and Havasi, 2012]](https://thumb-eu.123doks.com/thumbv2/123dok_br/15802816.1079500/19.918.132.785.556.876/figure-conceptnet-structure-source-speer-havasi.webp)
![Figure 2: Relevance Judgment - Source [Samimi and Ravana, 2014]](https://thumb-eu.123doks.com/thumbv2/123dok_br/15802816.1079500/20.918.149.761.729.1005/figure-relevance-judgment-source-samimi-ravana.webp)