Life Science Press
Research
Variation of physical properties of fruits
with drying and kinetic study
Guiné RPF*
CI&DETS and CERNAS Research Centres, Polytechnic Institute of Viseu, Campus Politécnico, Repeses, 3504-510 Viseu, Portugal *Corresponding author Raquel P. F. Guiné Professor Quinta da Alagoa Estrada de Nelas Ranhados, 3500-606 Viseu Portugal Tel. +351-232-446641 Fax: +351-232-426536, E-mail: [email protected] Received: May 22nd, 2018 Accepted: June 11th, 2018 Published: June 11th, 2018 Citation
Guiné RPF. variation of physical properties of fruits with drying and kinetic study. Life Sci Press. 2018; 2(1): 40-47. doi: 10.28964/Lifesci-Press-2-106
Copyright
©2018. Guiné RPF. This is an open access article distributed un-der the Creative Commons Attribu-tion 4.0 InternaAttribu-tional License (CC BY 4.0), which permits unrestricted use, distribution, and reproduction in any medium, provided the origi-nal work is properly cited.
ABSTRACT
Background: Food drying, despite being a very ancient practice for food preservation, is still one of the most important processing operations in the food industry.
Objective: In this work was studied the drying of two fruits (kiwi and apple) with respect to the
physical properties of texture and colour, and the drying kinetics was also evaluated with adjust-ment to thin layer models.
Method: For drying, a convection chamber was used at 80 °C and with an air flow of 0.5 m/s.
Before and after drying the fruits were analysed with respect to their colour and texture, for being properties that are greatly affected by this type of thermal process. The colour measurement was done with a colorimeter in the CIELab coordinates and for the analysis of the texture profile a texturometer equipped with a 75 mm probe was used.
Results:The results showed that the drying caused very noticeable colour differences in both cases, with values of ∆E equal to 8.6 and 10.7, respectively for kiwi and apple. In the case of kiwi, there were important differences between the pulp, the inner part of the fruit and the seeds (L* varying between 42 and 62, a* between -8 and -1, b* between 17 and 33). Regarding the texture, drying produced important changes in the structure of the fruits, with decreasing hardness (40-62%) and chewiness (13-42%), counterbalanced by an increase in resilience (226-131%), cohe-siveness (17-25%) and elasticity (20-23%). In relation to the kinetics, the two fruits tested had a similar behaviour, taking 2.5 hours to reach a moisture content of about 20%. The Wang & Singh model, with correlation coefficients of 0.997 and 0.999, respectively, for kiwi and apple, was the most suitable to fit the experimental data.
Conclusion: Drying significantly affected colour and texture of both fruits and the fitting of the drying data to both kinetics models was successful.
Keywords: colour, texture, thin layer, drying constant, kinetic model.
INTRODUCTION
Drying of food products is widely used to preserve food and to ensure food safety, as it consider-ably reduces chemical, enzymatic and microbial changes during the storage period, thus extend-ing the shelf life of the product [1], [2].
Drying is a complex process involving the simultaneous transfer of heat and mass. The practice of drying a product sample in a single layer of particles or slices is known as thin-layer drying. Currently, three types of mathematical models are used to define the thin-film drying process of agricultural products, which are: theoretical models, which only study the internal resistance to transfer moisture between heating air, semi-theoretical models and experimental models that only take into account external resistance[3].
Some examples of semi-theoretical type thin-layer drying models include: the Henderson and Pa-bis model, the Lewis model, the two-term model, the Page and modified Page models. Examples of empirical models are the Wang and Singh model and the Thompson model [4].
Life Science Press
acceptable to the consumer. Colour is one of the most important quality factors when it comes to product acceptability, because it is immediately detectable. Browning reactions occur during fruit drying, and this has a significant impact on the colour of the final product. These browning reactions are more intense when increasing the drying temperature of the product and this increase is faster when the product contains high sugar contents, as with fruits[5].
Dried products retain a significant proportion of their nutritional value, but are often less appreciated because of their texture. Be-cause of the loss of large amounts of water, these products are characterized by low porosities and high apparent densities. In fact, drying impairs the texture of the product to an appreciable extent and, in many cases, causes loss of integrity. By control-ling the texture characteristics during drying, it is necessary to take into account the changes that occur in the product, which are often determined by its composition as well as the drying conditions[6].
The objective of this work was to evaluate the changes in colour and textural properties of two fruits (kiwi and apple) during con-vective drying, as well as to determine the drying kinetics and to calculate the corresponding drying constant.
MATERIAL AND METHODS Sample preparation
The fruits used in this study were kiwi (Actinideadeliciosa), Hayward variety, and apple (Malusdomestica), Golden delicious variety. The samples were acquired at a local market, and the selection was based on some parameters, including uniformity in size. For drying, both the apple and the kiwi were cut into 5 mm thick slices using an automatic cutter and then laid on trays. Drying procedure
The drying was carried out in a WT Binder chamber with air circulation, the temperature being set constant at 80 ° C and air velocity at 0.5 m/s.
The moisture was periodically measured on a HG53 Halogen Moisture Analyzer, Mettler Toledo, operated at speed 5 (on a scale between 1 = very fast to 5 = very slow) and at 120 °C. For the assessment of the mean values, three repetitions were made at the beginning and also at each time point along drying. Measurement of colour
Colorimetry is the science that studies the colour according to standard human perception. Colorimeters use sensors that simu-late the way the human eye sees colour and quantify colour dif-ference between a standard and a sample. A colorimeter (Chro-ma Meter - CR-400, Konica Minolta) was used to determine the colour, which measured the Cartesian coordinates L * a * b * in the CIELab colour space. The dimension L* represents the brightness on a scale from 0 (black) to 100 (white) and the
di-mensions a* and b* are chromaticity coordinates, with a* rang-ing from green (-a) to red (+a) and b* rangrang-ing from blue (-b) to yellow (+b)[7], [8].
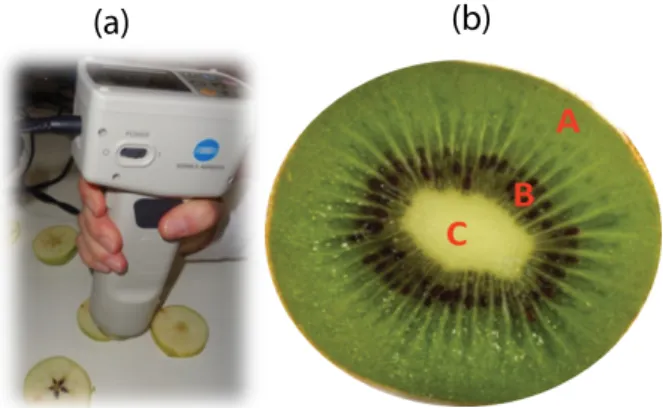
All determinations were made in triplicate, and in the case of kiwifruit, due to non-uniformity, measurements were made in three distinct regions: interior, core bow and outer pulp, as indi-cated in Figure 1.
To make an overall assessment of the change in colour due to ex-posure to air or drying, the colour difference was calculated (∆E) using Equation (1) [9], where the chromatic coordinates with the index 0 correspond to the reference values, which in this case refer to the values obtained shortly after the cutting operation, i.e., before oxidation could occur:
2 0 2 0 2 0
)
(
)
(
)
(
L
L
a
a
b
b
E
=
−
+
−
+
−
∆
(1)A higher value of ∆E corresponds to a larger colour difference than the reference sample. A typical scale for assessing the co-lour difference is as follows: ∆E in the interval [0.0;2.0] cor-responds to unrecognizable differences, in the interval] 2.0;3.5] corresponds to possible differences to recognize by an experi-enced observer and more than 3.5 corresponds to clear colour differences [10].
Evaluation of textural properties
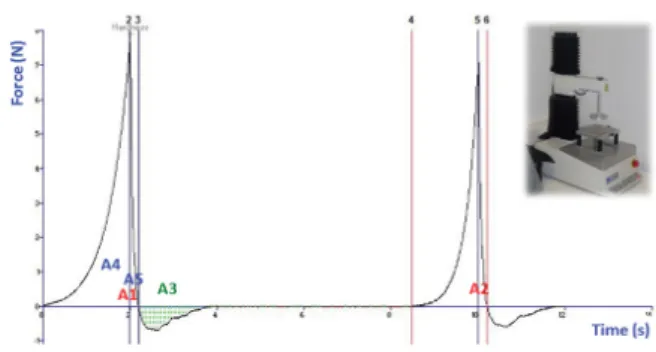
The instrumental Texture Profile Analysis (TPA) is a test which uses the principles of compression, and tries to simulate the man-dible action compressing the sample in a reciprocating motion twice. Based on the force-time curve it is possible to estimate textural properties. The texture analysis was performed using a texturometer (model TAXT Plus from Stable Micro Systems) in order to obtain the texture profiles (TPA), as exemplified in Figure 2. The texture profile analysis comprised two cycles of compression, spaced by a 5-second interval, using a flat probe of 75 mm diameter. The load cell used was 30 kg and the test and post-test rates were both 0.5 mm/s.
Three TPAs were obtained for each fruit in the fresh and also in the dried states. The textural parameters hardness, adhesive-ness, springiadhesive-ness, cohesiveadhesive-ness, resilience and chewiness were
(b)
(a)
Figure 1. (a) Measurement of colour in the apple slices, (b) Areas considered for the evaluation of colour in the kiwi slices.
Life Science Press
Life Science Press
calculated through Equations (2) to (7) taking into account Fig-ure 2[11]: (2) (3) (4) (5) (6) (7)
Modeling of drying kinetics
The thin layer models are mathematical expressions that relate the variations of humidity along drying with some parameters, such as the drying constant, k [s-1] or the lag factor, k
0 [dimen-sionless], which explain the combined effects of various transfer phenomena occurring during drying [12].The Handerson&Pabis model is an example of thin layer kinetic model, which is ex-pressed in terms of the moisture ratio (MR) according to Equa-tion (8)[13]–[16]:
(8)
wherek0 is the lag factor, k is the drying constant and MR is the
moisture ratio, defined as:
(9)
with W, W0e We, respectively,the moisture contents expressed in
Figure 2.Texture profile analysis for one sample of fresh kiwi.
g water per g dry matter at the generic instant t, the initial mo-ment and at the equilibrium.
Equation (8) can be expressed in logarithmic form, resulting in a linear function of the type:
(10)
that allows to calculate the drying constant from the slope and the lag factor from the intercept.
Alternatively, a second-order polynomial model, also known as the Wang & Singh model, was tested[17]:
(11) Statistical analysis
Differences between samples obtained for all properties evalu-ated with one-factor analysis of variance (one-way ANOVA), followed by multiple comparisons test (Tukey'sHonestly Signif-icant Difference test) to identify differences between the differ-ent drying temperatures. Statistical analyses were tested at 0.05 level of significance.
To evaluate the model that best fits the experimental data was used the coefficient of determination (R2), and also on
differ-ent statistical test parameters, as described by Equations (12) to (17):
Mean absolute error:
=
∑
iN=V
i−
V
prediN
MAE
1
1 exp, , (12)Root mean square error:
(
)
∑
=−
=
iNV
iV
prediN
RMSE
1 2 , exp,1
(13) Standard error: (14)Sum of square errors:
=
∑
Ni=(
V
i−
V
predi)
N
SSE
1 2 , exp,1
(15) Chi square: (16)Relative percent deviation:
∑
=−
=
iN i i pred iV
V
V
N
RPD
1 exp, , exp,100
(17)Where N is the number of experimental observations and np is
the number of parameters. Also, Vexp,i and Vpred,i are, respectively, the experimental and predicted values for the dependent
vari-t
k
k
M
R
)
=
ln(
)
−
ln(
ln(MR) 0 MRa
t
b
t
c
M
R
=
2+
+
(
)
1 1 2 , exp, − − =∑
= N V V SE N i i predi SE(
)
∑
=−
−
=
iN i predi pV
V
n
N
CS
1 2 , exp,1
CS= MRM
R
=
k
0exp(
−
k
t
)
Life Science Press
able, which is MR in the present case, for each observation i. The highest the value of R2, approaching 1, the better is the fit, while
lower values of CS and RMSE, tending to zero, are indicative of predictions more adequate to the experimental data. These last indicators (RMSE and CS) compare the differences between the experimental and predicted values of MR, whereas the RPD compares the absolute differences between them. Values of RPD under 10% are indicative of a good fit [18].
RESULTS AND DISCUSSION Colour properties
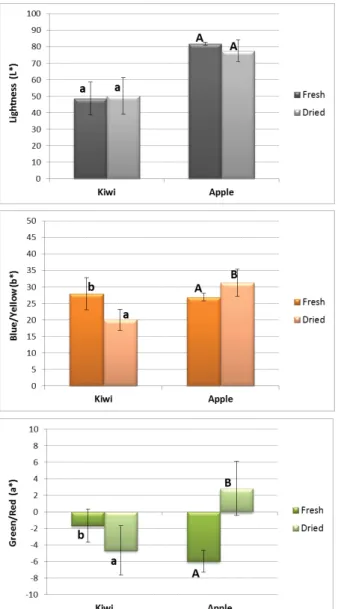
Figure 3 shows the colour coordinates of the two studied fruits, namely L*, a* and b*. It is verified that drying did not practi-cally change the luminosity (L*) in the case of kiwifruit, but in the case of apple the drying turned the samples slightly darker (lower L*). With regard to the parameter a*, in the case of kiwi, it presents negative values before and after drying,
correspond-ing to the green colour. It was verified that the drycorrespond-ing allowed to maintain the green colour and even to intensify a little in the case of the kiwi. Regarding the apple, the green colour prevailed before drying, but after drying it turned to red (a* positive), as a result of the browning reactions that occur during drying in the presence of oxygen. The coordinate b* was always posi-tive, indicating that in both fruits yellow predominated instead of blue. The drying caused a decrease of b* in the case of kiwi, but an increase in the case of the apple. The difference in color (∆E), calculated by Equation (1), was 8.6 in the case of kiwifruit and 10.7 in the case of apple, corresponding in both cases to very relevant and clearly identifiable differences, according to the classification suggested by Valdivia-López and Tecante[19]. Thus, drying under the conditions tested markedly influenced the colour of both fruits.
Figure 4 presents the colour coordinates for kiwi, corresponding to measurements made in three distinct regions: interior, arch where the seeds are located and outer pulp, as indicated in
Fig-Figure 3. Colour coordinates in the fresh and dried fruits. Bars with different letters
correspond to means significantly different for the same fruit: ANOVA with Tukey test (p < 0.05).
Figure 4. Colour of kiwi in the different points of analysis.Bars with different letters
Life Science Press
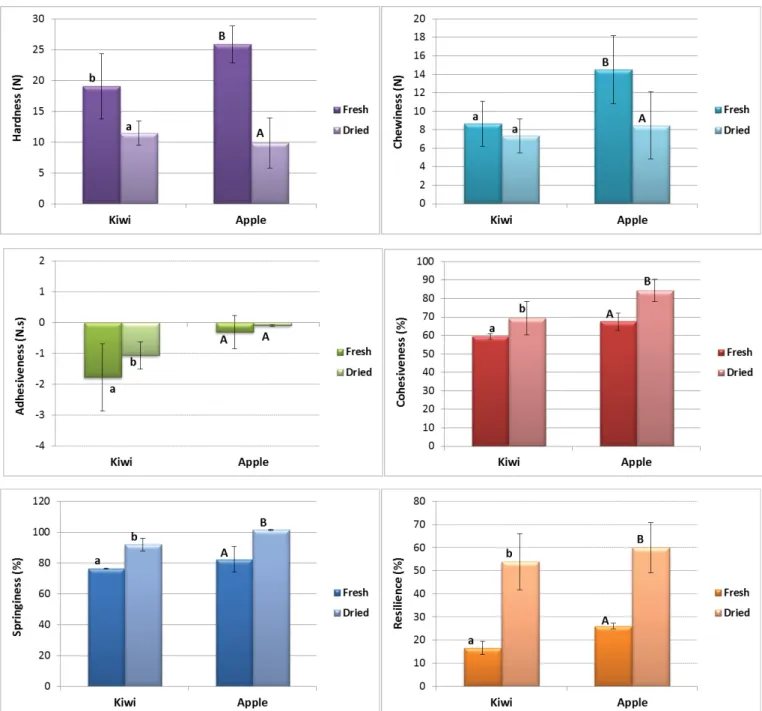
Figure 5. Textural parameters in the fresh and dried products.Bars with different letters correspond to means significantly different for the same fruit: ANOVA with Tukey
Life Science Press
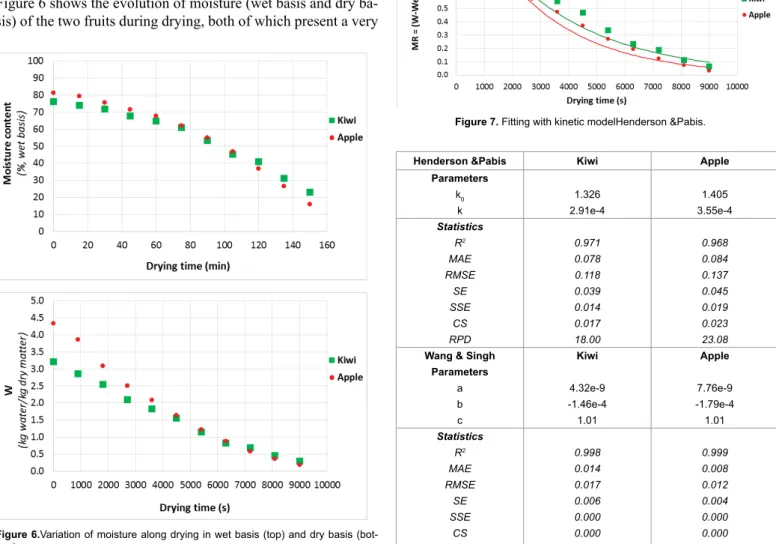
similar behaviour, only with a greater loss of water in the case of the apple, which had a higher moisture content at the outset. Both fruits tested took 2.5 hours to reach a moisture content of about 20%.
Figure 7 shows the adjustment of the experimental points ob-tained for the moisture ratio (MR) to the Handerson&Pabis thin layer model, described by Equation (8). The adjustments were obtained through the linear form of the model (Equation (10)), and are described by the following equations, whose parameters are in Table 1:
For kiwi:
MR=1.326exp(-2.91×10⁻⁴ t) [R= 0.971] (18)
For apple:
MR=1.405exp(-3.55×10⁻⁴ t) [R = 0.968] (19)
quired to remove the material adhering to a specific surface (for example, lips, palate, teeth), the values obtained in both cases (Figure 5) were very small (less than 0.2 N.s - absolute value), and therefore these results indicate that these two fruits do not have measurable adhesiveness, as it was previously observed forother food products, such as cucumbers, pears or apples [6], [24], [25].
The cohesiveness (or cohesion) represents the strength of the inner bonds, which make the food remain cohesive [21]. Resil-ience is how well a product struggles to regain its original posi-tion. It can be seen as an instantaneous elasticity, since resilience is measured when the first penetration is withdrawn, before the start of the waiting period [21]. Elasticity or springiness defines the ability of a food to recover its original shape after removal of the force that caused the compression [21]. Figure 5 shows that these three parameters (cohesiveness, resilience and elastic-ity) increased with drying for both fruits. Increases were in the ranges 17-25% for cohesiveness, 226-131% for resilience and 20-23% for elasticity, respectively for kiwi and apple. Cruz et al. [23]also observed an increase in elasticity in the case of apple drying.
Drying kinetics
Figure 6 shows the evolution of moisture (wet basis and dry ba-sis) of the two fruits during drying, both of which present a very
Figure 6.Variation of moisture along drying in wet basis (top) and dry basis
(bot-tom).
Figure 7. Fitting with kinetic modelHenderson &Pabis.
Henderson &Pabis Kiwi Apple
Parameters k0 1.326 1.405 k 2.91e-4 3.55e-4 Statistics R2 0.971 0.968 MAE 0.078 0.084 RMSE 0.118 0.137 SE 0.039 0.045 SSE 0.014 0.019 CS 0.017 0.023 RPD 18.00 23.08
Wang & Singh Kiwi Apple
Parameters a 4.32e-9 7.76e-9 b -1.46e-4 -1.79e-4 c 1.01 1.01 Statistics R2 0.998 0.999 MAE 0.014 0.008 RMSE 0.017 0.012 SE 0.006 0.004 SSE 0.000 0.000 CS 0.000 0.000 RPD 5.77 3.02
Life Science Press
These results show that the adjustments are acceptable, given the high values of the regression coefficients, close to 1, that would correspond to the perfect fit.
The Handerson&Pabis model allows to estimate the drying constant, which was in this case 2.91x10⁻⁴ and 3.55x10⁻⁴ s-1,
re-spectively for kiwi and apple. These values are more or less in the ranges reported by Kholmanskiy et al. [26]for various food products, including also apples.
Figure 8 shows the adjustment of the experimental points to Wang & Singh's empirical model, described by Equation (11),
which corresponds to a 2nddegree polynomial function, resulting
for the two fruits in the following equations: For kiwi:
MR =4.32×10⁻⁹ t2 ₋ 1.46×10⁻⁴ t+1.01 [R = 0.998] (20)
For apple:
MR =7.76×10⁻⁹ t2 ₋ 1.79×10⁻⁴
t+1.01 [R = 0.999] (21) These results indicate that the latter model allows a better adjust-ment to the experiadjust-mental points, both in the case of kiwi and in the case of apple, with R values of 0.998 and 0.999, respectively. However, because it is a purely empirical model, it does not al-low to estimate parameters of interest for the knowledge of the process, as in the case of the previous model.
Table 1 further confirms that the adjustment with Wang & Singh's empirical model is better in view of the statistical indi-cators calculated, because the values of MAE, RMSE, SE, SSE, CS and RPD are considerably lower for both fruits when com-pared to those of the Henderson and Pabis model. Furthermore, the values of RPD are lower than 10 %, being 5.77% and 3.02% respectively for kiwi and apple, indicating a very good quality of the fit.
CONCLUSIONS
The results obtained in this work indicate that drying affected the colour of both fruits in a very relevant way, and also induced
Figure 8. Fitting with kinetic model Wang & Singh.
important changes in texture, namely with a decrease in hard-ness and chewihard-ness and an increase in resilience, cohesivehard-ness and springiness.
The kinetic data were well fitted to two thin-layer models, the Handerson&Pabis semi-theoretical model and Wang & Singh's purely empirical model. It was possible to estimate the drying constants from the first model: 2.91x10⁻⁴ and 3.55x10⁻⁴ s-1,
re-spectively for kiwi and apple.
CONFLICT OFINTEREST
No conflicts of interest to declare. ACKNOWLEDGMENT
Thanks to the students from master Degree in Food Quality and Technology, at ESAV: Cristina Sousa, Jéssica Carmo, Suzanna Ferreira, Carla Pereira, Ivone Marques.
REFERENCES
1. K. Sacilik and G. Unal, ‘Dehydration Characteristics of Kastamonu Garlic Slices’, Biosyst. Eng., vol. 92, no. 2, pp. 207–215, Oct. 2005.
2. R. P. F. Guiné, M. J. Barroca, F. J. Gonçalves, M. Alves, S. Oliveira, and M. Mendes, ‘Artificial neural network model-ling of the antioxidant activity and phenolic compounds of bananas submitted to different drying treatments’, Food
Chem., vol. 168, pp. 454–459, Feb. 2015.
3. B. Yilbas, M. Hussain, and I. Dincer, ‘Heat and moisture dif-fusion in slab products due to convective boundary condi-tion’, Heat Mass Transf., vol. 39, no. 5–6, pp. 471–476, Jun. 2003.
4. W. B. Asiru, A. O. Raji, J. C. Igbeka, and G. N. Elemo, ‘Math-ematical Modelling of Thin Layer Dried Cashew Kernels’,
Niger. Food J., vol. 31, no. 2, pp. 106–112, Jan. 2013.
5. S. Chunthaworn, S. Achariyaviriya, A. Achariyaviriya, and K. Namsanguan, ‘Color kinetics of longan flesh drying at high temperature’, Procedia Eng., vol. 32, pp. 104–111, Jan. 2012. 6. R. P. F. Guiné, F. Henriques, and M. J. Barroca, ‘Influence
of drying treatments on the physical and chemical proper-ties of cucumber’, J. Food Meas. Charact., vol. 8, no. 3, pp. 195–206, Apr. 2014.
7. R. P. F. Guiné, I. C. Almeida, A. C. Correia, and F. J. Gon-çalves, ‘Evaluation of the physical, chemical and sensory properties of raisins produced from grapes of the cultivar Crimson’, J. Food Meas. Charact., vol. 9, no. 3, pp. 337–346, Mar. 2015.
8. S. F. Oliveira, F. J. A. Gonçalves, P. M. R. Correia, and R. P. F. Guiné, ‘Physical properties of Physalis peruviana L.’, Open
Life Science Press
9. A. C. Cruz, R. P. F. Guiné, and J. C. Gonçalves, ‘Drying Ki-netics and Product Quality for Convective Drying of Apples (cvs. Golden Delicious and Granny Smith)’, Int. J. Fruit Sci., vol. 15, no. 1, pp. 54–78, Jan. 2015.
10. M. Á. Valdivia-López and A. Tecante, ‘Chia (Salvia hispan-ica): A Review of Native Mexican Seed and its Nutritional and Functional Properties’, Adv. Food Nutr. Res., vol. 75, pp. 53–75, 2015.
11. R. P. F. Guiné, A. C. Cruz, and M. Mendes, ‘Convective Dry-ing of Apples: Kinetic Study, Evaluation of Mass Transfer Properties and Data Analysis using Artificial Neural Net-works’, Int. J. Food Eng., vol. 10, no. 2, pp. 281–299, 2014. 12. P. P. Tripathy and S. Kumar, ‘A methodology for determi-nation of temperature dependent mass transfer coefficients from drying kinetics: Application to solar drying’, J. Food
Eng., vol. 90, no. 2, pp. 212–218, Jan. 2009.
13. M. R. Avhad and J. M. Marchetti, ‘Mathematical modelling of the drying kinetics of Hass avocado seeds’, Ind. Crops
Prod., vol. 91, pp. 76–87, Nov. 2016.
14. A. O. Dissa, D. J. Bathiebo, H. Desmorieux, O. Coulibaly, and J. Koulidiati, ‘Experimental characterisation and model-ling of thin layer direct solar drying of Amelie and Brooks mangoes’, Energy, vol. 36, no. 5, pp. 2517–2527, maio 2011. 15. A. Kouchakzadeh, ‘The effect of acoustic and solar energy
on drying process of pistachios’, Energy Convers. Manag., vol. 67, pp. 351–356, Mar. 2013.
16. S. Vijayan, T. V. Arjunan, and A. Kumar, ‘Mathematical modeling and performance analysis of thin layer drying of bitter gourd in sensible storage based indirect solar dryer’,
Innov. Food Sci. Emerg. Technol., vol. 36, pp. 59–67, agosto
2016.
17. M. Younis, D. Abdelkarim, and A. Zein El-Abdein, ‘Kinetics and mathematical modeling of infrared thin-layer drying of
garlic slices’, Saudi J. Biol. Sci., Jun. 2017.
18. R. P. F. Guiné, F. Henrriques, and M. J. Barroca, ‘Mass Transfer Coefficients for the Drying of Pumpkin (Cucurbita moschata) and Dried Product Quality’, Food Bioprocess
Technol., vol. 5, no. 1, pp. 176–183, 2012.
19. M. Á. Valdivia-López and A. Tecante, ‘Chia (Salvia hispan-ica): A Review of Native Mexican Seed and its Nutritional and Functional Properties’, Adv. Food Nutr. Res., vol. 75, pp. 53–75, 2015.
20. A. J. Rosenthal, Food Texture: Measurement and Perception. New York: Springer, 1999.
21. A. R. P. Calado, J. C. Gonçalves, P. M. R. Correia, and R. P. F. Guiné, ‘Time Evolution of Physicochemical Properties of Carrots During the Drying Process’, Curr. Biochem. Eng., vol. 3, no. 2, pp. 139–153, 2016.
22. S. Gunasekaran and M. M. Ak, Cheese Rheology and
Tex-ture. CRC Press, 2002.
23. A. C. Cruz, R. P. F. Guiné, and J. C. Gonçalves, ‘Drying Ki-netics and Product Quality for Convective Drying of Apples (cvs. Golden Delicious and Granny Smith)’, Int. J. Fruit Sci., vol. 15, no. 1, pp. 54–78, Jan. 2015.
24. R. P. F. Guiné, ‘Variation of Textural Attributes of S. Bar-tolomeu Pears at Maturation, Storage, and Drying’, Int. J.
Food Prop., vol. 16, no. 1, pp. 180–192, Jun. 2011.
25. R. P. F. Guiné, S. Andrade, A. C. Correia, A. M. Jordão, A. D. Lopes, and D. Ferreira, ‘Evaluation of Textural Properties in Apples of Regional Varieties’, Int. J. Food Prop., vol. 14, no. 2, pp. 331–338, Feb. 2011.
26. А. S. Kholmanskiy, А. Z. Tilov, and Е. Y. Sorokinа, ‘Drying kinetics of plant products: Dependence on chemical com-position’, J. Food Eng., vol. 117, no. 3, pp. 378–382, Aug. 2013.