Engineering
ISSN: 1809-4430 (on-line)
_________________________
1 Federal University of Santa Maria (UFMS), Campus of Cachoeira do Sul (CS)/Cachoeira do Sul - RS, Brazil. 2 Federal University of Mato Grosso do Sul (UFMS), Campus of Chapadão do Sul - RS, Brazil.
3 Federal University of Grande Dourados (UFGD)/Dourados - MS, Brazil. *Corresponding author. E-mail: [email protected]
EFFECTS OF DRYING AIR TEMPERATURE AND GRAIN INITIAL MOISTURE CONTENT ON SOYBEAN QUALITY (GLYCINE MAX (L.) MERRILL)
Doi:http://dx.doi.org/10.1590/1809-4430-Eng.Agric.v36n5p866-876/2016
PAULO C. CORADI1*, CARLOS H. P. FERNANDES2, JEAN C. HELMICH2, ANDRÉ L. D. GONELI3
ABSTRACT:This study aimed to evaluate the effect of air-drying temperature and initial moisture content on volume shrinkage, physical quality and oil extraction yield of soybean grains. The grains used in this experiment were harvested at two distinct moisture levels of 19 and 25%. Then, these grains were taken to dryness at three different air temperatures of 75 °C, 90 °C and 105 °C, in a forced circulation convection oven of the air. The results showed a drying time reduction with increasing air temperatures. Regarding volume shrinkage, moisture content reductions influenced grain volume and the Rahman's model was the one that best fit the data. Moreover, the higher the air temperature, the greater the effects on soybean grain shrinkage and physical quality. By grain volume reduction effected on oil yield, major impacts were observed when assessing grain initial moisture content were higher. Furthermore, the temperature of 105°C and an initial moisture content of 25% were the factors that most affected soybean grain quality, however not affecting oil extraction yield.
KEY WORDS: extraction, performance, processing.
INTRODUCTION
Brazilian agriculture has a high yield potential that increases each year. In 2012/ 2013, there was a record of 53.27 million hectares being grown. One of the crops that has most contributed to such growing trend is soybean (Glycine max (L.) Merrill). The average yield of this crop have increased due to technology breakthroughs and increased acreage. Some areas of the Brazilian Cerrado which have been used for cattle rearing are being converted into soybean fields (CONAB, 2013). Furthermore, soybean yields in 2013/ 2014 season reached 3,056 kg ha-1, being 356 kg ha-1 higher than the previous season (2,700 kg ha-1) (CONAB, 2013).
Mostly, soybean grains are harvested at high moisture levels, from 16% to 25%, which becomes inappropriate for storage since such levels make grains most susceptible to infections by fungi or other microorganisms, thereby reducing their quality. For storing and selling, moisture content of soybeans must not exceed 14%, or even 12%, because it would improve storage quality. Therefore, drying process is extremely important; however, it may damage grains for changing their physical properties or even causing direct damage thereto (RESENDE et al., 2010; NIAMNUY et al., 2011; SOUSA et al., 2011; CORADI et al. 2014a). Even though the mechanical drying of soybeans can anticipate harvest, the high air temperatures involved in such process may cause biochemical changes in the product, affecting its quality.
HEMIS et al., 2012). SIQUEIRA et al. (2011) found smaller geometric mean diameters for seeds with reducing moisture contents, regardless of the drying conditions.
Soybean is an oilseed crop of great importance for agro-industrial, animal feeding and cosmetics companies. Regarding this parameter, air-drying temperatures are extremely important because oil physicochemical properties may undergo significant alterations such as rancidity of fats and pigmental changes as for carotenoids (SANJINEZ-ARGANDONA et al., 2011; CORADI et al., 2014b).
Thus, the objective of this study was to evaluate the effects of drying temperatures and initial moisture content on volume shrinkage, physical quality and oil yield of soybean grains.
MATERIAL AND METHODS
This study was carried out at the Laboratory of Grain Postharvest of the Federal University of Mato Grosso do Sul, in Chapadão do Sul – MS, Brazil. The soybean grains were purchased from private companies located in the cities of Chapadão do Sul (MS) and Chapadão do Céu (GO), both in Brazil, which were harvested at different initial moisture content (19% and 25%).
Samples of these grains were placed into plastic bags and stored in B.O.D. chambers set at 10 °C. Then, these samples were divided into six 25-g sub-samples, which were put into aluminum capsules placed to dry in a forced circulation convection oven at varied temperatures (75 °C, 90 °C and 105 °C).
Every thirty minutes, samples were weighed until reaching moisture balance. During drying process, temperature and relative humidity were monitored by means of a psychrometer. Grain moisture content (%) was determined by mass difference at the beginning and end of the drying process, by weighing 15-g samples. After that, these samples were placed in an oven with air heating and ventilation regulated at 105 °C ± 1°C for 24h (BRASIL, 2009); hereupon, the samples were removed and placed into desiccators for cooling. All tests were performed in three replicates.
During the drying process, the unitary volume shrinkage (Ψg) was estimated as being the ratio between final and initial grain volumes (Vg) using a caliper, as proposed by MOSHENIN (1986):
(1)
where, a: major axis of the grain, mm; b: mean axis of the seed, mm, c: minor axis of the seed, mm. The experimental unit shrinkage, expressed by the following mathematical models have been adjusted: Model reference Model Bala and Woods Ψg = a.{1-exp[b.(U-U0)]} (2)
Lang and Sokhansanj Ψg = a+ß1.(U-U0) (3)
Rahman Ψg = a+ß2.(U-U0) (4)
CORRÊA et al. (2010) Ψg = 1/[a+b.exp(U)] (5)
Line Ψg = a+b.U (6)
Exponential Ψg = a.exp(b.U) (7) where,
U : water content of the product, dry base;
Uo : initial water content of the product, dry base; ß1= a + b(UR) + c(T)
a, b, c: parameters that depend on the product; UR : relative humidity (decimal);
T : air temperature (ºC),
ß2 : volumetric coefficient, dimensionless contraction.
The samples also underwent electrical conductivity (EC) testing as described by VIEIRA & KRZYZANOWSKI (1999) and oil yield (OY) assessment according to the methodology described by OLIVIERA (2008).
The experiment was arranged in a completely randomized design (CRD) in a two-factor scheme with three drying air temperatures (75°C, 90°C and 105°C) and two initial grain moisture contents (19% and 25%). The OY and EC data underwent variance analysis with means compared by the Tukey’s test at 1% and 5% probability.
The mathematical models for Ψg were fit by nonlinear regression, using the quasi-Newton method, obtained through Statistica 7.0®. The goodness of each model was evaluated by considering the following parameters: regression coefficient significance at 5% probability, by the t-test; coefficient of determinations (R2); relative mean errors (P); standard errors (SE); and residue distribution (RD). The P and SE for each model were calculated according to the following expressions:
Y Yˆ Y n
100 P
(8)
GLR Yˆ Y SE
2
(9) where,
Y: experimentally observed value;
Yˆ : value calculated by the model;
n: number of experimental observations,
GLR: degrees of freedom of the model (the number of observations minus the number of model parameters).
RESULTS AND DISCUSSION
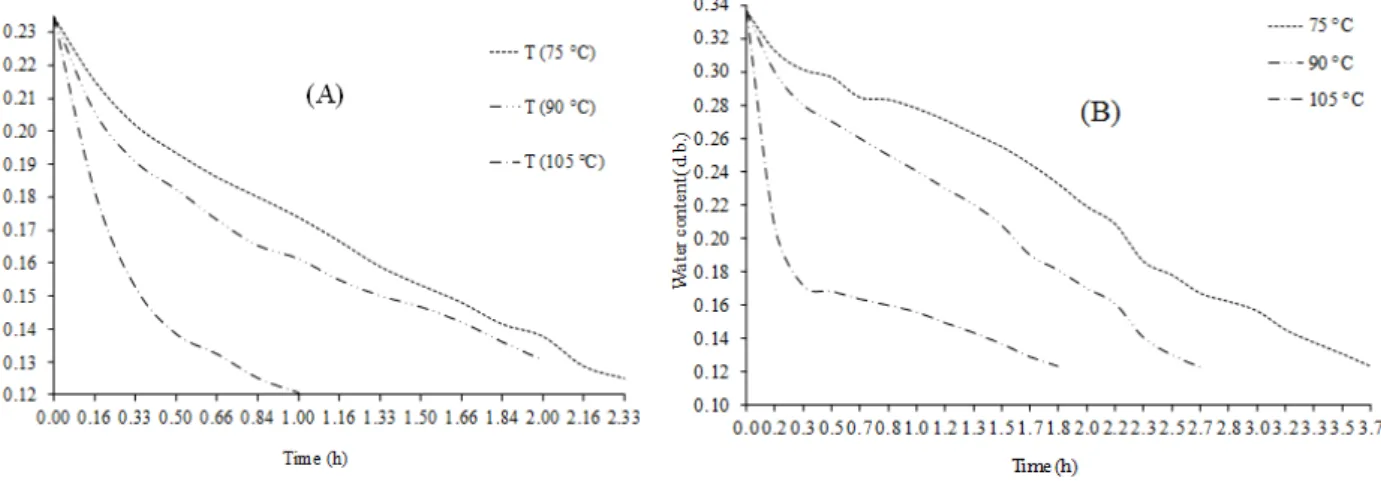
The drying process aimed at removing water content from soybeans by simultaneous heat transfer and airflow from water vapor to grains (GONELI et al. 2011; CORADI et al. 2016). Figures 1A and 1B show the drying curves for soybean grains at different air temperatures and with distinct initial moisture contents. For grains dried at 75 ºC, moisture reductions from 0.19 to 0.11 (decimal, db) lasted 2.33 hours, and losses between 0.25 and 0.11 (decimal, db), after 3.7 hours. It is noteworthy mention that increasing air temperatures shortened drying time, showing higher water removal rates. This outcome arouse from an increased energetic availability for water vaporization as well as a growing mass transfer coefficient by rising the drying air temperature.
the drying curves became similar, differing only as to time. After 1 hour, grains under 105
°C reached a 12% (wb) moisture content, while those under 75 and 90 °C were still at 17.5 and 16.5% (wb), respectively.
FIGURE 1. Curves of drying of soybeans with initial moisture content of 19% (w.b.) (A), and 25% (w.b.) (B).
Additionally, Figure 1B reveals increased drying rates at 105 °C within the first 0.3 hours compared to those achieved at 75 and at 90 °C. Meanwhile, as the process continues towards equilibrium, the drying curves of grains submitted to 75 and 90°C surpassed those of 105 °C, suggesting a possible change in mechanisms for inner water movement. After 0.3 h, grains at 105 ° C reached a 17% moisture level (wb) for both initial moisture contents, whilst those subjected to 75 and 90 °C were still at 31 and 28% (wb), respectively. From this point on, grains of damper treatment, i.e. soybeans dried at 75 °C, certainly have a greater amount of free water to provide largest drying rates whether compared to those dried at the highest temperature.
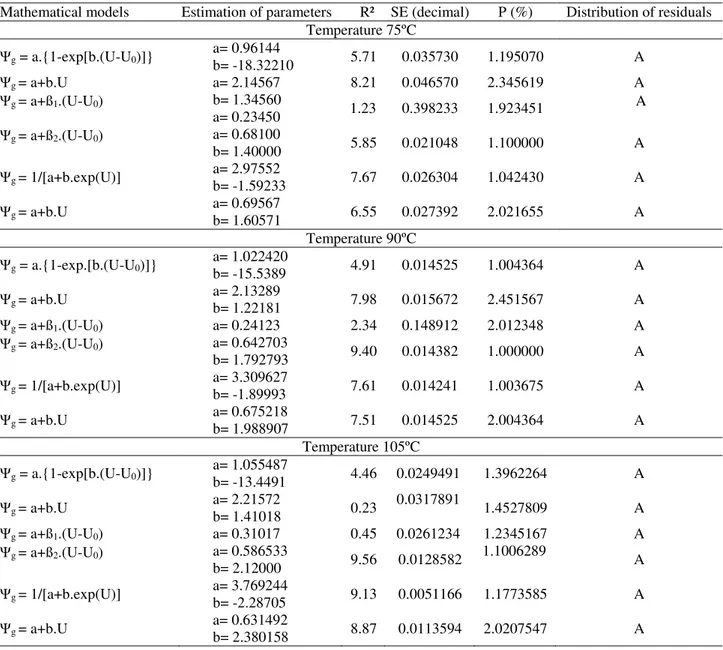
TABLE 1. Estimated parameters, coefficient of determination (R²), standard error (SE),
relative error (P) and residue distribution of the mathematical models used to describe shrinkage at different drying air temperatures of soybean grains with an initial moisture content of 19% (wb).
Mathematical models Estimation of parameters R² SE (decimal) P (%) Distribution of residuals Temperature 75ºC
Ψg = a.{1-exp[b.(U-U0)]} a= 0.96144 b= -18.32210 5.71 0.035730 1.195070 A
Ψg = a+b.U a= 2.14567 8.21 0.046570 2.345619 A
Ψg = a+ß1.(U-U0) b= 1.34560 1.23 0.398233 1.923451 A a= 0.23450
Ψg = a+ß2.(U-U0) a= 0.68100 5.85 0.021048 1.100000 A b= 1.40000
Ψg = 1/[a+b.exp(U)] a= 2.97552 b= -1.59233 7.67 0.026304 1.042430 A
Ψg = a+b.U a= 0.69567 b= 1.60571 6.55 0.027392 2.021655 A Temperature 90ºC
Ψg = a.{1-exp.[b.(U-U0)]} a= 1.022420 b= -15.5389 4.91 0.014525 1.004364 A
Ψg = a+b.U a= 2.13289 b= 1.22181 7.98 0.015672 2.451567 A
Ψg = a+ß1.(U-U0) a= 0.24123 2.34 0.148912 2.012348 A
Ψg = a+ß2.(U-U0) a= 0.642703 9.40 0.014382 1.000000 A b= 1.792793
Ψg = 1/[a+b.exp(U)] a= 3.309627 b= -1.89993 7.61 0.014241 1.003675 A
Ψg = a+b.U a= 0.675218 b= 1.988907 7.51 0.014525 2.004364 A Temperature 105ºC
Ψg = a.{1-exp[b.(U-U0)]} a= 1.055487 b= -13.4491 4.46 0.0249491 1.3962264 A
Ψg = a+b.U a= 2.21572 b= 1.41018 0.23 0.0317891 1.4527809 A
Ψg = a+ß1.(U-U0) a= 0.31017 0.45 0.0261234 1.2345167 A
Ψg = a+ß2.(U-U0) a= 0.586533 9.56 0.0128582 1.1006289 A b= 2.12000
Ψg = 1/[a+b.exp(U)] a= 3.769244 b= -2.28705 9.13 0.0051166 1.1773585 A
Ψg = a+b.U a= 0.631492 b= 2.380158 8.87 0.0113594 2.0207547 A
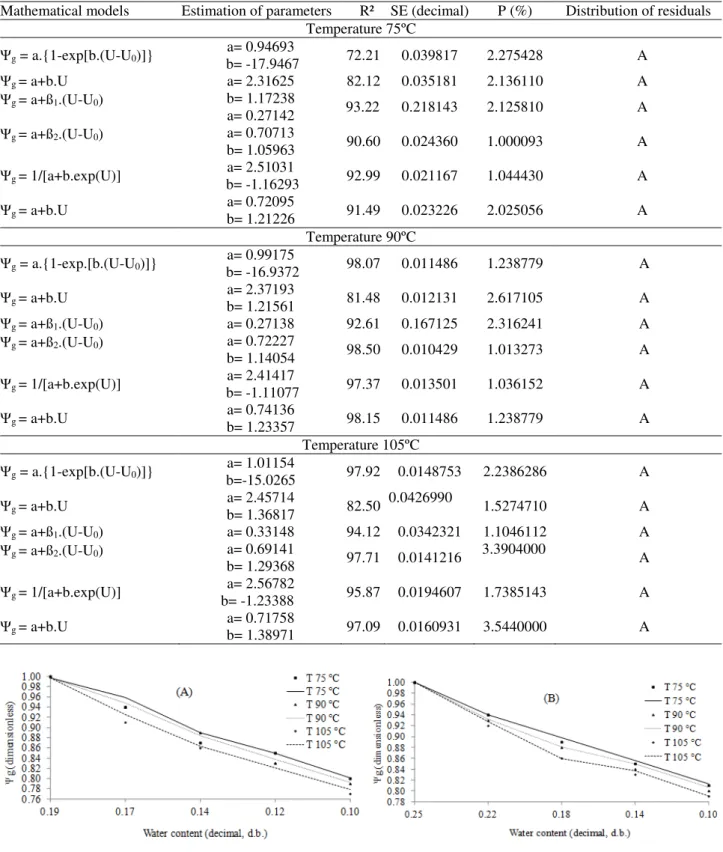
Figure 2 displays the values of unitary volume shrinkage (Ψg) adjusted by the Rahman model. Moisture reductions from 0.19 to 0.11 (db) led to a mass reduction of 23.20% in grains (Figure 2A), and from 0.25 to 0.11 (db) caused a shrinkage of 21.1% (Figure 2B).
TABLE 2. Parameters estimated, coefficient of determination (R²), estimated average (SE)
and relative error (P) and distribution of residues of the mathematical models used to describe the shrinkage of soybeans grains to different drying air temperatures and an initial moisture content of the grains of 25% (w.b.).
Mathematical models Estimation of parameters R² SE (decimal) P (%) Distribution of residuals Temperature 75ºC
Ψg = a.{1-exp[b.(U-U0)]} b= -17.9467 a= 0.94693 72.21 0.039817 2.275428 A
Ψg = a+b.U a= 2.31625 82.12 0.035181 2.136110 A
Ψg = a+ß1.(U-U0) b= 1.17238 93.22 0.218143 2.125810 A a= 0.27142
Ψg = a+ß2.(U-U0) a= 0.70713 90.60 0.024360 1.000093 A b= 1.05963
Ψg = 1/[a+b.exp(U)] b= -1.16293 a= 2.51031 92.99 0.021167 1.044430 A
Ψg = a+b.U a= 0.72095 b= 1.21226 91.49 0.023226 2.025056 A Temperature 90ºC
Ψg = a.{1-exp.[b.(U-U0)]} b= -16.9372 a= 0.99175 98.07 0.011486 1.238779 A
Ψg = a+b.U a= 2.37193 b= 1.21561 81.48 0.012131 2.617105 A
Ψg = a+ß1.(U-U0) a= 0.27138 92.61 0.167125 2.316241 A
Ψg = a+ß2.(U-U0) a= 0.72227 98.50 0.010429 1.013273 A b= 1.14054
Ψg = 1/[a+b.exp(U)] b= -1.11077 a= 2.41417 97.37 0.013501 1.036152 A
Ψg = a+b.U a= 0.74136 b= 1.23357 98.15 0.011486 1.238779 A Temperature 105ºC
Ψg = a.{1-exp[b.(U-U0)]} b=-15.0265 a= 1.01154 97.92 0.0148753 2.2386286 A
Ψg = a+b.U a= 2.45714 b= 1.36817 82.50 0.0426990 1.5274710 A
Ψg = a+ß1.(U-U0) a= 0.33148 94.12 0.0342321 1.1046112 A
Ψg = a+ß2.(U-U0) a= 0.69141 97.71 0.0141216 3.3904000 A b= 1.29368
Ψg = 1/[a+b.exp(U)] b= -1.23388 a= 2.56782 95.87 0.0194607 1.7385143 A
Ψg = a+b.U a= 0.71758 b= 1.38971 97.09 0.0160931 3.5440000 A
FIGURE 2. Volumetric shrinkage of soybeans during drying at different air temperatures and initial moisture content of 19% (w.b.) (A) and 25% (w.b.) (B) with the model of Rahman.
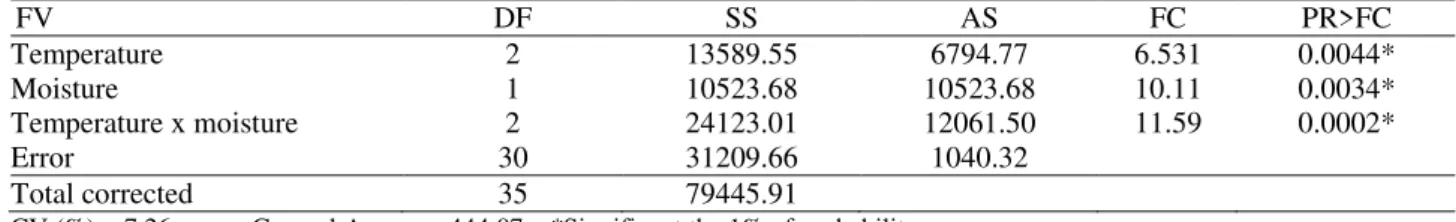
TABLE 3. Analysis of variance to test electrical conductivity (µS cm-1 g-1) in soybeans after drying.
FV DF SS AS FC PR>FC
Temperature 2 13589.55 6794.77 6.531 0.0044* Moisture 1 10523.68 10523.68 10.11 0.0034* Temperature x moisture 2 24123.01 12061.50 11.59 0.0002*
Error 30 31209.66 1040.32
Total corrected 35 79445.91
CV (%) = 7.26 General Average: 444.07 *Significant the 1% of probability
As already observed by other authors like CORADI et al. (2014a), EC values (Table 4) increased with worsening of the drying process quality. Therefore, this trait proved to be an efficient parameter in separating soybean samples regarding better and worse physical quality. Perhaps, a higher leaching of potassium with consequent increase in EC might be considered a strong indicator of cell membrane damages.
TABLE 4. Electrical conductivity test (µS cm-1g-1) in soybeans grains with different drying temperatures and initial water content.
Temperature of air drying (0C) Initial water content (19% w.b.) Initial water content (25% w.b.)
75 396.17 a A 409.3 b B
90 412.94 a A 423.30 a A
105 471.79 b A 457.96 a b A
Means followed by the lower case letter in the column, for each temperature of the drying air, upper lines for each water content was not significantly different at 1% probability.
The high temperature pre-processing of soybeans have been linked to membrane selectivity; thus, cell ruptures might have promoted extravasations of cellular contents (enzymes, proteins, amino acids, carbohydrates, lipids, ions, etc.), causing a chain of random undesirable reactions. According to CORADI et al. (2014a), once cell disruption is observed, those reactions become irreversible, resulting in a product of poorer quality at the end of the process.
On the other hand, EC testing may lead to different results depending on the grain to which it is applied. For instance, ROSA et al. (2000) evaluated the effectiveness of EC testing on studies of corn grain drying; they noted that air temperatures below 50 °C promoted immediate and severe damages to corn kernels. Differently, RIBEIRO et al. (2003) observed that coffee beans dried at 50 °C had higher values of EC (85.08 µS cm-1 g-1), corresponding to greater reductions in moisture content thereof. Similar results were found here when higher EC values were observed for grains dried at higher temperatures.
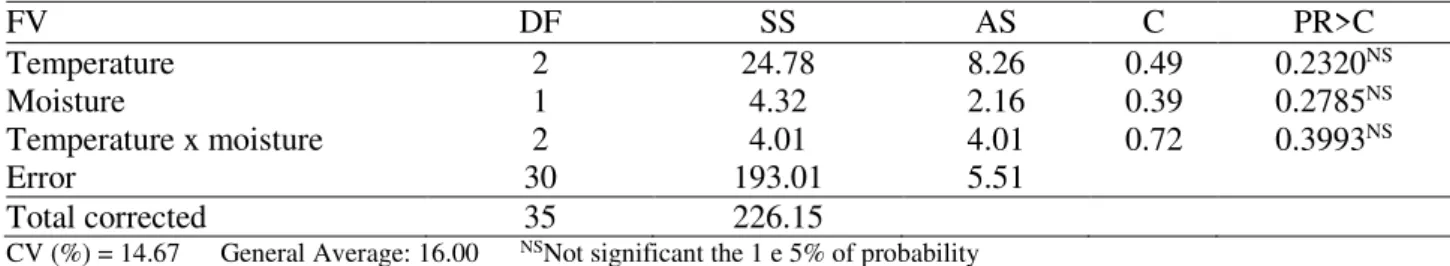
TABLE 5. Analysis of variance of oil yield (%) of soybeans grains after drying.
FV DF SS AS C PR>C
Temperature 2 24.78 8.26 0.49 0.2320NS
Moisture 1 4.32 2.16 0.39 0.2785NS
Temperature x moisture 2 4.01 4.01 0.72 0.3993NS
Error 30 193.01 5.51
Total corrected 35 226.15
CV (%) = 14.67 General Average: 16.00 NSNot significant the 1 e 5% of probability
TABLE 6. Oil yield (%) in soybeans grains after drying at different temperatures.
Temperature of air drying (0C) Average
75 15.37 a
90 15.59 a
105 17.20 a
Means followed by the lower case letter in the column, for each temperature of the drying air was not significantly different at 1% probability.
TABLE 7. Oil yield (%) in soybeans grains with different initial water contents after drying.
Initial water content (% w.b.) Average
19 15.73 a
25 16.37 a
Means followed by the lower case letter in the column, for each temperature of the drying air was not significantly different at 1% probability.
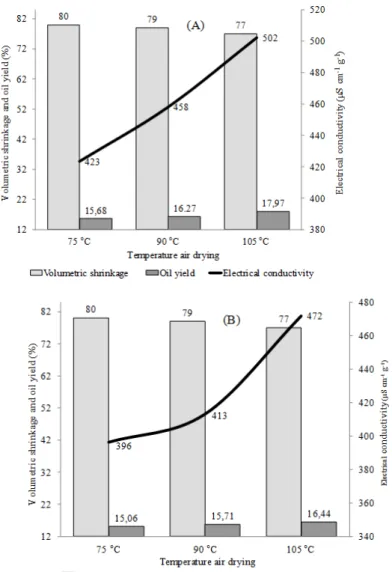
Figure 3 displays the comparative results among Ψg, OY and EC of soybean grains for each treatment. The rate of free fatty acids, as well as the oil content and its quality are the most important factors in purchasing of soybeans for human food and biodiesel industries. Figure 3A emphasizes that the largest OY values were obtained at higher drying air temperatures, given the reduced grain volumes. When the moisture contents were reduced from 25 to 10% (wb) (Figure 3A), grain volumes shrank by 20, 21 and 23% for grains dried at 75, 90 and 105 °C, respectively, whereas the content of oil ranged by 15.68, 17.97 and 16.27%, respectively.
By comparing the Ψg and OY results, one can observed that 3% volume shrinking provided 2.29% OY increase. Conversely, Figure 3A stresses that grain cell structures were compromised with increasing drying temperatures, achieving the largest amount of leached ions at 105 °C. On the other hand, even though these cell damages promoted risings in EC values, they did not affect OY.
FIGURE 3. Comparison of the effects of air temperature on drying shrinkage, oil yield and electrical conductivity in soybeans with initial water content of 25% (A) and 19% (B).
Conversely, when evaluating drying effects on shrinkage and ion leaching, by means of EC testing, Figure 3 names reductions in grain volume inversely proportional to rises in EC values as drying temperatures increase. These results confirm those obtained by BARBOSA et al. (2012), who claimed that EC gains were influenced by decreasing sizes of soybean grains. Analyzing the aspect of using this plant material for seeds, the results obtained in this work are not favorable. Therefore, elevated values of EC turn up to be a sign of seed physical damage, possibly affecting germination when sown in the field.
CONCLUSIONS
Reduced initial moisture content and high temperatures of the drying air influenced soybean grain volume.
Reduced grain volumes influenced the yield of soybean oil.
Drying air temperature of 105°C and initial moisture level of grains at 25% had an influence on grain quality, however, not affecting yield of extracted oil.
ACKNOWLEDGEMENTS
REFERENCES
BARBOSA, R.M.; SILVA, C.B.; MEDEIROS, M.A.; CENTURION, M.A.P.C.; VIEIRA, R.D. Condutividade elétrica em função do teor de água inicial de sementes de amendoim. Ciência Rural, Santa Maria, n.42, n.1, p.45-51, 2014.
BRASIL. Ministério da Agricultura e Reforma Agrária. Regras para análise de sementes. Brasília: SNDA/DNDV/CLAV, 2009.
CONAB - Companhia Nacional de Abastecimento. Acompanhamento da safra brasileira: grão safra 2013/2014, segundo levantamento, novembro 2013. Brasília, 2013. Disponível em:
<http://www.conab.gov.br>. Acesso em: 17 mar. 2014.
CORADI, P.C.; MELO, E.C.; ROCHA, R.P. Evaluation of electrical conductivity as a quality parameter of lemongrass leaves (Cymbopogon Citratus Stapf) submitted to drying process. Drying
Technology, New York, v.32, n.8, p.969-980, 2014a.
CORADI, P.C.; BORÉM, F.M.; REINATO, C.H. Coffee cherries drying process and the influence of environment relative humidity in the mathematical modeling, moisture content, and enthalpy of vaporization. Energia na Agricultura, Botucatu, v.29, n.2, p.148-157, 2014b.
CORADI, P.C.; FERNANDES, C.H.P.; HELMICH, J.C. Adjustment of mathematical models and quality of soybean grains in the drying with high temperatures. Revista Brasileira Engenharia Agrícola e Ambiental, Campina Grande, v.20, n.4, p.385-392, 2016.
CORRÊA, P.C.; GONELI, A.L.D.; AFONSO JÚNIOR, P.C.; OLIVEIRA, G.H.H.; VALENTE, D.S.M. Moisture sorption isotherms and isosteric heat of sorption of coffee in different processing levels. International Journal of Food Science and Technology, Oxford, v.45, p.2016-2022, 2010. GONELI, A.L.D.; CORRÊA, P.C.; MAGALHÃES, F.E.A.; BAPTESTINI, F.M. Contração
volumétrica e forma dos frutos de mamona durante a secagem. Acta Scientiarum. Agronomy, Maringá, v.33, n.1, p.1-8, 2011.
HEMIS, M.; CHOUDHARY, R.; WATSON, D.G. A coupled mathematical model for simultaneous microwave and convective drying of wheat seeds. Biosystems Engineering, New York, v.112, n.3, p.202–209, 2012.
MOSHENIN, N.N. Physical properties of plant and animal materials. New York, 1986. 841p. NIAMNUY, C.; NACHAISIN, M.; LAOHAVANICH, J.; DEVAHASTIN, S. Evaluation of bioactive compounds and bioactivities of soybean dried by different methods and conditions. Food Chemistry, London, v.129, n.1, p.899–906, 2011
NIAMNUY, C.; NACHAISIN, M.; POOMSA, N.; DEVAHASTIN, S. Kinetic modelling of drying and conversion=degradation of isoflavones during infrared drying of soybean. Food Chemistry, London, v.133, n.1, p.946–952, 2012.
OLIVEIRA, M. Temperatura na secagem e condições de armazenamento sobre propriedades da soja para consumo e produção de biodiesel. 2008. 70 f. Dissertação (Mestrado em Ciência e TecnologiaAgroindustrial)-Universidade Federal de Pelotas,Pelotas, 2008.
OLIVEIRA, D.E.C.; RESENDE, O.; SOUZA, S.T.A.; SIQUEIRA, V.C.; NETO, C.A.J. Alterações morfométricas em grãos de soja durante o processo de secagem. Semina: Ciências
Agrárias, Londrina, v.3, n.34, p.975-984, 2013.
POHNDORF, R.S. Efeitos da umidade e do resfriamento no armazenamento sobre a qualidade de grãos e do óleo de soja para fins comestíveis e de produção de biodiesel. 2012. 71 f.
RESENDE, O.; RODRIGUES, S.; SIQUEIRA, V.C.; ARCANJO, R.V. Cinética da
secagem de clones de café (Coffea canephora Pierre) em terreiro de chão batido. Acta Amazônica, Manaus, v.40, n.1, p.247-255, 2010.
RIBEIRO, D.M.; BORÉM, F.M.; ANDRADE, E.T.; ROSA, S.D.V.F. Taxa de redução de água do café cereja descascado em função da temperatura da massa, fluxo de ar e período de pré-secagem.
Revista Brasileira de Armazenamento, Viçosa, MG, v.3, n.7, p.94-107, 2003.
RIBEIRO, D.M.; CORREA, P.C.; RODRIGUES, D.H.; GONELI, A.L.D. Análise da variação das propriedades físicas dos grãos de soja durante o processo de secagem. Boletim da Sociedade Brasileira de Ciência e Tecnologia de Alimentos, Campinas, v.2, n.25, p.611-617, 2005. ROSA, S.D.V.F.; VON PINHO, E.V.R.; CARVALHO, M.G.; VEIGA, R.D. Eficácia do teste de condutividade elétrica para o uso em estudos de danos de secagem em sementes de milho. Revista Brasileira de Sementes, Londrina, v.22, n.1, p.54-63, 2000.
SANJINEZ-ARGANDONA, E.J.; BRANCO, I.G.; BITTENCOURT, T.U.; MUNHOZ, C.L.
Influence of temperature and geometry in the drying kinetics of tomato (Lycopersicum esculentum).
Food Science and Technology, Amsterdam, v.31, n.1, p.308–312, 2011.
SIQUEIRA, V.C.; RESENDE, O.; CHAVES, T.H. Contração volumétrica dos frutos de pinhão-manso durante a secagem em diversas temperaturas. Revista Brasileira de Armazenamento, Viçosa, MG, v.36, n.2, p.171-178, 2011.
SOUSA, K.L.; RESENDE, O.; CHAVES, T.H.; COSTA, L.M. Cinética de secagem do nabo forrageiro (Raphanus sativus L.). Revista Ciência Agronômica, Fortaleza, v.42, p.883-892, 2011. ULLMANN, R.; RESENDE, O.; SALES, J. F.; CHAVES, T. H. Qualidade das sementes de pinhão manso submetidas à secagem em diferentes condições de ar. Revista Ciência Agronômica,
Fortaleza, v.41, p.442-447, 2010.
VIEIRA, R.D.; KRZYZANOWSKI, F.C. Teste de condutividade elétrica. In: VIEIRA, R. D.; KRZYZANOWSKI, F.C.; FRANÇA NETO, J.B. Vigor de sementes: conceitos e testes. Londrina, ABRATES, 1999. p.1-26.
ZENI, D.B. Efeitos da temperatura na secagem e da umidade relativa no armazenamento sobre a qualidade de grãos e óleo de canola para biocombustível. 2010. 58f. Dissertação