IJAO
ISSN 0391-3988 ORIGINAL RESEARCH ARTICLEcurrent consensus is to define fluid overload as the differ-ence between bioelectrically measured extracellular water (ECW) and expected ECW, as predicted by biomorphologi-cal models of normohydrated patients; this parameter is referred to in this text as overhydration (OH) (6). Multifre-quency bioimpedance spectroscopy (BIS) is well validated in several populations of patients with end-stage renal disease (ESRD) (7, 8), and has been shown to be useful in the evalu-ation of the nutritional and volume status of hemodialysis (HD) (9) and peritoneal dialysis (PD) (5) patients. The asso-ciations between dehydration or overhydration with both loss of residual renal function (10, 11) and mortality (5, 12) are well established.
In PD patients, fluid homeostasis is the result of a balance between water and salt intake and peritoneal-kidney losses. As kidney function deteriorates, the importance of peritoneal water and solute losses is expected to increase. It follows that patients with less favorable peritoneal transport characteris-tics should have poorer fluid homeostasis. There is a well doc-umented, albeit strikingly weak, association between faster DOI: 10.5301/ijao.5000584
Relationship between bioimpedance-determined body
composition and peritoneal transport in peritoneal
dialysis
Bernardo M. da Costa1, Gloria Del Peso2, Maria Auxiliadora Bajo2, Gilda Carreño2, Marta Ferreira2, Carina Ferreira1, Rafael Selgas2
1 Nephrology Department, Curry Cabral Hospital-Central Lisbon Hospital Center, Lisbon - Portugal 2 Nephrology Department, La Paz University Hospital, FIBHULP-IdiPAZ, Madrid - Spain
Introduction
Bioimpedance devices apply an alternating electric cur-rent to the human body to estimate its composition by the measurement of 2 components: resistance, which is inverse-ly proportional to total body water, and reactance, which is proportional to cell mass (1, 2). One of the primary uses of this technology has been to determine fluid overload, a concept that has been expressed quite diversely (3-5). The
AbSTRACT
Purpose: In peritoneal dialysis (PD) patients, body fluid homeostasis is dependent on peritoneal elimination of water and solutes. Patients with less favorable peritoneal transport parameters should be more overhydrated. Despite this, the association between faster transport and overhydration (OH) is weak, and the factors that influ-ence hydration status are still poorly characterized. Modified peritoneal equilibration tests (PET) offer us new parameters that might correlate better with hydration status, like free water transport (FWT). The aim of this study was thus to establish the relationships between new peritoneal transport parameters and body composi-tion parameters estimated by bioimpedance spectroscopy (BIS).
Methods: Prospective observational study on incident PD patients with a baseline and 1-year follow-up evaluation. Results: 61 patients were included in the baseline evaluation, 19 of whom had a 1-year follow-up evaluation; 67.2% were fluid overloaded. There was a negative correlation between D/P creatinine and FWT (r = -0.598, p = 0.000). The fraction of FWT was negatively correlated with OH (r = -0.302, p = 0.018). Peritoneal protein losses (PPL) were also correlated with OH (r = 0.287, p = 0.028). There were no significant differences in OH according to small-solute transport status or fluid output parameters. After 1 year, we observed a significant worsening of renal function and an improvement in 24-hour ultrafiltration (UF) and hydration status, but we detected no dif-ferences in peritoneal transport of water or solutes that could explain these changes.
Conclusions: There is a poor relationship between kidney/peritoneal function parameters and body composition parameters. The fraction of FWT and PPL may be underestimated markers of peritoneal health and of its contri-bution to the hydration status.
Keywords: Bioimpedance, Fluid overload, Free water transport, Peritoneal dialysis, Peritoneal equilibration test, Peritoneal solute transport
Accepted: March 10, 2017 Published online: May 18, 2017 Corresponding author:
Bernardo M. da Costa Hospital Curry Cabral Serviço de Nefrologia Rua da Beneficência 8 1070 Lisboa, Portugal [email protected]
peritoneal small-solute transport status and fluid overload (6-8). However, we have been unable to clearly identify which factors most influence hydration status in PD patients (6).
According to the 3-pore model (13), water transport through the peritoneum occurs either in association with so-dium through small pores (small pore ultrafiltration - SPUF), or alone through aquaporins AQP-1 (free water transport [FWT]). A smaller sodium dip (an indirect way to estimate FWT) was found in patients with early, as well as late, ultrafil-tration failure (UFF) (14). Loss of FWT has been identified as the most useful predictor of encapsulating peritoneal sclero-sis (15). However, the sodium dip is only a semiquantitative indirect assessment of FWT. Modified peritoneal equilibra-tion test (PET) protocols (16, 17) with peritoneal drainage at 60 minutes allow us to directly calculate small pore ultrafil-tration (UF) (which is equivalent to the peritoneal Na+
clear-ance), and the remaining UF volume should be the absolute free water transport. Using these protocols, the fraction of free water transport through aquaporin-1 has been estimat-ed to be approximately 35% to 45% of total UF at 60 min-utes, with great variability among patients (18). A fraction of FWT under 26% is consistent with impaired FWT (17). FWT has been shown to remain stable for at least the first 4 years of PD if there are no peritonitis episodes (19). In view of this apparent relationship between FWT and peritoneal fibrosis (and in a way, peritoneal “health”) it would seem appropriate to investigate its relationship with hydration status.
The aim of this study was thus to establish the potential relationships between peritoneal transport parameters ob-tained by a modified PET and body composition parameters (BCP) given by BIS in a series of PD patients.
Methods
A single-center, prospective observational study with a baseline evaluation of a cohort of incident PD patients, and a 1-year follow-up evaluation was performed. The study period lasted from December 2012 to July 2016.
Patients
Inclusion criteria for the baseline study were age over 18 years, incident PD patient and stable clinical and biochemi-cal situation. Inclusion criteria for the 1-year follow-up longi-tudinal study were having participated in the baseline study and having completed 1 year on PD without receiving a kid-ney transplant, transference to HD or death. Exclusion criteria were: implanted metallic device, amputated status and preg-nancy. Upon starting in our PD program all patients are asked to give consent to the anonymous use of their clinical data for research purposes, and an Ethics Committee vote was obtained.
PET and BIS measurements
A modified 2-in-1 PET using 3.86%/4.25% glucose solu-tions and temporary drainage at 60 minutes (18) was per-formed at 6 to 8 weeks of initiating PD. Samples of 24-hour urine, 24-hour dialysate and blood were collected at the same appointment. The same test was performed at the 1-year
follow-up in patients who remained on PD treatment. A simul taneous BIS was performed with a validated, commer-cially available, body composition monitor (BCM, Fresenius Medical Care). Peritoneal fluid does not influence BIS results significantly (20, 21). The measurement was made by attach-ing the pairs of electrodes to the ipsilateral hand and foot of the patient, in the supine position, with a full peritoneum. Due to its high reproducibility, only 1 measurement was made (22).
Collected variables included demographics (age, sex); clinical and analytical (glomerular filtration rate (GFR) (the mean of creatinine and urea clearance); daily residual diure-sis; 24-hour UF; daily fluid output; 24-hour urinary sodium; PD modality; serum albumin; ultrasensitive C-reactive protein (CRP); use of icodextrin; use of biocompatible solutions; etiol-ogy of ESRD; presence of diabetes; connective tissue disease; heart failure; hepatic disease; tumors or hypertension; Charl-son comorbidity score; use of diuretics; ACEi or ARB; cortico-steroids or β-blockers); peritoneal function (D/P creatinine, KT/V, UF at 60 min, UF at 4 hours, 24-hour peritoneal protein losses [PPL], mass transfer coefficient [MTAC] of urea, MTAC of creatinine, small pore ultrafiltration [SPUF], FWT, fraction of FWT); and body composition parameters (weight, height, body mass index [BMI], lean tissue index [LTI], fat tissue in-dex ([FTI], total body water [TBW], ECW, intra cellular water [(ICW)], OH, ECW/TBW and OH/ECW).
Patients were considered to be dehydrated or overhy-drated when their OH value was below the 10th or over the
90th percentile of the reference population, which translates
to OH <-1.1 L and OH >1.1 L (23). OH is further normalized through the OH/ECW ratio. Patients with OH/ECW >7% (90th
percentile of a healthy matched population) were also classi-fied as fluid overloaded. Patients with an OH/ECW >15% were considered to be severely fluid overloaded, which is associ-ated with higher mortality (24).
The MTAC of urea and creatinine was calculated by the Selgas et al model (25). FWT was calculated as: FWT (mL) = 60 min UF (mL) - SPUF (mL). SPUF (mL) = [NaR (mmol) × 1,000/ PNa (mmol), in which NaR is sodium removal and PNa is the plasma sodium concentration; NaR = [dialysate V at 60 min-utes (L) × dialysate Na at 60 minmin-utes (mmol/L)] – [dialysate V instilled (L) × dialysate Na at 0 minutes (mmol/L)]. Fraction of FWT(%) = FWT (mL) / 60 min UF (mL) x 100.
UFF was defined as the elimination of less than 400 mL dur-ing a 4-hour dwell-time peritoneal exchange with glucose 3.86% to 4.25%, performed under normal peritoneal conditions.
Statistics
Categorical variables are presented as frequencies; con-tinuous variables are presented as mean ± standard deviation for normally distributed variables, or median (interquartile range) otherwise. Shapiro-Wilk and a visual interpretation of distribution were used to establish normality. Pearson or Spearman tests were used to establish linear correlations. Student’s t-test, Fisher’s exact test, Chi-square and 1-way ANOVA were used to establish significant intergroup differ-ences in the baseline cohort. A comparison of highest versus lowest tertiles was used to illustrate significant differences. Paired Student’s t-test and Mann-Whitney-Wilcoxon tests
were used for the longitudinal cohort. Values of p<0.05 were considered significant. All the tests were performed using IBM SPSS v.23.
Results
Baseline study
Sample characterization
Sixty-one incident patients treated with PD (25 on automat-ed peritoneal dialysis (APD) and 36 on continuous ambulatory peritoneal dialysis [CAPD]) were included. Table I displays the most relevant demographic, biochemical, kidney/peritoneal function and bioimpedance data at baseline.
Only 3 patients were anuric (daily diuresis <100 mL), and 17 (28%) had UFF. Thirty patients (49.2%) were pre-scribed icodextrin, which was significantly more frequent in APD patients. All the patients were receiving solutions low in advanced glycation end products (AGEs). Sixteen patients (26.2%) were diabetic (2 type 1 diabetes mellitus [DM], and 14 type 2 DM). Eleven (18%) patients had congestive heart failure, 5 (8.2%) had chronic liver disease, 7 (11.5%) had a tumor, and almost all (95.1%) had arterial hypertension. Forty patients (65.5%) were using diuretics and 7 (11.5%) were tak-ing corticosteroids.
Fluid overload was present in 67.2% of the sample. Severe fluid overload was present in 36.1%. There were no signifi-cant differences in BIS results between sexes, modality of PD, use of icodextrin, diabetic and nondiabetic patients, anuric and nonanuric patients and patients with and without UFF. OH was higher and severe fluid overload was more frequent in patients with congestive heart failure.
Relationship between peritoneal function parameters
Water and small solute transport
There was a negative correlation between D/P creatinine and 4-hour UF (r = -0.462, p = 0.000). The patients in the low-est tertile of 4-hour UF had significantly higher D/P creatinine (0.76 ± 0.09 vs. 0.67 ± 0.07, p = 0.001) and higher MTAC cre-atinine (15.0 ± 5.1 vs. 11.3 ± 3.5 mL/min, p = 0.009), but no difference in MTAC urea. There was an even stronger correla-tion between D/P creatinine and FWT (r = -0.598, p = 0.000). The patients with the lowest FWT had higher D/P creatinine (0.78 ± 0.08 vs. 0.65 ± 0.07, p = 0.000) and higher MTAC cre-atinine (16.1 ± 4.8 vs. 9.9 ± 3.0 mL/min, p = 0.000), but no dif-ference in MTAC urea. The fraction of FWT was also inversely correlated with D/P creatinine (r = -0.446, p = 0.000). On the other hand, SPUF was not significantly correlated with any peritoneal function parameter.
Large molecule transport
Patients with higher than median peritoneal protein loss-es (PPL ≥6.2 g/24 h, n = 29) had slightly higher D/P creatinine (0.74 ± 0.09 vs. 0.69 ± 0.09, p = 0.035), MTAC creatinine (14.5 ± 4.8 vs. 11.7 ± 3.9 mL/min, p = 0.017) and MTAC urea (31.6 ± 7.9 vs. 27.6 ± 5.0 mL/min, p = 0.020). Yet, there was no direct
relationship between PPL, albumin or CRP and water trans-port.
Relationship between renal/peritoneal function and body composition parameters
No linear correlations were found between peritoneal sol-ute transport and BCP. There were no significant differences
TABLE I - Descriptive statistics of demographic, clinical, kidney/
peritoneal function and body composition parameters at baseline Parameter value Female sex 21 (34%) Age (years) 55.92 ± 15.00 Modality (CAPD/APD) 36/25 Weight (kg) 72 ± 15 BMI (kg/m2) 25 ± 4 GFR (mL/min) 8 ± 4 Daily diuresis (mL) 1612 ± 859 24-hour UF (mL) 371 ± 432
Daily fluid output (mL) 1982 ± 732
Serum albumin (g/dL) 3.50 (3.2-3.75)
CRP (mg/L) 2.9 (2.5-10.1)
Peritoneal protein loss (g/day) 6.58 ± 2.29
D/P creatinine 0.72 ± 0.09
Kt/V total 2.60 ± 0.53
60 min UF (mL) 320 ± 156
4-hour UF (mL) 558 ± 224
MTAC urea (mL/min) 29.78 ± 6.89
MTAC creatinine (mL/min) 13.16 ± 4.51
Small pore UF (mL) 237 ± 139
Free water transport (mL) 82 ± 62
OH (L) 2.05 ± 2.13
Lean tissue index (kg/m2) 13.4 ± 3.2
Fat tissue index (kg/m2) 10.8 ± 4.5
Total body water (L) 36.7
Extracellular water (L) 17.6
Intracellular water (L) 19.2
ECW/TBW (%) 48 ± 4
OH/ECW (%) 11 ± 11
Sample characterization at baseline. Categorical variables are presented as absolute (%). Continuous variables are presented as mean ± standard devia-tion if normally distributed and as median (interquartile range) otherwise. CAPD = continuous ambulatory peritoneal dialysis; APD = automated perito-neal dialysis; BMI = body mass index; GFR = glomerular filtration rate; UF = ultrafiltration; CRP = C-reactive protein; MTAC = mass transfer coefficient; OH = overhydration; ECW = extracellular water; TBW = total body water.
in overhydration indices between slow, slow-average, fast- average and fast transporters, as is evident in Figure 1. Neither GFR, daily diuresis, 4-hour UF, 24-hour UF, 24-hour urinary sodium nor daily fluid output were correlated with any of the BCP. Patients with a GFR ≥10 mL/min were significantly less overhydrated than those with a lower residual renal function (OH 1.17 ± 2.30 L vs. 2.41 ± 1.96 L, p = 0.036).
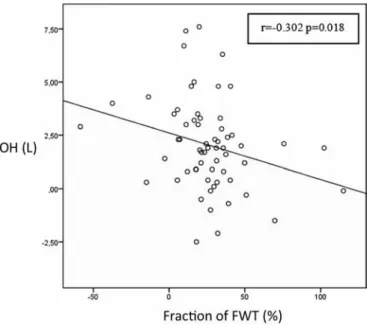
We found no differences in BCP among higher versus lower FWT, or among higher versus lower SPUF. Interestingly, we found differences in relation to the fraction of FWT. The fraction of FWT was negatively correlated with OH (r = -0.302, p = 0.018), and patients with a low fraction of FWT (<26%) had significantly higher OH (2.59 ± 2.20 vs. 1.45 ± 1.90 L, p = 0.034). Consequently, patients in the highest tertile of OH had a lower fraction of FWT (13.1 ± 24.6 vs. 31.5 ± 26.1%, p = 0.026). A scatter plot of fraction of FWT and OH is pre-sented in Figure 2. The fraction of FWT was also significantly correlated with the other fluid overload indices, ECW/TBW (r = -0.257, p = 0.046) and OH/ECW (r = -0.282, p = 0.028).
Peritoneal protein losses showed a direct significant cor-relation with OH (r = 0.287, p = 0.028), OH/ECW (r = 0.301, p = 0.020) and ECW (r = 0.317, p = 0.015). A scatter plot of peritoneal protein losses and OH is presented in Figure 3. Pa-tients with PPL >6.2 g/day had significantly higher OH (2.8 ± 2.1 vs. 1.3 ± 2.0 L, p = 0.007) and higher OH/ECW (14 ± 9 vs. 8 ± 11%, p = 0.017).
One-year follow-up longitudinal study
Of the 61 patients who participated in the baseline study, 19 had a 1-year follow-up evaluation. Of the ones who did not, 16 had not yet completed 1 year of treatment by the end of the study period, 11 received a kidney transplant, 5 were transferred to hemodialysis, 1 died and 9 had missing
data. Table II displays the significant changes in the variables of interest during the year of observation.
As with the baseline analysis, there was no bias accord-ing to modality. Only 1 of the 19 patients was anuric, and 6 (32%) had UFF at 1 year. In this small cohort, female patients had significantly lower D/P and MTAC creatinine, lower re-sidual diuresis, lower renal sodium excretion, higher PPL,
Fig. 3 - Scatter plot and line of best fit of OH and peritoneal
pro-tein losses. Plotted data (and line of best fit) of baseline overhy-dration (OH) and daily peritoneal protein losses, as calculated by bioimpedance spectroscopy and a 24-hour collection of dialysate effluent. There was a significant positive correlation between these parameters.
Fig. 2 - Scatter plot and line of best fit of fraction of free water
transport and OH. Plotted data (and line of best fit) of baseline overhydration (OH) and fraction of free water transport (FWT), as calculated by bioimpedance spectroscopy and a modified peritone-al equilibration test with peritoneperitone-al drainage at 60 minutes. There was a significant negative correlation between these parameters.
Fig. 1 - Boxplot of OH according to transport status. Boxplot of the
distribution of overhydration (OH) estimated by bioimpedance spec-troscopy according to peritoneal small solute transport, as determined by D/P creatinine in a 4-hour modified peritoneal equilibration test. There were no significant differences between groups. (Transport status definitions: fast D/P >0.80; fast-average D/P 0.65-0.80; slow-average D/P 0.55-0.64; slow D/P <0.55).
lower TBW, ECW and ICW, and higher ECW/TBW. There were no differences in peritoneal water transport or in OH or OH/ ECW between sexes. Diabetics had a higher FTI and no other differences relative to nondiabetics.
In this cohort, there was a negative correlation be-tween GFR and 1-hour UF (r = -0.476, p = 0.040), 4-hour UF (r = -0.613, p = 0.007), 24-hour UF (r = -0.596, p = 0.007) and PPL (r = -0.706, p = 0.001). There was no correlation between GFR and D/P creatinine.
After 1 year of treatment, we observed a significant de-crease in GFR of 1.8 mL/min (95% CI 0.3-3.2, p = 0.018), in daily diuresis of 556 mL (95% CI 279-834, p = 0.001) and in renal sodium excretion of 45.3 mmol/day (95% CI 18.7-71.8, p = 0.002). These decreases were accompanied by an increase in 24-hour UF of 275 mL (95% CI 465-83, p = 0.007).
We also detected a significant decrease in OH of 0.8 L (95% CI 0.1-1.5, p = 0.032), a decrease in OH/ECW of 4% (95% CI 0-7, p = 0.031), and an increase in serum albumin of 0.12 g/dL (95% CI 0.23-0.01, p = 0.037).
We detected no significant differences in peritoneal trans-port of water or solutes that could explain these changes. There were no significant differences in the other body com-position parameters.
Discussion
This study is the first to use calculated free-water transport obtained through a modified PET to try to establish a relation-ship between this parameter and hydration status estimated through multifrequency bioimpedance spectroscopy. We found that the parameter that best correlated with OH was the fraction of FWT, and that peritoneal protein losses also corre-lated with OH, among other observations that were consistent with known peritoneal transport dynamics. In the longitudinal evaluation, we found a significant improvement in hydration status but no differences in peritoneal water transport.
This significant negative correlation between OH and fraction of FWT has never been reported. As with previous studies, we were not able to establish this relationship with more obvious parameters, such as 24-h peritoneal UF, daily diuresis, total fluid output, use of icodextrin or PD modality (6, 26-28). Interestingly, we were not even able to establish this relationship with total FWT, perhaps because the effect of these parameters on hydration status is dependent on intake, which is neglected in this type of analysis. It appears that the fraction of FWT, which should be independent of intake, is more closely related to hydration status because it might represent less peritoneal fibrosis and an overall healthier peritoneum.
An inverse correlation between albumin and OH is well known (6, 26). Another original observation in our study was the association between higher PPL and poorer OH indices. It has been proposed that patients with greater inflamma-tion show a lower serum albumin, in part because of higher peritoneal protein losses (3). If this is the case, a local effect of silent inflammation and peritoneal hyperpermeability could be evoked. It is important to remember that these are associations; thus, we are unable to determine causality. In addition, we found no direct correlations of these markers of inflammation with water transport. A higher PPL might be associated with faster small solute transport and could be another indirect marker of lower peritoneal health.
Large cohort studies (6, 11) have previously been able to identify very small differences in isotope-dilution and BIS-determined overhydration according to transport status. We found no such differences in our small cohort, even when comparing fast transporters with slow and average trans-porters. However, there was a remarkable coherence in the relationships between solute and water transport. The fact that D/P creatinine and MTAC creatinine but not MTAC urea are inversely correlated with 4-hour UF and FWT reinforces the idea that medium- and large-sized solutes are responsible for keeping an osmotic gradient, which is the main factor for free water UF through aquaporins (29). On the other hand, no such correlation was found with SPUF, which is somewhat less dependent on this gradient. In summary, it appears that slower transporters of medium-sized molecules have better FWT but not significantly better SPUF.
It is well known that fluid overload is prevalent in HD and PD populations. We detected a high incidence of fluid overload, even higher than that observed in large cohorts such as EuroBCM (6), which is probably a consequence of the study design. We studied incident patients, who are pre-dictably more overhydrated, whereas EuroBCM is a cross-sectional study of prevalent patients on PD, and hydration status is expected to improve over time. The detected de-crease in OH, OH/ECW and the inde-crease in albumin after 1 year of PD translates precisely into an improvement in hydration and nutritional status, which is to be expected in this early period of dialytic treatment. Davies (30) described a stable UF during the first year, followed by a progressive decay thereafter as well as a regression to the mean val-ues of D/P creatinine. Lopes DM et al (31) found an increase in FWT over 1 year in incident PD patients with UFF, but not in those without UFF. We were not able to identify ei-ther these or any oei-ther changes in peritoneal transport
TABLE II - Significant differences in clinical, kidney/peritoneal
func-tion and body composifunc-tion parameters at the 1-year follow-up evaluation
Parameters mean ± SD Sig.
Δ GFR (mL/min) -1.9 ± 2.8 p = 0.023
Δ Daily diuresis (mL) -556 ± 551 p = 0.001
Δ Renal Na+ excretion (mmol/day) -45.3 ± 53.9 p = 0.002
Δ 24-h UF (mL) 274 ± 405 p = 0.014
Δ OH (L) -0.8 ± 1.5 p = 0.022
Δ OH/ECW (%) -4 ± 7 p = 0.025
Δ Albumin (g/dL) 0.1 ± 0.2 p = 0.032
Δ fraction FWT (%) 4.7 ± 30.2 p>0.05
Δ peritoneal protein losses (g/day) 0.14 ± 2.14 p>0.05 Data is presented as mean difference (Δ) ± standard deviation of variables that were significantly different at the 1-year follow-up evaluation. Negative differences represent a decrease, positive variations represent an increase. GFR = glomerular filtration rate; UF = ultrafiltration; OH = overhydration; ECW = extracellular water.
characteristics that could be related to this effect on hydra-tion status, possibly because of our small sample size and short follow-up period.
Although there was no linear correlation between residu-al renresidu-al function and overhydration, we did find that patients with a GFR ≥10 mL/min had significantly lower overhydration indices that those without. This effect was lost if the thresh-old was lowered. It may be that residual renal function con-tributes significantly to the hydration status up to a certain threshold, and that when it drops below that, other factors like aspects of the treatment or comorbidities take over as more important for hydration status.
Despite the correlations found between GFR and UF, and GFR and PPL in the 1-year cohort (but not in the baseline co-hort), we believe these may be skewed by confounders which are difficult to account for in such a small cohort.
This is an original study with a simple protocol and a good-sized baseline sample. Unfortunately, few patients proceeded to the 1-year follow-up evaluation, mostly because of the very high rate of kidney transplantation in our center, some transfers to HD, and a few deaths. Other limitations in the present study include the short follow-up period, the inability to quantify fluid and salt intake, the inability to quantify di-alysis glucose load and the use of sporadic daily diuresis and estimated daily UF, which are inherently inaccurate.
In conclusion, there is a poor relationship among kidney/ peritoneal function parameters, either joined or separately, with body composition parameters estimated by bioimped-ance spectroscopy. Hydration status is a complex concept to which many factors contribute. The fraction of FWT and peritoneal protein losses have been underestimated as markers of peritoneal health and the peritoneum’s ability to contribute to an adequate hydration status. Further studies are necessary to corroborate or refute this hypothesis and to explain the physiopathological mechanisms behind this observation.
Acknowledgments
The authors would like to express their gratitude to Juliette Siegfried at ServingMed.com for her linguistic review.
Disclosures
Financial support: This study has been supported in part with F.E.D.E.R. funds (REDinREN, RETICS, ISCIIII, Spanish Ministry of Health). Conflict of interest: None of the authors has financial interest related to this study to disclose.
References
1. Chamney PW, Wabel P, Moissl UM, et al. A whole-body model to distinguish excess fluid from the hydration of major body tissues. Am J Clin Nutr. 2007;85(1):80-89.
2. Moissl UM, Wabel P, Chamney PW, et al. Body fluid volume de-termination via body composition spectroscopy in health and disease. Physiol Meas. 2006;27(9):921-933.
3. Davies SJ, Davenport A. The role of bioimpedance and biomark-ers in helping to aid clinical decision-making of volume assess-ments in dialysis patients. Kidney Int. 2014;86(3):489-496. 4. Engel B, Davies SJ. Achieving euvolemia in peritoneal dialysis.
Perit Dial Int. 2007;27(5):514-517.
5. OLone EL, Visser A, Finney H, Fan SL. Clinical significance of multi-frequency bioimpedance spectroscopy in peritoneal dialysis patients: independent predictor of patient survival. Nephrol Dial Transplant. 2014;29(7):1430-1437.
6. Van Biesen W, Williams JD, Covic AC, et al; EuroBCM Study Group. Fluid status in peritoneal dialysis patients: the Euro-pean Body Composition Monitoring (EuroBCM) study cohort. PLoS One. 2011;6(2):e17148.
7. van Biesen W, Claes K, Covic A, et al. A multicentric, interna-tional matched pair analysis of body composition in peritoneal dialysis versus haemodialysis patients. Nephrol Dial Transplant. 2013;28(10):2620-2628.
8. Ronco C, Verger C, Crepaldi C, et al; IPOD-PD Study Group. Baseline hydration status in incident peritoneal dialysis pa-tients: the initiative of patient outcomes in dialysis (IPOD-PD study). Nephrol Dial Transplant. 2015;30(5):849-858.
9. Pillon L, Piccoli A, Lowrie EG, Lazarus JM, Chertow GM. Vector length as a proxy for the adequacy of ultrafiltration in hemodi-alysis. Kidney Int. 2004;66(3):1266-1271.
10. Brown EA, Davies SJ, Rutherford P, et al; EAPOS Group. Sur-vival of functionally anuric patients on automated peritoneal dialysis: the European APD Outcome Study. J Am Soc Nephrol. 2003;14(11):2948-2957.
11. Konings CJ, Kooman JP, Schonck M, et al. Effect of icodextrin on volume status, blood pressure and echocardiographic param-eters: a randomized study. Kidney Int. 2003;63(4):1556-1563. 12. Paniagua R, Ventura MD, Avila-Díaz M, et al. NT-proBNP, fluid
volume overload and dialysis modality are independent pre-dictors of mortality in ESRD patients. Nephrol Dial Transplant. 2010;25(2):551-557.
13. Rippe B, Venturoli D, Simonsen O, de Arteaga J. Fluid and electrolyte transport across the peritoneal membrane during CAPD according to the three-pore model. Perit Dial Int. 2004; 24(1):10-27.
14. Smit W, Schouten N, van den Berg N, Langedijk MJ, Struijk DG, Krediet RT; Netherlands Ultrafiltration Failure Study Group. Analysis of the prevalence and causes of ultrafiltration failure during long-term peritoneal dialysis: a cross-sectional study. Perit Dial Int. 2004;24(6):562-570.
15. Morelle J, Sow A, Hautem N, et al. Intersticial fibrosis restricts osmotic water transport in encapsulating peritoneal sclerosis. J Am Soc Nephrol. 2015;26(10):2521-2533.
16. Smit W, Struijk DG, Ho-Dac-Pannekeet MM, Krediet RT. Quan-tification of free water transport in peritoneal dialysis. Kidney Int. 2004;66(2):849-854.
17. La Milia V, Di Filippo S, Crepaldi M, et al. Mini-peritoneal equili-bration test: A simple and fast method to assess free water and small solute transport across the peritoneal membrane. Kid-ney Int. 2005;68(2):840-846.
18. Bernardo AP, Bajo MA, Santos O, et al. Two-in-one protocol: simultaneous small-pore and ultrasmall-pore peritoneal trans-port quantification. Perit Dial Int. 2012;32(5):537-544. 19. Coester AM, Smit W, Struijk DG, Parikova A, Krediet RT.
Longi-tudinal analysis of peritoneal fluid transport and its determi-nants in a cohort of incident peritoneal dialysis patients. Perit Dial Int. 2014;34(2):195-203.
20. Parmentier SP, Schirutschke H, Schmitt B, et al. Influence of peri-toneal dialysis solution on measurements of fluid status by bio-impedance spectroscopy. Int Urol Nephrol. 2013;45(1):229-232. 21. Caron-Lienert RS, Figueiredo AE, da Costa BP, et al. Evaluation
of body composition and fluid volume using a body composi-tion monitor: does intraperitoneal fluid matter? Perit Dial Int. 2014;34(4):456-458.
22. Wabel P, Chamney P, Moissl U, Jirka T. Importance of whole-body bioimpedance spectroscopy for the management of fluid balance. Blood Purif. 2009;27(1):75-80.
23. Wieskotten S, Heinke S, Wabel P, et al. Bioimpedance-based identification of malnutrition using fuzzy logic. Physiol Meas. 2008;29(5):639-654.
24. Wizemann V, Wabel P, Chamney P, et al. The mortality risk of overhydration in haemodialysis patients. Nephrol Dial Trans-plant. 2009;24(5):1574-1579.
25. Selgas R, Fernandez-Reyes MJ, Bosque E, et al. Functional longevity of the human peritoneum: how long is continuous peritoneal dialysis possible? Results of a prospective medium long-term study. Am J Kidney Dis. 1994;23(1):64-73.
26. Davison SN, Jhangri GS, Jindal K, Pannu N. Comparison of volume overload with cycler-assisted versus continuous am-bulatory peritoneal dialysis. Clin J Am Soc Nephrol. 2009;4(6): 1044-1050.
27. Wiggins KJ, Rumpsfeld M, Hawley CM, et al. Baseline and time-averaged fluid removal affect technique survival in peritoneal
dialysis in a non-linear fashion. Nephrology (Carlton). 2007; 12(3):218-223.
28. Davenport A, Willicombe M. Comparison of fluid status in patients treated by different modalities of peritoneal dialy-sis using multi-frequency bioimpedance. Int J Artif Organs. 2009;32(11):779-786.
29. Krediet RT, Struijk DG. Peritoneal changes in patients on long-term peritoneal dialysis. Nat Rev Nephrol. 2013;9(7):419-429. 30. Davies SJ. Longitudinal relationship between solute transport
and ultrafiltration capacity in peritoneal dialysis patients. Kid-ney Int. 2004;66(6):2437-2445.
31. Lopes DM, Rodríguez-Carmona A, Falcón TG, et al. Analysis of ultrafiltration failure diagnosed at the initiation of perito-neal dialysis with the help of peritoperito-neal equilibration tests with complete drainage at sixty minutes. A longitudinal study. Perit Dial Int. 2016;36(4):442-447.