Volume and Nutritional Status Evaluated by Bioimpedance Affected
by Body Positions
Biyoempedans Yöntemiyle Ölçülen S
ı
v
ı
ve Beslenme Durumu
Vücut Pozisyonundan Etkilenir
Ender HÜR1
Melih ÖZIŞIK2
Cihan URAL2 Şennur KÖSE3 İbrahim YILDIRIM1
Gürsel YILDIZ4
Kemal MAĞDEN1
Fehmi AKÇİÇEK2
Ali BAŞÇI5
Gültekin SÜLEYMANLAR6
Kenan ATEŞ7
Soner DUMAN2
1 Bülent Ecevit University Faculty of Medicine, Department of Nephrology, Zonguldak, Turkey
2 Ege University Faculty of Medicine, Department of Internal Medicine,
İzmir, Turkey
3 İstanbul Education and Research Hospital, Clinic of Nephrology,
İstanbul, Turkey
4 Atatürk State Hospital, Clinic of Nephrology, Zonguldak, Turkey 5 Ege University Faculty of Medicine,
Department of Nephrology,
İzmir, Turkey
6 Akdeniz University Faculty of Medicine, Department of Nephrology, Antalya, Turkey
7 Ankara University Faculty of Medicine, Department of Nephrology, Ankara, Turkey
Correspondence Address:
Ender HÜR
Bülent Ecevit Üniversitesi Tıp Fakültesi, Nefroloji Bilim Dalı, Zonguldak, Turkey Phone : + 90 532 246 24 87
E-mail : [email protected] Received : 03.07.2013 Accepted : 05.09.2013
ABSTRACT
OBJECTIVE: Body composition analysis is useful technique for assessing hydration, nutritional status and predicting clinical outcomes. Bioimpedance analysis (BIA) is a cheap and noninvasive tool for monitoring body composition but needs some improvements regarding measurement methods. We aimed to fi nd out if body position has an effect on the BIA results.
MATERIAL and METHODS: Personal characteristics including age, gender, height, weight and blood pressure were recorded. Hydration and nutritional status measured by body composition monitor in supine and standing positions consequently for each individual.
RESULTS: Two hundred and one populations from various region in Turkey, 61% (n: 123) male, mean age was 46.3±12 years (18-76) of age, participated in this crossectional study. From supine to standing positions overhydration and extracellular water (ECW) were increased from 0.04±1.08 and 17.69±2.92 to 0.46±1.05 L and 17.84±2.90 L while intracellular water (ICW) decreased from 22.55±4.35 to 22.04±4.28 L signifi cantly. Systolic and diastolic blood pressures were 131.3±18.1 and 75.1±12 decreased to 127.0±16.0 and 72.2±9.0 mmHg in supine to standing positions (p> 0.05).
CONCLUSION: Supine and standing positions could affect the volume parameters of BIA due to shift of ECW and ICW by gravity but nutritional parameters also changes signifi cantly. Protocols should be re evaluated in order to get more accurate results in bioimpedance measurements.
KEY WORDS: Bioimpedance spectroscopy, Extracellular water, Fluid shift, Overhydration
ÖZ
AMAÇ: Vücut kompozisyon analizi hidrasyon, beslenme ve klinik durumu göstermede yararlı bir tekniktir. Biyoempedans analizi (BIA) ucuz ve invazif olmayan bir yöntem olmakla birlikte ölçüm metodunun geliştirilmesi gereklidir. Amacımız BIA sonuçları üzerine vücut pozisyonunun etkisini bulmaktı.
GEREÇ ve YÖNTEMLER: Kişisel özellikler olan yaş, cinsiyet, boy, kilo ve kan basıncı değerleri kayıt edilmiştir. Her birey için yatarak ve ayakta hidrasyon ve beslenme durumunun değerlendirilmesi vücut kompozisyon monitörü ile ölçülmüştür.
BULGULAR: Türkiye’nin çeşitli bölgelerinden yapılan bu kesitsel çalışmaya yaş ortalaması 46.3±12 (18–76) yıl ve %61’i (n: 123) erkek olmak üzere toplam 201 olgu alınmıştır. Yatar pozisyondan ayakta yapılan ölçüme aşırı hidrasyon ve hücre dışı su (ECW) 0.04±1.08 ve 17.69±2.92 L’den 0.46±1.05 ve 17.84±2.90’a artmıştır. Bu arada hücre içi su (ICW) 22.55±4.35 L’den 22.04±4.28’e anlamlı olarak azalmıştır. Sistolik ve diyastolik kan basınçları 131.3±18.1 ve 75.1±12.0 mmHg’den 127.0±16.0 ve 72.2±9.0’a düşmüştür (p> 0.05).
SONUÇ: Yatarak ve ayakta yapılan ölçümlerde yerçekiminin etkisiyle ECW ve ICW arasında su geçişi nedeniyle BIA volüm ve beslenme göstergeleri etkilenebilir. Daha doğru biyoempedans ölçüm sonuçları elde etmek için ölçüm protokolleri yeniden gözden geçirilmelidir.
INTRODUCTION
Body composition analyzed by hydrometry (1, 2) underwater weighing (3,4) dual energy X-ray absorptiometry (5-7) estimates fat free mass (FFM). Disadvantages of these methods were overhydration (OH) could not be distinguished from FFM. Bioimpedance methods are powerful, inexpensive and analytic technique studying electrical properties of cells. Cell membrane has high impedance and depending on the frequency an alternate current may fl ow through the cell and quantifi cation of extracellular water (ECW) and total body water (TBW) possible (8). Overhydration could be calculated from the difference between the actual measured ECW and normal expected ECW. The model of body composition calculates fl uid overload and also normally hydrated adipose and normally hydrated lean tissue mass. Although plasma fl uid contains solutes and minerals, for all practical purposes the difference in volume between pure water and fl uid is negligible (9). Therefore, the terms fl uid status and hydration status may be used interchangeably.
Bioimpedance measurement protocol and individual biological factors are important for fi nding errors. Specifi cally, intra-individual biological factors could be infl uenced by body temperature, fl uid and electrolyte balance and skin contact resistance (9). While having subjects follow strict pretesting guidelines may reduce intra-individual biological errors, some potentially uncontrollable biological variations may still exist. In contrast, measurement protocol errors can be directly controlled. Even when all measurement protocols are standardized from one testing session to another, methodological errors may exist. The aim of the present study was to fi nd out effect of gravity on body fl uid distribution while supine and standing positions and at the same time to reveal more precise bioimpedance measurement protocols.
SUBJECTS and METHODS
Study design
A population-based study in Izmir, Denizli and Adana was performed. Subjects aged over 18 years were included in this study who gave informed consent to participate. Exclusion criteria were the presence of serious life-limiting co-morbid situations, like malignancy, uncontrollable infection, end-stage cardiac, pulmonary, or hepatic disease, pregnancy or lactating and the presence of pacemaker or defi brillator, artifi cial joints, pins or amputation.
The study was approved by Turkish Ministry of Health and was conducted in accordance with ethical principles of the Declaration of Helsinki; all patients provided written inform consent.
Sampling method
A random sampling was used to select the study participants. A sampling frame was defi ned as the three random cities of Turkey.
Field study
The data were collected through Turkish Population Renal Health Screening Programme organized by Turkish Society of Nephrology. Measurements and interviews of potential participants by specially trained fi eld study teams (Medical doctors, nurses, laboratory technicians). During interviews, the study questionnaire was included questions on subject demographics current diseases and drugs, family history, and other relevant medical history. In addition, height, weight, and blood pressure were measured. Blood pressure was measured from right arm in sitting position. Bioimpedance measurements performed in supine position and standing position by a trained medical doctor.
Laboratory assessment
Serum creatinine (alkaline picrate method) was used.
Measurement of overhydration
After measurement of body weight and height, and with subjects following voiding, bioimpedance spectroscopy (BIS) measured with the Body Composition Monitor (BCM) from Fresenius Medical Care, Deutschland GmbH. Four electrodes were placed on ipsilateral foot and hand, of supine and standing positions. Two electrodes were dorsally placed on the hand in the metacarpo-phalangeal articulations and in the corpus, respectively, 5 cm apart. The pair on the foot was located in the metatarso-phalangeal and in the articulation, 6 cm apart. The BCM analyses total body electrical impedance to an alternate current (0.2 mA) with fi fty different frequencies (5-1000 kHertz). First the ECW volumes and total body water are calculated via determining electrical resistances, then values of overhydration (OH), intracellular water, body mass index, lean tissue index, fat tissue index, body cell mass are provided by the BCM software.(10). Bioimpedance method calculates normal hydration status, the expected normal values for ICW and ECW that would result with healthy kidney function (normohydrated lean and adipose tissue). Because normal ICW or ECW can be determined for a given weight and body composition, fl uid overload can be calculated from the difference between the normal ECW expected and measured ECW.
The reference ranges are defi ned by the 10th and 90th percentiles of the reference population and are specifi c to age and gender (10).
Defi nitions
variables as numbers and percentages. Continuous variables were compared with the Independent Sample T test or Mann-Whitney U test and categorical variables were compared using Pearsons Chi-square test. Pearson and Spearman correlations were used for the linear relation between two numerical dates. P value of less than 0.05 was considered statistically signifi cant for all tests.
RESULTS
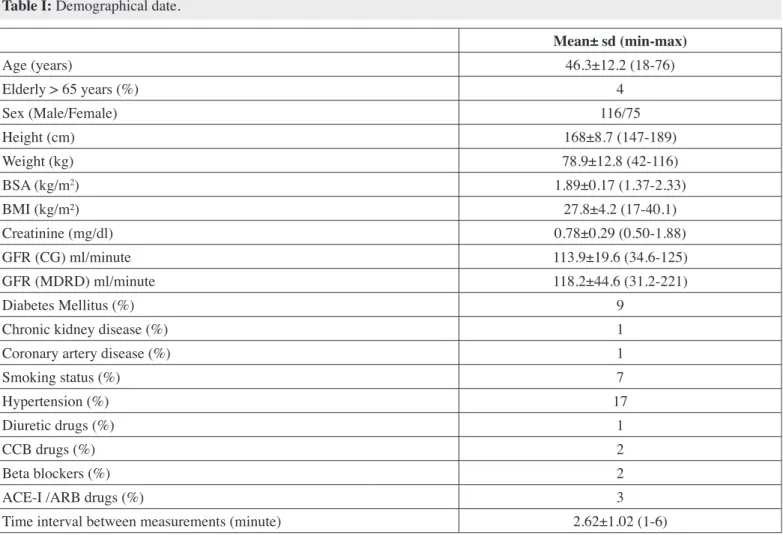
Two hundred and one populations from various regions in Turkey, 61% (n: 123) male, mean age was 46.3±12 years (18-76) of age, included in this cross-sectional study. Elderly group (> 65 years) was composed of 4% of population. Hypertension 17%, Diabetes mellitus 9%, smokers 7%, chronic kidney disease and coronary artery diseased patients were composed of 1% of study population (Table I).
From supine to standing positions OH and ECW were increased from 0.04±1.08 and 17.69±2.92 to 0.46±1.05 L and 17.84±2.90 L while ICW decreased from 22.55±4.35 to 22.04±4.28 L subjects in our study population, the last variable of the formula
was not used.
The fl uid volumes extracellular (ECW), intracellular (ICW) and total body water (TBW) were determined using the approach described by Moissl (10). The hydration status, lean tissue mass (LTM) and fat mass were calculated based on a physiologic tissue model described by Chamney (4). LTM and Fat were normalized to the body surface area to obtain lean tissue index (LTI = LTM/height2) and fat tissue index (FTI = Fat/height2). The values for LTI and FTI were compared to an age- and gender matched reference population (n = 1248) (12).
Body mass index (BMI) was calculated as weight (kg)/height (m2).
Statistical analysis
Statistical analysis was performed with SPSS 18.0 software (SPSS, Inc., Chicago, IL, USA). Continuous variables were expressed as mean ± standard deviation and categorical
Table I: Demographical date.
Mean± sd (min-max)
Age (years) 46.3±12.2 (18-76)
Elderly > 65 years (%) 4
Sex (Male/Female) 116/75
Height (cm) 168±8.7 (147-189)
Weight (kg) 78.9±12.8 (42-116)
BSA (kg/m2) 1.89±0.17 (1.37-2.33)
BMI (kg/m²) 27.8±4.2 (17-40.1)
Creatinine (mg/dl) 0.78±0.29 (0.50-1.88)
GFR (CG) ml/minute 113.9±19.6 (34.6-125)
GFR (MDRD) ml/minute 118.2±44.6 (31.2-221)
Diabetes Mellitus (%) 9
Chronic kidney disease (%) 1
Coronary artery disease (%) 1
Smoking status (%) 7
Hypertension (%) 17
Diuretic drugs (%) 1
CCB drugs (%) 2
Beta blockers (%) 2
ACE-I /ARB drugs (%) 3
Time interval between measurements (minute) 2.62±1.02 (1-6)
for preload decrease. Fluid dynamics is expected to contribute the ortostasis and needs to be proven in clinical studies. Until now volume studies needed impractical expensive dilution tests. Bioimpedance analysis provides noninvasive, practical and useful tool for the measurement of fl uid and nutritional parameters for normal population as well as end stage renal disease patients (13, 14).
We have conducted the largest study in the literature signifi cantly (Figure 1). Systolic and diastolic blood pressures
were 131.3±18.1 and 75.1±12.0 decreased to 127.0±16.0 and 72.2±9.0 mmHg in supine to standing positions (p> 0.05) (Table II).
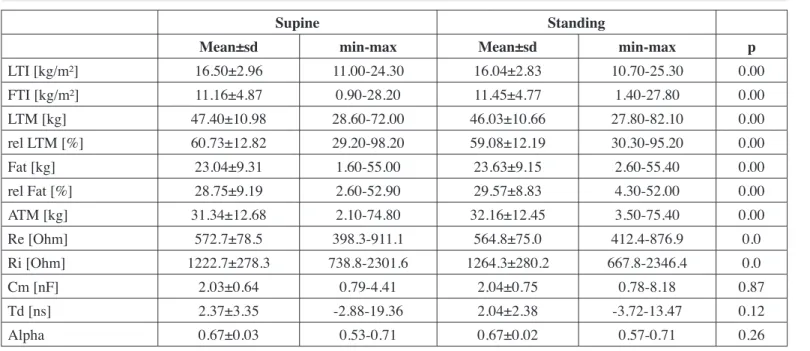
From supine to standing positions lean tissue index and lean tissue mass were decreased from 16.50±2.96 and 47.40±10.98 to 16.04±2.83 and 46.03±10.66 while fat tissue index and adipose tissue mass increased from 11.16±4.87 and 31.34±12.68 to 11.45±4.77 and 32.16±12.45 signifi cantly (Table III, Figure 2).
DISCUSSION
Orthostatic mechanism includes decreases in cardiac preload (venous return), cardiac fi lling pressure, and output. With normal regulatory capability, arterial pressure remains unaltered or may even slightly increase. The most important issue for this mechanism is to reveal the etiological factors
Figure 2: Three Compartment Model of Bioimpedance Measurements OH: Overhydration; LTM: Lean tissue mass; ATM: Adipose tissue mass.
Figure 1: Body Fluid Parameters of Bioimpedance Measurements ECW: Extracellular water; ICW: Intracellular water.
Table II: Body fl uid parameters of bioimpedance measurements.
Supine Standing
Mean±sd min-max Mean±sd min-max p
OH [L] 0.04±1.08 -3.60-3.80 0.46±1.05 -3.60-4.10 0.00
SBP [mmHg] 131.3±18.1 99.0-182.0 127.0±16.0 99.0-174.0 0.1
DBP [mmHg] 75.1±12.0 19.0-109.0 72.2±9.0 50.0-109.0 0.1
TBW [L] 40.25±6.98 23.50-57.30 39.88±6.94 24.10-61.50 0.00
ECW [L] 17.69±2.92 10.30-25.20 17.84±2.90 10.40-25.00 0.00
ICW [L] 22.55±4.35 13.20-32.50 22.04±4.28 13.30-37.20 0.00
E/I 0.79±0.08 0.56-1.03 0.82±0.08 0.64-1.03 0.00
model. Scharfetter et al investigated whether postural changes cause artifacts in the volume data measured with a commercial BIS system. They used a tilt table experiments with 11 healthy cases with the bioimpedance device with (5 to 500 kHz) frequencies. The measurements were done 30 minutes resting in a supine position after standing; then 30 minutes 70 degrees head up tilt; and fi nally a 30-minute resting period in a supine position. They found that a steady state could not be reached within 30 minutes. During fi rst phase the ECW decreased, in the tilt phase it increased, and in fi nal phase it decreased again. The ICW changes measured in the opposite way of ECW. More importantly they revealed legs contribute signifi cantly to the measured volume changes by segmental measurements. They concluded that the measured volume changes attributed to artifacts that were caused by extracellular fl uid redistribution. Furthermore, it appears unlikely that the measured fl uid shifts actually occur between ECW and ICW in the absence of osmotic changes in the body fl uids (16).
Fenech et al. measured ECW and ICW using bioimpedance spectroscopy (5-1000 kHz) in 15 healthy subjects. The subject, who had been supine for 1 hr, sat up in bed for 10 min and returned to supine position for another hour. They found resistance and
fl uid volume values were not affected by a temporary position change (17).
Some fl uid shifts toward the lower body during standing. Depending on the duration of standing, when a healthy person stands, 10–15% (650–700 ml in a person weighing 70–80 kg) of blood is rapidly pooled in the legs. LBNP of 40 mmHg causes demonstrating fl uid shifts in relation to body position.
Fenech et al conducted a study including 8 patients with 11 tests in supine and sitting positions and proposed position changes sitting up from supine temporarily affects the extra and intracellular water contents. It was shown that resistance of ECW decreased instantaneously by an approximately 2.3% when the patient sits up, due to interstitial and plasma fl uid shift into the lower limbs which decreases leg resistance, the major contributor to total resistance. This drop in resistance attributed to the device Xitron 4200 impedance meter used for that study with averages 235 ml. Although this effect completely reversible and both ECW resistance and fl uid volume rapidly resumed, their normal course when the patient returned to their initial positions. They also shown no signifi cant variation in ICW resistance in any of the patients at the position change and they conclude that segmental impedance, which has been proposed to minimize this artifact, is not advisable in dialysis monitoring (15).
Number of the study cases and also single frequency bioimpedance device may limit the results related to ICW which may expect to be decreased. In our study we demonstrated the decrease of ICW with the increase of ECW in standing position. Mean ECW increased by 150 ml and ICW decreased by 510 ml from supine to standing positions. This difference may be attributable to fl uid shift from ICW to ECW and interstitial space.
The tissue electrical parameters were estimated by using a Cole-Cole model to the bioimpedance data. These parameters were used for the estimation of ICW and ECW with a fl uid distribution
Table III: Nutritional parameters of bioimpedance measurements.
Supine Standing
Mean±sd min-max Mean±sd min-max p
LTI [kg/m²] 16.50±2.96 11.00-24.30 16.04±2.83 10.70-25.30 0.00
FTI [kg/m²] 11.16±4.87 0.90-28.20 11.45±4.77 1.40-27.80 0.00
LTM [kg] 47.40±10.98 28.60-72.00 46.03±10.66 27.80-82.10 0.00
rel LTM [%] 60.73±12.82 29.20-98.20 59.08±12.19 30.30-95.20 0.00
Fat [kg] 23.04±9.31 1.60-55.00 23.63±9.15 2.60-55.40 0.00
rel Fat [%] 28.75±9.19 2.60-52.90 29.57±8.83 4.30-52.00 0.00
ATM [kg] 31.34±12.68 2.10-74.80 32.16±12.45 3.50-75.40 0.00
Re [Ohm] 572.7±78.5 398.3-911.1 564.8±75.0 412.4-876.9 0.0
Ri [Ohm] 1222.7±278.3 738.8-2301.6 1264.3±280.2 667.8-2346.4 0.0
Cm [nF] 2.03±0.64 0.79-4.41 2.04±0.75 0.78-8.18 0.87
Td [ns] 2.37±3.35 -2.88-19.36 2.04±2.38 -3.72-13.47 0.12
Alpha 0.67±0.03 0.53-0.71 0.67±0.02 0.57-0.71 0.26
REFERENCES
1. Schloerb PR, Friis-Hansen BJ, Edelman IS, Solomon AK, Moore FD: The measurement of total body water in the human subject by deuterium oxide dilution; with a consideration of the dynamics of deuterium distribution. J Clin Invest 1950; 29: 1296-1310
2. Schoeller DA: Isotope dilution methods. In: Bjorntorp P, Brodoff BN (eds), Obesity. New York, NY: Lippincott, 1991;80-88
3. Siri WE: The gross composition of the body. In: Tobias CA, Lawrence JH (eds), Advances in Biological and Medical Physics Vol.4. NewYork, NY: Academic, 1956; 239-280
4. Going SB: Densitometry. In: Roche AF, Heymsfi eld SB, Lohman TG (eds), Human Body Composition. Champaign, IL: Human Kinetics 1996; 3-23
5. Mazess RB, Barden HS, Bisek JP, Hanson J: Dual-energy X-ray absoptiometry for total-body and regional bone-mineral and soft-tissue composition. Am J Clin Nutr 1990; 51: 1106-1112
6. Slosman DO, Casez JP, Pichard C, Rochat T, Fery F, Rizzoli R, Bonjour JP, Morabia A, Donath A: Assessment of whole-body composition with dual-energy x-ray absorptiometry. Radiology 1992; 185: 593-598
7. Fuller NJ, Laskey MA, Elia M: Assessment of the composition of major body regions by dual-energy x-ray absorptiometry (DEXA) with special reference to limb muscle mass. Clin Physiol 1992; 12: 253-266
8. Matthie JR: Bioimpedance measurements of human body composition: Critical analysis and outlook. Expert Rev Med Devices 2008; 5(2): 239-261
9. Chamney PW, Wabel P, Moissl UM, Muller MJ, Bosy-Westphal A, Korth O, Fuller NJ: A whole-body model to distinguish excess fl uid from the hydration of major body tissues. Am J Clin Nutr 2007; 85: 80-89
10. Moissl UM, Wabel P, Chamney PW, Bosaeus I, Levin NW, Bosy-Westphal A, Korth O, Müller MJ, Ellegård L, Malmros V, Kaitwatcharachai C, Kuhlmann MK, Zhu F, Fuller NJ: Body fl uid volume determination via body composition spectroscopy in health and disease. Physiol Meas 2006; 27(9): 921-933
11. Levey AS, Bosch JP, Lewis JB, Greene T, Rogers N, Roth D: A more accurate method to estimate glomerular fi ltration rate from serum creatinine: A new prediction equation. Modifi cation of Diet in Renal Disease Study Group. Ann Intern Med 1999; 130: 461-470
12. Wieskotten S, Heinke S, Wabel P, Moissl U, Becker J, Pirlich M, Keymling M, Isermann R: Bioimpedance-based identifi cation of malnutrition using fuzzy logic. Physiol Meas 2008; 29: 639-654
13. Hur E, Usta M, Toz H, Asci G, Wabel P, Kahvecioglu S, Kayikcioglu M, Demirci MS, Ozkahya M, Duman S, Ok E: Effect of fl uid management guided by bioimpedance spectroscopy on cardiovascular parameters in hemodialysis patients: A randomized controlled trial. Am J Kidney Dis 2013; 61:957-965
14. Hur E, Gungor O, Asci G, Demirci M.S, Kayikcioglu L.M, Kahvecioglu S, Usta M, Duman S, Toz H, Ok E: Hemodiyaliz hastalarında hipervoleminin gösterilmesinde biyoimpedans Spektroskopinin Yeri. Turk Neph Dial Transpl 2011; 20(3): 235-240 similar fl uid shifts as during standing fl uid shifts toward the
lower body during standing (18).
Tagliabue et all investigated the differences in the relationship between multi-frequency impedance and body-water compartments TBW and ECW measured by dilution techniques in Italian and Dutch healthy subjects aged 19-41 years. In body build between the two groups the main differences were height, trunk length and the two ratios TBW/height and ECW/height. Population-specifi c prediction formulas for ECW (at 1 kHz) and TBW (at 100 kHz) were developed. The prediction errors for ECW and TBW were about 0.6 and 1.5 kg respectively, in both groups. They concluded the water distribution between the extra- and intracellular compartments was the major cause of error in the prediction of body water, and in particular of ECW from impedance measurements with a population-specifi c equation (19). Deurenberg et all found that different, more slender body build lead overestimation of ECW of the Ethiopians population. That study indicates that the validity of predicted body water from impedance depends on the body build of the subjects, which should be taken into account to avoid systematic errors when applying prediction formulas from a reference population to another population under study (20). Bartz et all showed ECW measured by multi-frequency impedance was underestimated in males and slightly overestimated in females of Indonesian people and concluded that the validation in a larger group of related population subjects needed (21). But at the same time it has been discovered that OH, as determined by ECW/Height, is highly predictive of clinical disease. ECW/height, correlated well with volume overload as assessed by echocardiography in PD patients (22, 23). In the present study there was no obvious relationship between OH and blood pressure but this might be expected because OH is calculated from the difference between the measured ECW and that expected, refer to patients of same age and sex but they don’t take into account racial differences. In three-compartment model measured by bioimpedance, body weight composed of adipose tissue mass (ATM), lean tissue mass (LTM) and OH. In present study from supine to standing position OH and ATM increased but LTM decreased. This nutritional parameters change may be effected by ECW and ICW changes in relation to body position.
20. Deurenberg P, Wolde-Gebriel Z, Schouten FJ: Validity of predicted total body water and extracellular water using multifrequency bioelectrical impedance in an Ethiopian population. Ann Nutr Metab 1995; 39(4): 234-241
21. Bartz M, Küpper J, Schultink W, Lukito W, Deurenberg P: Validation of predicted total body water and extracellular water by multi-frequency impedance in young Indonesian adults. Ann Nutr Metab 1998; 42(3): 119-126
22. Demirci MS, Demirci C, Ozdogan O, Kircelli F, Akcicek F, Basci A, Ok E, Ozkahya M: Relations between malnutrition-infl ammation-atherosclerosis and volume status. The usefulness of bioimpedance analysis in peritoneal dialysis patients. Nephrol Dial Transplant 2011; 26(5): 1708-1716
23. Hur E, Gungor O, Musayev O, Usta M, Toz H, Asci G, Ozkahya M, Duman S, Ok E: Bioimpedance spectroscopy for the detection of hypervolemia in peritoneal dialysis patients. Adv Perit Dial 2011; 27:65-70
15. Fenech M, Jaffrin MY, Malmen U: Reversibility of artifacts of fl uid volume measurements by bioimpedance caused by position changes during dialysis. Int J Artif Organs 2002; 25(3): 217-222
16. Scharfetter H, Monif M, László Z, Lambauer T, Hutten H, Hinghofer-Szalkay H: Effect of postural changes on the reliability of volume estimations from bioimpedance spectroscopy data. Kidney Int 1997; 51(4): 1078-1087
17. Fenech M, Jaffrin MY: Extracellular and intracellular volume variations during postural change measured by segmental and wrist-ankle bioimpedance spectroscopy. IEEE Trans Biomed Eng 2004; 51(1): 166-175
18. Goswami N, Loeppky JA, Hinghofer-Szalkay H: LBNP: Past protocols and technical considerations for experimental design. Aviat Space Environ Med 2008; 79(5): 459-471