infrared thermal images
Ricardo Vardasca1, 2, Lucia Vaz3, Joaquim Mendes4 1
LABIOMEP, UISPA-LAETA-INEGI, Faculdade de Engenharia, Universidade do Porto, Rua Dr. Roberto Frias S/N, 4200-465 Porto, Portugal
2
Medical Imaging Research Unit, Faculty of Computing, University of South Wales, Trefforest Campus, Pontypridd, Rhondda Cynon Taff, CF37 1DL, Wales, United Kingdom
3
Faculdade de Engenharia, Universidade do Porto, Rua Dr. Roberto Frias S/N, 4200-465 Porto, Portugal
4
LABIOMEP, UISPA-LAETA-INEGI, Faculdade de Engenharia, Universidade do Porto, Rua Dr. Roberto Frias S/N, 4200-465 Porto, Portugal
Abstract. Medical Infrared Thermal Imaging (MITI) is a technique that allows to record skin surface temperature distribution, in a completely safe and innocuous manner. These images provide underlining physiological in-formation on the blood flow, vasoconstriction/vasodilatation, inflammation, transpiration or other processes that can contribute to the skin temperature. This medical imaging mo-dality has been available for nearly six decades and proved to be useful for vascu-lar, neurological and musculoskeletal conditions. Since the recordings are digital, in a form of a matrix of numbers (image), it can be computationally analyzed, by a specialist mostly performing operations of processing and analysis manually sup-ported by proprietary solutions of software. This limits the number of images that can be processed, making difficult the evolution of knowledge, expertise devel-opment and information sharing. This chapter aims to disclose the medical imag-ing method, along with its particularities, principles, applications, advantages and disadvantages. Introducing all available classification and decision making meth-ods that can be employed in digital information along with a literature review of their operation in the biomedical applications of Infrared Thermal Imaging.
Keywords: Biomedical applications, Classifiers, Data-mining, Infrared thermal imaging, Medical thermography
1
Introduction
Thermography is an imaging technique that can record remotely the tempera-ture distribution of a surface. In the scope of this publication, it is applied to the human body and its largest organ, the skin, which makes the interface between the inners structures and the surrounding environment.
It is aim of this work to briefly introduce the history of MITI, the physical prin-ciples of infrared thermography, the operational aspects of its application in medi-cine, the different data-mining classifiers. The considered for this overview were: Artificial Neural Network (ANN), Support Vector Machine (SVM), k-Nearest Neighbor (k-NN), Naïve Bayes (NB) and Adaboost, along with their usage to la-bel MITI data found on PUBMED and SCOPUS literature sources, the chapter is finalized with a final discussion about the strengths, weaknesses and opportunities of applications of intelligent data classifiers to MITI data.
1.1 Classification in Bio-Apps
The MITI applications have been growing since its first introduction in 1956, with the development of classification methods to classify data, which reduce hu-man error and are able to deal with large amounts of data, this work intends to first provide an overview of the MITI technique and its applications that have used da-ta classifiers to improve the outcomes. Future challenges in this research area are outlined.
1.2 Historical perspective
The Skin temperature can be intended as a physiological aspect and indicator of human body that is related with healthy or pathological state. Hippocrates is known for being the father of conventional medicine. He also performed what can be called the first registry of skin temperature using mud baths, the warmer re-gions would dry firstly than the cold, and stated the sentence “In whatever part of the human body, excess of heat or cold is felt, the disease is there to be discov-ered” (Qi and Diakides 2007).
In 1800 Sir William Herschel, a German born British astronomer, who attracted by the Sir Isaac Newton experiment, in exposing white light through a glass prism resulting in a colored rainbow, decided to measure the temperatures of those rain-bow colors with thermometers, having found that the color presenting the highest temperature value was the red and beyond this color there was an invisible light with a highest temperature value, being this way discovered the infrared radiation. Sir John Herschel, son of William, in 1840 performed the first image of thermal radiation when focusing solar radiation with a lens into a suspension of carbon
particles in alcohol, this technique was called evaporography and the resulting im-age, a thermogram (Ring 2007).
The bolometer, an instrument that is able to determine the power of incident electromagnetic radiation through the heating of a material with a temperature-dependent electrical resistance, was invented in 1880 by Samuel Langley. This device become a very sensitive thermometer, its discoverer claimed that it could estimate the heat irradiated by a cow that is at 400 meters’ distance (Richards 1994). In the development of thermal cameras this sensor was very relevant.
A Hungarian physicist, Kálmán Tihanyi, in 1929 invented in Britain the first infrared camera as a night vision instrument to be used for anti-aircraft defense (Lisowska-Lis et al. 2011). A few years later, the evaporograph (can be intended as the first conventional IR camera), was developed for military use only by Mari-anus Czerny (German physicist). The first thermograph device using a 16-inch searchlight reflector, a dual axis scanner, and a bolometer detector was built by the US Army in 1952 (Lloyd 2013).
The first known application of usage of a thermographic system in medicine examining the human body skin temperature was performed by Ray Lawson (Ca-nadian physician) in 1956, when he used an evaporograph to assess the tempera-ture distribution of a breast cancer (BC) malignant tumor (Lawson 1956).
In the proceedings of the first conference in New York about Thermography and its clinical applications in 1963, Lloyd Williams, a British physician, pro-posed as research areas of interest and application for medical thermography: breast disease, burns, peripheral vascular disease, varicose veins, vasomotor con-trol, thyrotoxicosis and rheumatoid arthritis (Williams 1964).
Medical Infrared Thermal Imaging (MITI) is a medical imaging modality that records large areas of surface skin temperature not involving any contact or in-duced radiation, being a fast exam and innocuous to the patient. It allows to moni-tor physiology in real-time providing a window for the autonomic nervous system (Jones and Plassmann 2002, Ring and Ammer 2000, Ring and Ammer 2012).
2
Infrared imaging
2.1 Physical principles
This imaging technique relies in the principles of thermal physics, which are now described.
Maxwell demonstrated the existence of electromagnetic waves in free space and media. These waves in free space can be classified by their frequency and wavelength and related with the free space propagation of the velocity of light. The electromagnetic radiation frequency is given by the equation 1:
! =#
ℎ (1)
, where f is the frequency, E is the energy and h is the Planck’s constant (6.6 x 10⁻³⁴ J.s).
The frequency obtained by the equation (1) of emission or absorption of radia-tion is generated by transiradia-tions from one energy level to another (Thomas 1999).
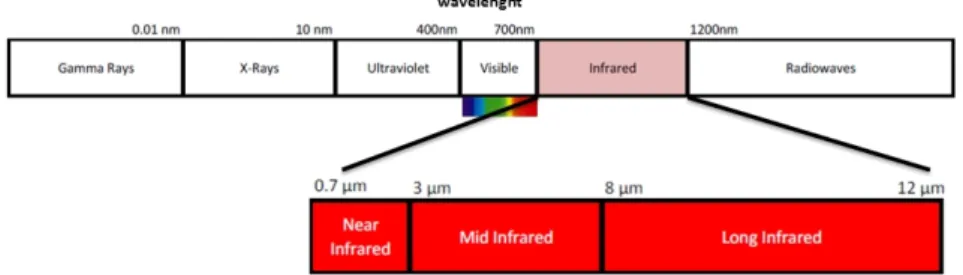
The electromagnetic spectrum is a representation of the characteristic distribu-tion of electromagnetic radiadistribu-tion emitted or absorbed by a particular object in terms of frequency, wavelength and photon energy. Fig. 1, on the top, represents the regions of the spectrum, on the left with higher frequency, lower wavelength and lower photon energy are the Gamma rays; and on the opposite side with lower frequency, higher wavelength and higher photon energy are the Radio waves. The human eyes can only perceive the visible region of the electromagnetic spectrum (wavelength from 0.7 to 0.4 µm), the Infrared spectrum is located immediately at the right of the visible region and can be divided in three sub-regions (fig. 1 bot-tom): Near Infrared (wavelength from 0.7 to 3 µm), Mid Infrared (wavelength from 3 to 8 µm) and Long Infra-red (wavelength from 0.7 to 3 µm).
Fig. 1 Electromagnetic spectrum with emphasis in the infrared, distributed by wavelength.
Any object at a temperature above absolute zero has the ability of emitting electromagnetic radiation. This works through converting the object's thermal en-ergy into electromagnetic enen-ergy, or thermal radiation. Through the electromag-netic spectrum, all objects in it have the ability to emit and absorb electromagelectromag-netic radiation. A blackbody is an ideal object that absorbs all incident electromagnetic radiation, at all wavelengths, and at a uniform temperature, being the best possible thermal radiator, having in consideration the Kirchhoff’s Law, which establishes an equity between the amount of absorption and the amount of emission.
All matter absorbs electromagnetic radiation until a certain degree. A black-body emission, also called blackblack-body radiation, has the particular characteristic of the frequency distribution depending only on the temperature. This blackbody
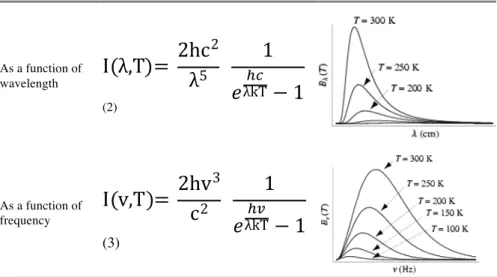
ra-diation can be described though three physical laws: Planck’s rara-diation law, Wien’s displacement law and Stefan-Boltzmann formula. The amount of energy emitted by a black body in radiation of a certain wavelength (equation 2) or fre-quency (equation 3) is given by the Planck’s law, which has two forms as repre-sented in table 1.
Table 1. The Planck Law represented by formula and graph as function of electromagnetic radiation wave-length and frequency. Being "I" the energy per unit time (or the power) radiated per unit area of emitting surface in the normal direction per unit solid angle per unit ("λ" – wavelength, "v" – frequency) by a black body at temperature "T". "h" is the Planck constant, "c" is the speed of light in a vacuum (299792458 m/s) and "k" is the
Boltzmann constant (1.3806488(13) × 10−23 J K−1). As a function of wavelength
I λ,T =
2hc
2λ
51
,
λkT-.− 1
(2) As a function of frequencyI v,T =
2hv
3c
21
,
λkT-.− 1
(3)The Planck’s law provides the amount of radiated energy by a blackbody at all frequencies, their intensity rapidly bear to zero for high and low frequencies or short and long wavelengths. This means that at room temperature, a blackbody does not emit any radiation in the visible spectrum range.
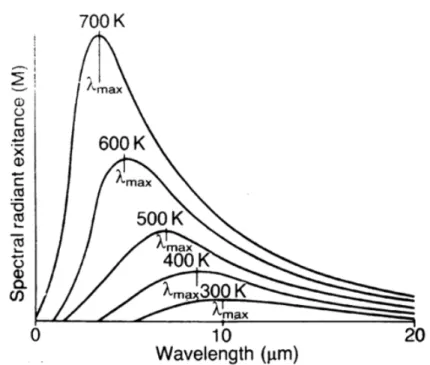
The Wien’s displacement law is represented by the equation 4:
λ
"#$=
(b(4)
, where λmax corresponds to the wavelength were maximum intensity of the radiation produced by a blackbody occurs, b is the Wien's displacement constant (2.8977721(26) × 10−3 m . K) and T is the known temperature.
The fig. 2 represents the maximum amount of radiation (λmax) per wave-length calculated by Wien’s displacement law based on its temperature.
E = ε σ &'
(5) , where E is the total radiated energy from a blackbody [W m2], e is the emis-sivity value, σ is the Stefan-Boltzmann constant [5.6696 x 10⁻⁸ W m-2 K-4] and T the absolute temperature. The E represents the total radiated energy from a black-body, per unit area and time, being proportional to the fourth power of its absolute temperature. The vast majority of the existing radiation thermometers are based in this equation.
Fig. 2 Wien's displacement law representing the maximum amount of ra-diation per wavelength.
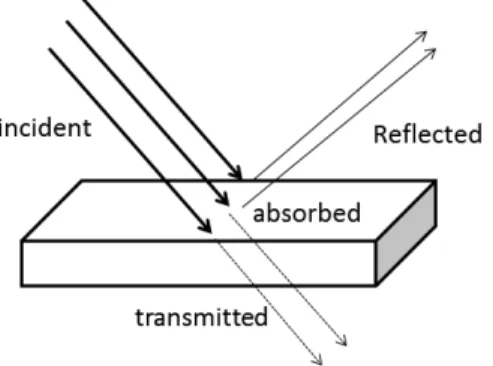
Real objects differ from the blackbody formulae over an extended wave-length region, despite that in certain spectral intervals they can approach a blackbody be-havior. There are three important factors, represented by fig. 3, to take in consid-eration (Thomas 1999):
Spectral absorption (α) – where a portion of the incident radiation on an object can be absorbed, originating as a result the ratio between the spectral radi-ant power absorbed by an object to the incident radiation on it.
Spectral reflectance (ρ) – where a portion of the incident radiation on an object can be reflected, originating as a result the ratio between the spectral radiant power reflected by an object to the incident radiation on it.
Spectral transmittance (τ) – where a portion of the incident radiation on an object can be transmitted, originating as a result the ratio between the spectral radiant power transmitted through an object to that radiation incident on it.
The relationship between these processes is of such importance that they should always be added up to the whole at any wavelength (Kirchhoff’s law) in order to correct the measured/calculated temperature.
Fig. 3 The alternative pathways of radiation falling in an object surface. By the Kirchhoff’s law equation (6):
α + ρ + τ = 1 (6)
, which establishes an equilibrium between the processes, for opaque materials, where τ = 0, the equation can be simplified to (7):
α + ρ = 1 (7)
When estimating the temperature of an object returning contact, the knowledge of the emissivity value of this object is of extreme importance. The emissivity of an object is the ratio of the radiant emission produced by an object by that of a black body at a specific temperature, its value varies between 0 and 1 and is influ-enced by the color, shape and surface of the object. This parameter considerably affects the accuracy of the measurement. A perfect black body has 1 as emissivity value, being considered a perfect emitter. For highly reflective objects, the emis-sivity value tends to zero. A surface that reflects infrared energy has an emisemis-sivity value of less than 1, constant with wave-length, is considered a grey body, and its total radiated energy can be obtained adjusting the object emissivity in Stefan-Boltzmann, equation 5 (Thomas 1999).
Infrared camera image file formats are all proprietary and besides storing the radiometric reading per each array sensor element, they store other data such as the equipment name, serial number, date, time, focal length, emissivity, object
dis-tance, reflected apparent temperature, atmospheric temperature, relative humidity, camera temperature range, field of view, focus distance, 5 Planck constants (R1, B, F, R2 and O) and matrix of radiometric values that corresponds to the sensor array size.
Per each infrared sensor, a voltage is perceived from the thermal energy detect-ed and quantifidetect-ed in a 16-bit number, which will be the radiometric measurement value.
Based in these values, and for obtaining the temperature, the raw reflection temperature (Reflt) has be calculated according with the equation 8:
!"#$% = !1
!2* ",-./-01230- 0-45-62-7+ - 9
-:
(8) Along with this value, since the emissivity value for the human skin is < 1, be-ing worldwide accepted the value of 0.98, it is needed to calculate the correct ob-ject raw radiometric value (S), with the equation 9:
! = ( %&'()*+,%(- %&.- 1 − 2*(33(4(,5 *%+78,)
2*(33(4(,5 (9)
With the raw reflection temperature and the object raw radiometric value, the pixel value, which corresponds to a single sensor, the estimated temperature can be obtained with the equation 10:
!"#$"%&'(%" (+) = .
ln( 113 + 5 + 1) (10)
This temperature can be translated from SI unit to the most common unit, Cel-sius (ºC), by the equation 11:
!"#$"%&'(%" ˚+ = 273.15-!"#$"%&'(%" (5) (11)
2.2 Operational aspects in medicine
The imaging concept of generating temperature in infrared images was just de-scribed before, for a valid medical thermal examination, a strict image capture protocol has to be followed (Ring and Ammer 2012). It consists of preparation of the examination room, preparation of the capture equipment, preparation of the subject before and during the accomplishment of the collection of the images and the way of capturing and storing them.
In the existing literature, there is a gap of reference values in the distribution of normal and pathological values of skin temperature in humans. Infrared thermal imaging, unlike any other medical imaging modality such as digital radiology, does not yet have a set of globally accepted standard positions to improve the quality of assessments and increase its usage. Although it is obvious that the standardization of the technique would reduce substantially the errors. Literature describe the reproducibility of the technique only vaguely (Ammer 2003).
There are environmental conditions that can affect the examination outcomes, those are: room temperature, relative humidity and air circulation flow, as well as the examination room intrinsic conditions (e.g. false ceilings where air may be fil-tered and no direct airflow is projected towards the subject, double glazed win-dows and illumination).
Patient preparation and clothing have an influence in the measurements, which can be addressed through pre-examination acclimatization period. The imaging system has to comply to quality assurance requirements to avoid affecting the pro-cess of acquiring the image (Ring et al. 2007). The use of regions of interest (ROI) masks strengthens the quality of data collection, also facilitating the correct posi-tioning and distance between equipment and the subject being examined, as well as the adjustment to the size and position of the ROI. All these aspects must be taken into consideration in order to homogenize the image capture and analysis process in order to make comparisons possible and allow the generation of refer-ence data (Ring et al. 2004), otherwise it has to be achieved by image processing techniques that have an associated error.
In the UK, a project had a goal of building a reference images database of the distribution of skin temperature in ROIs of human body (Ring et al. 2005), 24 views of the human body were defined with the corresponding ROIs (Ammer 2008) and the following aspects of medical thermal imaging were standardized.
According to Ring et al. (Ring et al. 2004) the usage of standard procedures re-duces the amount and influence of variables, promotes understanding and knowledge exchange, and enforces repeatability. In medical thermal imaging this is a relevant aspect, since most of past errors were made due to the absence of a standard image capturing methodology (Ammer 2003). This had led to a creased application of this imaging method in medicine and a considerable de-crease in credibility among health professionals.
In 2006, the American Academy of Thermology (AAT) suggested a document (Schwartz et al. 2006) which specifies the purpose, common indications, contrain-dications and limitations of using Infrared Thermography in medicine.
The examination room should have a stable temperature and relative humidity system, which should maintain in values of 22 ± 1ºC and below 50% respectively, the air flow should be inferior to 2m/s and the illumination should have protec-tions to avoid incident lightning over the subject. The outside laboratory windows have to be completely shut, to prevent solar radiation, but also enforce privacy during the procedure. The provision of a disrobing room at same environmental conditions of the examination main room is advised for the subject rest during the
acclimatization period, which is advised to be of 15 minutes before the examina-tion to facilitate thermal steadiness. In order to ensure the adequate space for the procedure of collecting the images the whole unnecessary equipment must be re-moved from the room area to prevent unwanted heat reflections. The subject should be away from equipment’s and walls, as far as possible, to decrease the thermal reflections. The minimum necessary furniture is recommended to provide adequate space for maneuver of the equipment and allow sufficient distance be-tween the camera and the subject. For avoiding external disturbances during the recording procedure, a signaling at the door with the “Examination in progress” is recommended.
Before the appointment, the subject requires some care, such as avoid smoking, drinking hot drinks (coffee and tea) or having an heavy meal two hours (mini-mum) prior to the investigation, since this would influence the metabolism; avoid any moistures on the skin, since these substances will thermally insulate the skin; avoid alcohol or drugs consumption and physiotherapy or sports on the images collection day, once this would affect the subject thermoregulation; and report any infections and any medicines taken, independently of the source of their prescrip-tion, considering that they might be vasodilators or vasoconstrictors.
On arrival, the subject should remove the clothing according with the body view of interest and he should be comfortable with (changing division is recom-mended) and in line with the area of the part of the body to be screened. It should be avoided to have jewelry, crossing legs, or hands/arms close or on the body and touching the body. Tight clothing or seating should be abstained to prevent marks that can result in skin temperature changes.
All recorded data has to be correctly stored and the subject privacy and confi-dentiality must be respected and assured. The images are then analyzed using ROIs were parameters such as mean, minimal, median, maximum temperature, standard deviation, kurtosis, skewness and histogram are calculated.
2.3 Image capture devices
There are two main types of infrared thermal cameras, which are the called “cooled systems”, which the sensors operate at a lower temperature than the envi-ronment, produce images of higher quality, have better sensitivity but have a lim-ited time of operation due to the refrigeration system and are costly when com-pared with the “uncooled systems”, that have no limitations in usage and normally present sensor focal plane arrays of higher dimensions, their images quality over time become closer to the “cooled” equipment.
Before the image collection procedure, the investigator has to verify if all need-ed equipment is set up adequately (the usage of a check list is recommendneed-ed). The infrared camera has to switched on at least 15/20 minutes before the first image to prevent start-up drift effect and allow electronic equilibrium of the camera com-ponents; this can be tested for the used camera according to the quality assurance
guidelines (Ring et al. 2007). An image of the calibration source is recommended before starting the recording process of the subject, it will also apply to the end of the subject imaging, when another image should be taken from the blackbody un-der the same condition of the first, comparing both will allow to check for record-ing errors.
In order to capture the desired views, a correct distance and angle from the camera to the target, its position and field of view of the recording equipment has to be obtained. This arrangement procedure can be somewhat simplified through the usage of software capture overlay masks over the live displaying. Moreover, the usage of camera stand will facilitate quick and easy positioning and stable fix-ation onto the target view, avoiding angles change.
The infrared camera minimal requirements for medical use have been estab-lished (Howell and Smith 2009, TC121 et al. 2008, ISO and TR13154 2009) and indicate a minimum sensor array size of 320x240, NETD of <50mK at 30ºC and repeatability of ±2% of the overall reading. The lenses used in these imaging sys-tems are standard lens (IR-lens 24º) for body partial views and wide angle lens (IR-lens 45º) for full body views.
It is also important to have a hygrometer with a large display to verify the envi-ronmental condition of the examination room.
3
Classification Methods on MITI
Advanced data analysis techniques provide a diversity of distinct approaches for data reasoning and selection. Those are being used increasingly in problem domains involving classification and within a set of ostensibly unrelated data can find shared features.
All of the different methods are based in input variables, which might or not been reduced, that are subject to operators that divide that variables into groups, providing a classification to each.
In MITI the common input variables are taken from ROIs in the images, which can be first order statistics such as mean (average) temperature, standard devia-tion, entropy, kurtosis, skewness and variance, or second order statistics such as homogeneity, contrast, energy, correlation, entropy and maximum probability.
In order to reduce or simplify the variables, statistical transformations can be used such as Principal Component Analysis (PCA), Nonparametric Discriminant Analysis (NDA), Linear Discriminant Analysis (LDA) or Information Gain Ratio (IGR).
The accomplishment of the classifiers is measured in premises of accuracy, sensitivity and specificity, which are calculated from the amount of true and false positives, true and false negatives and receiver operating characteristic (ROC).
The first known publication (Ng et al. 2002) which related classifiers with MITI, dated on 2002, presented the usage of an ANN with the purpose of identify-ing BC in thermal images.
3.1 ANN
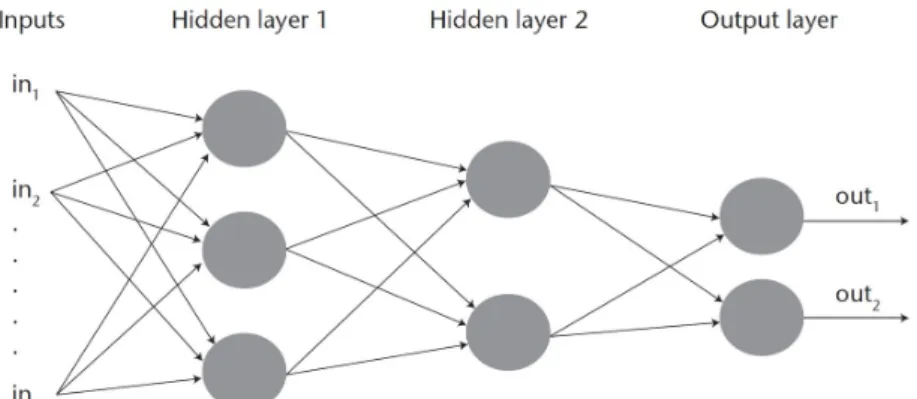
The largest artificial intelligence method for data classification in MITI is based on ANN. An ANN can be intended as a computational approximation (model) of the human brain (Hassoun 1995). In similarly with a brain, an ANN is composed of neurons and inter-connections. An illustrative format of such format is composed of neurons, represented as nodes, and interconnections, represented by edges (Fig. 4). Several variations of ANNs exist, being distinct in their topolo-gy, orientation of connections and approaches for learning. The prominent is the ‘feed-forward back-propagation’, which is also called multilayer perceptron. Be-cause of its efficiency and somewhat uncomplicated training process.
Fig. 4 A representation of an artificial neural network (multiplayer per-ception).
A description in detail of a multilayer perceptron ANN is besides the ambit of this chapter and is well detailed in related existing literature. For an improved un-derstanding, an ANN can be adaptively trained for its parameters by machine learning procedures; hence, consequently, it can learn to assertively classify input elements, usually in numerical format (Hassoun 1995). To assess the degree of confidence of an ANN, the data set to be classified should generally be divided in-to two groups. The first should consist of cases used for the training process, by which ANN will adapt. While the second grouping is composed of cases that are totally unknown to the ANN, which has undergone a learning process. These data are subject to classification and their results are compared with the actual values of the class to which they belong. Theoretically, if the training set is large enough, an ANN can cluster enough knowledge to classify elements that are totally un-known (Hassoun 1995).
In specific, the infrared heat radiation and physiologic data are the basic ele-ments for the training of the ANNs by processing backpropagation algorithms. Each ANN created had three layers (input, hidden and output) and the processing elements were propagated in the network by output layer until input layer, without interconnection between processing elements in the same layer (Ng et al. 2002).
In detail, the basic variables used were obtained by the correlation between the captured basic elements, i.e. diagnostic outcome (healthy or patient) and thermo-grams results (mean, median, mode, SD and skewness of the temperature of each breast). The output values were obtained by the following steps: the weight is ad-justed for each processing element; the sum of all defined weights is calculated and used for one activation function that converts this value in an output value. This charge distribution process is known as normalized cumulative delta learning rule and was defined some default values (Ng et al. 2002), which are a momentum of 0.4 and learning coefficients of hidden layer, output layer and ratio of 0.3, 0.15 and 0,5 respectively.
A different file was conceived to be applied in each ANN during the training phase. These four files had different basic variables. Next topics describes the con-tent in each file, given by its inputs (Ng et al. 2002):
• File 1: mean, median, modal, SD and skewness temperature of both breasts. • File 2: mean, median and modal temperature of both breasts.
• File 3: age, family history, hormone replacement therapy, age of menarche, presence of palpable lump, previous surgery biopsy, presence of nipple discharge, breast pain, menopause at age > 50 years, first child at age < 30 years of the pa-tient.
• File 4: the junction of files 2 and 3.
The activation function is based in hyperbolic tangent and with this the results were in the range [0, 1] but then were normalized for to have the value 1 (means diseased patient) or -1 (healthy patient). To ensure a correct training process, it was calculated the Root Mean Square Error (RMSE) by the learning index. The hidden nodes number was defined in a trial error mode for each ANN, in other words, each ANN was tested with a different hidden nodes number for their basic variables file and then the RMSE was calculated (Ng et al. 2002).
The results show that it is possible for an ANN to memorize and to generalize the relation between the system input and output data and the best results was ob-tained in the network that used the fourth basic variables file (File 4). This means that one advantage achieved with this work was the pattern recognition. Other-wise, some disadvantages were also found such as the lower precision results caused by the use of numeric values for the input data and the time spent in train-ing process. However, after the conclusion of this process it only needed one cycle (epoch) for classifying or detecting a specific condition.
A total of 207 subjects were used, being 76 healthy, 98 benign and 33 malig-nant patients, the system has as highest sensitivity 68.97%, specificity of 80% and accuracy of 61.94% (Ng et al. 2002).
Two years later, another publication (Jakubowska et al. 2004) with a similar method was developed having the same objectives and using ANN but, in this case, NDA, LDA and PCA statistical procedure techniques were used to reduce variables and compared.
The basic variables were defined with the following data captured (Jakubowska et al. 2004):
• Histograms of breast ROIs: mean, variance, skew ness, kurtosis and five his-togram percentiles.
• Co-occurrence matrix based characteristics which are specified for matrices constructed for 5 distances between image pixel (d=1, 2, 3, 45) and separately for the 4 directions: horizontal, vertical, 45 and 135 (angular second moment, con-trast, correlation, sum of squares, inverse difference moment, sum average, sum variance, sum entropy, entropy, difference variance, difference entropy);
• Gradient-based elements (absolute gradient mean, variance, skewness, kurto-sis and of non-zero gradients)
• Run-length matrix-based traits (short run emphasis inverse moment, long run moment, grey level no uniformity, run length no uniformity and fraction of in runs, for the same directions as in the case of co-occurrence matrix based fea-tures).
The mentioned histograms were captured from 30 healthy patients and 30 dis-ease subjects. The results obtained with the application of data only from histo-gram were not conclusive. This happened because the implemented ANN had implicit in their architecture data reduction that caused a reduced multidimension-al distance between the output results, this means that the probability of errors oc-curring at normalization is high and classification could be wrong (Jakubowska et al. 2004).
At the same year, another study which configured an ANN with BP to classify breast thermograms. After the reduction of the subgroup defined from five varia-bles to only two (mean temperature difference and standard deviation difference), the created ANN uses only one invisible node (hidden node) and the obtained re-sult was two false positives. According to the authors, the system failure is due to the use of few images from users where the cancer problem exists and, thus, the recruitment of more participants was advised in order to obtain better results (Ko-ay et al. 2004).
In 2008, the pioneer in introducing AI classifiers in MITI has tried to prove that BC early diagnostic was feasible using ANN and some bio-statistical methods such as linear regression and ROC (Ng and Kee 2008).
The method created suggest the usage of a linear regression multiple mod-el, radial basis function network (RBFN) and an analysis by ROC. The regression al-lows the correlation between the variables and the currently state of the patient and this enables the correct selection of the features that were used in the training epoch for the ANN. Then, the activation function RBFN was used for to deter-mine the classification result. This function, comparatively to BP, presented that
the training epoch is faster. This approach presented rates of 80.95%, 100% and 70.6% for accuracy, sensitivity and specificity correspondingly in identifying BC, which was largely higher compared with those parameters obtained from clinical examination conducted by experienced radiologists, which had an accuracy rate between 60 and 70% (Ng and Kee 2008).
At the same year, a study aiming to automatically identify - Carpal Tunnel Syndrome (CTS) has used a learning group, which was produced by computer through random selection and represents a total of 60% of the 34 hands. Before starting the workout, the temperature of each individual portion was standardized based on the average temperature of the whole pertaining hand. This assured that compelling differences in the temperatures of hands between distinct people did not cause an influence on the classification outcome (those temperature differ-ences within individuals are common and usually not related to any pathologic state). The leftover cases were then object of classification (Papež et al. 2008).
Different sorting attempts were performed, where the number of hand segments was changed, and these were used as input values in ANN. For each time, it was used a multilayer perceptron fully connected with two hidden layers (with nine neurons in the first hidden layer and five neurons in the subsequent hidden layer), followed by 100 training repetitions (where each hand of the training set was used 100 times). Each data classification was repeated five times, each being a training set randomly selected from 60% of the 34 hands, with the percentage of successful classifications being calculated based on the average of these five trials. In order to reduce the errors of comparison, a reference classification was used, where all 12 segments of the dorsal hand were included (Papež et al. 2008).
For a reference classification, the 12-existing hand dorsal segments were used, with an average success rate of 80.6% (18 out of 22 hands). Palm segments did not have any beneficial influence on the result of the classification, since the suc-cess rate increased considerably when they were omitted, while on the other hand when the dorsal segments were omitted, the opposite occurred. This led to an at-tention to the dorsal side over the palmar side of the hand. The segments of the fingers appeared to be of greater importance, especially the second (indexer) and the fifth (small) finger. When the area corresponding to the median nerve influ-ence was suppressed (the first, second and third fingers), the success rate of the classification was similar to that of the random method. Thus, the metacarpal segments seem to bring benefits, since the classification worsens slightly when they are omitted. Controversially, the segments of the pulse when not considered, result in an improvement in the success rate, which leads to infer that these are not important for the correct classification based on the thermal scale (Papež et al. 2008).
In the following year, the same authors added a total of 502 images of hands to train the ANN and repeated the experience, they have found that based on the dor-sal images of the hands, it was possible to correctly classify a total of 72.2% of all hands (healthy and pathological), being this about 80% when only healthy and se-riously affected hands were included. Comparing these results with those obtained
by the gold standard electromyographic diagnosis of CTS, the MITI technique cannot be recommended as an adequate diagnostic tool when accurate determina-tion of severity level is required. However, the authors suggest that it could be used as a screening tool for identifying severe cases in populations with high er-gonomic CTS risk factors (Papež et al. 2009).
In 2015, a study (Koprowski, 2015) proposed a method of image analysis for the evaluation of the temperature distribution along the back of the back-pain pa-tients in which the images were collected. The main objective would be to detect anomalies that cause a defective posture. Some classifiers were used to classify the collected parameters, among which ANN. The results obtained show that for ANN with the use of BP, with 16 neurons in the invisible layer and learning by cross-validation, a sensitivity and specificity of 75% and 89% respectively was obtained. However, this was not the classifier with the highest values in the evalu-ation. The classifier with the highest success percentage value was the SVM with 88% and 90% respectively.
In the same year, another study (Koukiou and Anastassopoulos 2015) related the application of ANN in infrared images in order to identify people in a state of drunkenness. In order to reach the proposed aim, two approaches were adopted. In the first, using the ANN, the temperatures by location in each one of the different images from the same face were examined for all the collected faces, with this, it was verified that it was in the frontal images of the face where there was a major change in the thermal behavior with alcohol consumption. In the second, a single-structure neural network was constructed with the basic building variables from all face locations, thus a highly discriminative performance was observed when ap-plied to unknown data. However, smaller ANN presented better overall perfor-mance, with an overall accuracy of 86%.
In 2016, Saniei et al. (Saniei et al. 2016) presented a new approach to predict an estimation of the size, depth and rate of metabolic heat generation in a tumor. This new approach is composed of two stages: progressive and inverse. For the first step, it was necessary to create a finite element model and solve the equation (The Pennes bio-heat) to calculate the surface and depth temperature distribution. The calculated values obtained were applied for the construction of a dynamic neural network (DNN) and, in order to ensure the correct network construction, the results of this application confirm the advantages of the finite element model. In the second action, the constructed network was used to estimate the temperature distribution in depth from the surface temperature profile
In order to avoid that the created network was too tight and in order to obtain a system with an acceptable level of performance, the authors considered as crucial the choice of the amount of neurons in the invisible layer and of the necessary times, values, were not dependent on each other but determined iteratively. There was a strong indication of the linear relationship between two variables was found to be 0.84 and 0.71, respectively, for size and depth. Ab-solute errors in depth and size were within 0.31 cm and 0.2 cm, respectively. Results showed that the depth estimation error was larger than the size estimation error, which influenced that
deep seated tumors had higher error than other cases. More images are required for better assessment of the developed system (Saniei et al. 2016).
3.2 SVM
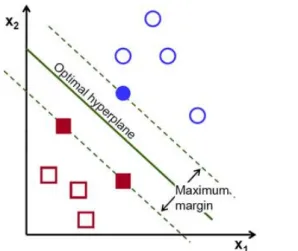
The second most experimented classifier of data in MITI was the SVM, which has the concept based on statistical learning theory and was applied to a set of classification methods that analyze data and recognize patterns. This automatic constructive learning procedure is based on the principle of structural risk minimi-zation, that is, it intends to minimize existing errors on the data that are not in-cluded in the construction algorithm. Its advantage is due to the limits (border-lines) created by the automatic learning machine during the construction phase (Abe 2005, Wang 2005).
In general, an SVM classifier produces binary linear results, it analyses a set of initial data and assignments to one of two possible categories. Normally, this algo-rithm works well when applied to new data because the data applied during the build phase are generally the most difficult to classify. It implies that methods that choose to use this technique have the ability to overcome competing methods in many applications. In a representation model, the SVM uses a point mapping in space, and there is, in the created representation space, a hyperplane that separates the two classes. In this way, the points are distributed in the space according to the class belonging (Fig. 5) (Abe 2005, Wang 2005).
Fig. 5 Illustrative view of an example of a SVM.
The work of Archarya et al. (Archarya et al. 2012) aimed to evaluate the viabil-ity of use classified thermography in BC diagnostic. Texture characteristics were obtained from co-occurrence and run length matrices. After normalization process, the next step was to classify with application of SVM. The choice of this classifier
was justified with the good performance obtained at previous studies in pattern recognition.
In the implementation of SVM, the Tree-fold stratified cross validation method was adopted, being the data divided in three sets. Then, for each combination of two sets, the SVM was trained and tested in the third set that remained in each combination. A result of 88.10%, 85.71% and 90.48% was obtained for accuracy, sensitivity and specificity respectively (Archarya et al. 2012).
At the same year, Resmini et al. (Resmini et al. 2012) researched the features in breast region thermal imaging that are in need for the classification and detection of BC. This complementary work had the purpose of improve the results from previous work with the addition of classifiers, techniques of selection and data in-formation in the databases. First, for features research, it was crucial to extract statistic features, fractal dimension and geo-statistic features. In the approach adopted for this work it was necessary to reduce the features. For accomplish this requirement it was used two data reduction techniques: PCA and IGR. Classifiers were used for label the data from patients as being with or without the pathology presence.
There were defined three databases (DB), each one with different features and used for the classifiers tests. The "Old" DB contained the data used in previous work of the same author. The "New" DB has the same information of "old" plus new captured images. In this developed work was also investigated if the results are improved when the data contains only data of the features subtraction between left and right breasts of each patient. This information was saved in a third data-base called “difference” (Resmini et al. 2012).
For the classification tests, it was used the WEKA tool and, in the case of SVM, it was defined the following parameters (Resmini et al. 2012):
• SVMType = nu-SVC; • nu = 0,5;
• kernelType = linear;
For the remaining parameters, there were used the default settings of WEKA. For the evaluation of the results was considered two measurements: percent value of accuracy and area under the ROC curve (equal to sensibility/(1-specificity)). The obtained results showed an accuracy of 82.35% in the “New” DB (Resmini et al. 2012).
A research aiming to classify the Dry Eye disease with SVM collected thermal images in people with the problem and people without this pathology. More spe-cifically, from the thermograms, statistical data such as energy, kurtosis, skew-ness, mean, standard deviation and various values of entropy were collected (Ar-charya et al. 2014).
With the SVM algorithms used the initial data collected from the thermo-grams were mapped in a dimensional space. Kernel functions in the order of 1 to 3 and RBF were used. The better results presented with SVM were with the polynomial
function of order 3, which had an accuracy of 84.76%. This result was overcome by the k-NN classifier (Archarya et al. 2014).
Milosevic et al. (Milosevic et al. 2014) aimed to classify breast thermogram through applying SVM classifiers in the images for the detection of abnormal mass in tissue. In the application of the algorithm, a diagonal covariance (five-fold cross validation) matrix was adopted to ensure that the construction was per-formed exhaustively with all applied data.
As a procedure, the data were randomly divided by k = 5 sets. The construction is performed with each set (k-1) and the result is applied to the remaining assem-blies in test form. After this method, has been applied to all construction data sets and the consequent K tests were performed, an average of all K results is calculat-ed, which means the final result of the classification. The SVM had the second highest score in this application, an accuracy of 85% only surpassed by the k-NN, which obtained a value of 92.5% (Milosevic et al. 2014).
In 2015, Acharya et al. (Acharya et al. 2015) revisited their research in Dry eye disease classification, improving the methodology, reducing the features for clas-sification. The SVM presented an average sensitivity, specificity and classification accuracy of 99.9%, 99.4% and 99.8% respectively using SVM classifier with pol-ynomial order 2 kernel, whether the k-NN classifier obtained the average sensitivi-ty, specificity and classification accuracy of 99.8%.
Sathish et al. (Sathish et al. 2016) presented a new approach to the analysis of breast thermograms, which consists in the development of fully automated seg-mentation, in order to be able to carry out an asymmetric analysis with respect to the respective side of the thermogram. The results obtained show a 90% accuracy, 87.5% sensitivity and 92.5% specificity were obtained for the 80 images applied to SVM.
3.3 k-NN
The k-NN algorithm can be used either for classification and/or clustering, it is classified as a supervised learning algorithm (Larose 2005).
As previously mentioned in the previous section in the dry eye disease (Ar-charya et al. 2014, Ar(Ar-charya et al. 2015) and breast classification (Milosevic et al. 2014) studies, the k-NN classifier obtained better efficacy results than the SVM.
In 2016, a study (Bhowmik 2016) on classification of thermograms with Oste-oarthritis (OA), which is the most common manifestation of arthritis, and rheuma-toid arthritis (RA) in the knee in 15 patients with k-NN has been published. The authors followed a strict images capture protocol, after a few parameters (first and second order statistics) were extracted from the ROIs (affected and non-affected) such as mean temperature, standard deviation, entropy, kurtosis, skewness and variance (first order statistics); and homogeneity, contrast, energy, correlation, en-tropy and maximum probability (second order statistics). It has to be noted that in-flammation occur in unilateral knee in cases of OA and in bilateral knee when RA
exists. Taking into account the differences in the propagation of inflammation, the mean standard deviation and the contrast value of the intensity distribution on the IR images, these are able to discriminate between the affected knee and the healthy knee in the OA classification. In the categorization of RA, bearing in mind that the spread of inflammation in the bilateral joints is very similar, then the dif-ference in statistical characteristics is smaller between the contralateral knees, making its identification more difficult.
Another recent research (Glowacz and Glowacz 2016) on applying k-NN clas-sifiers to identify finger skin injuries using signal processing techniques such as extraction of magenta color, calculation of histogram, image filtration and calcula-tion of perimeter. A total of 15 images of finger were used to train the classifier and 60 images of finger were used to test the proposed system. The best results were obtained for k=1 and k=3 and image filtration, histogram and k-NN (100%). 3.4 Fuzzy Logic
The Fuzzy Logic is based on a human like interpretation for solving situations and thus the programming language used is very easy and simple to understand. Fuzzy logic incorporates a simple, rule-based IF X AND Y THEN Z approach in solving problems rather than performing models of solutions. The main issue of the fuzzy logic is its dimensionality, if the number of rules increases exponentially with respect to the number of attributes involved, it can become highly computa-tional and memory expensive (Barro and Marín 2013).
A study (EtehadTavakol et al. 2010) used a 2-color segmentation approach, K-means and fuzzy c-K-means (FCM) for color segmentation of infrared breast images were modelled and compared. FCM were preferred because the fuzzy nature of IR breast images helps the FCM segmentation to provide more accurate outcomes with no empty cluster. A total of 6 thermal cases of BC were investigated, through using FCM, it was possible to find the 1st and the 2nd hottest regions for each case where some useful characteristics could be extracted from. There are several advantages in the color segmentation of thermal infrared breast images using FCM, such as: identifying abnormal cases by comparing the corresponding groups to the left and right sinuses, determining the degree of malignancy with the dis-covery of the two hottest regions and extracting parameters of these. The authors suggested to analyze the probability of development of the CB based on the char-acteristics used in the methodology developed by them (EtehadTavakol et al. 2010).
In the following year, a study (Sebiskveradze et al. 2011) aiming to develop a new FT-IR spectral imaging system of tumor tissue that allows a better characteri-zation of the heterogeneity between the tumor and its surrounding tissue. Infrared data were acquired from 13 biopsies of paraffin embedded human skin carcino-mas. The methodology used was based on an innovative FCM-based clustering al-gorithm, allowing automatic and simultaneous estimation of optimal FCM
param-eters (number of clusters K and diffusion index m). With the methodology pro-posed and developed, it was possible to emphasize a marked heterogeneity in the tumor and to characterize the interconnection between the structures of the tissue.
The unique known application (Schaefer et al. 2009) of Genetic Algorithms in medical applications of MITI was in breast thermograms classification, where it was used to reduce the number of rules of fuzzy logic, presenting accuracy of 80.98%, through decreasing by 250% of number of required rules, the gain in ac-curacy was of about 1%.
3.5 NB
NB is a simple probabilistic classifier, which is based on the application of Bayes' theorem, with strong (naive) assumptions of independence between re-sources. It only requires a small amount of training data to be able to estimate the parameters needed to classify new data (Murphy 2006).
There are three known applications of NB classifier in MITI application in breasts cancer classification, although in all of them the accuracy was low, in a study (Nicardo et al. 2013) it was of 71.86% and in the other two studies (Archar-ya et al. 2014, Archar(Archar-ya et al. 2015) this classifier had 3% (Archar(Archar-ya et al. 2014) and 11% (Archarya et al. 2015) less accuracy when compared with SVM after re-ducing the variables.
3.6 Adaboost
Adaptive Boosting is a machine-learning meta-algorithm that can be used as a complement to other types of learning algorithms in order to improve perfor-mance. The outputs of the other learning algorithms ("weak learners") are then combined into a weighted sum representing the final output of the reinforced clas-sifier. Thus, AdaBoost translates into an adaptive approach in the sense that sub-sequent weak learners are modified in favor of instances misclassified by previous classifiers. This classifier is highly sensitive to data and noisy outliers. However, it may also be less susceptible to the overlapping problem than other classifiers. (Freund, 1999).
The unique known application (EtehadTavakol et al. 2013) to date of Adaboost classification in MITI was published in 2013 and aimed to classify breast thermo-grams, a data set composed of 9 malignant, 12 benign and 11 normal cases of breast thermal images was used for evaluation of performance. The malignant cas-es prcas-esented a 95% accuracy rate after advanced featurcas-es extraction, such as nor-malized bispectrum, which discards all magnitude information, demonstrating a better discrimination between benign and normal cases, with 83% of accuracy rate when compared to 66% obtained with the original.
4
Discussion
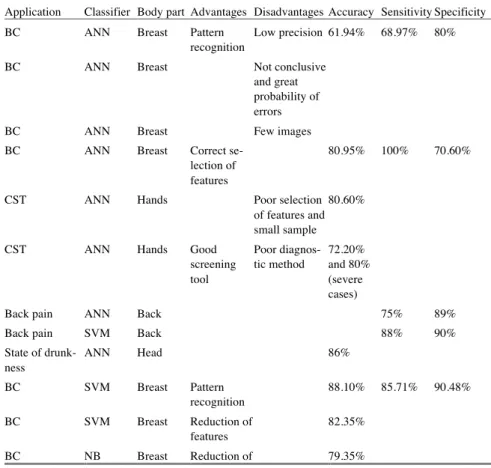
From the presented literature, it can be easily identified that most of the appli-cation of artificial intelligence (AI) classifiers in MITI is in BC identifiappli-cation (ta-ble 2), all of the above outlined classifiers have been tested in that application, the one that showed better results was the k-NN, followed closely by Adaboost and SVM with accepted accuracy rates. Nonetheless, it worth’s to mention that despite of six decades of research in the fields of MITI in BC identification, to date no convincing standard clinical application was successful, this is due that at an early stage any abnormality at skin surface temperature can be related with any other cause than BC. From the table 2 it can be observed that the areas of the human body that had more interest in being studied were the breast, head, hands, knee, fingers and back. The major advantages of the studied classifiers were the pattern recognition and the features reduction and the limitations were the low precision and small samples.
Table 2. Comparison between classifiers and their application in MITI.
Application Classifier Body part Advantages Disadvantages Accuracy Sensitivity Specificity
BC ANN Breast Pattern
recognition
Low precision 61.94% 68.97% 80%
BC ANN Breast Not conclusive
and great probability of errors
BC ANN Breast Few images
BC ANN Breast Correct
se-lection of features
80.95% 100% 70.60%
CST ANN Hands Poor selection
of features and small sample
80.60%
CST ANN Hands Good
screening tool Poor diagnos-tic method 72.20% and 80% (severe cases)
Back pain ANN Back 75% 89%
Back pain SVM Back 88% 90%
State of drunk-ness ANN Head 86% BC SVM Breast Pattern recognition 88.10% 85.71% 90.48% BC SVM Breast Reduction of features 82.35% BC NB Breast Reduction of 79.35%
features
Dry eye disease SVM Head 84.76% 86.14% 83.33%
Dry eye disease k-NN Head 99.88% 99.76% 100%
Dry eye disease NB Head 65.73% 77.23% 53.95%
BC SVM Breast 85%
BC k-NN Breast 92.5%
BC NB Breast 81.5%
Dry eye disease SVM Head 99.8% 99.9% 99.4%
Dry eye disease k-NN Head 99.8% 99.8% 99.8%
Dry eye disease NB Head 89.46% 92% 79.39%
BC SVM Breast Fully
auto-mated seg-mentation 90% 87.5% 92.5% Osteoarthritis and Rheumatoid Arthritis k-NN Knee OA good performance RA poor per-formance Finger skin
in-jury
k-NN finger Feature
se-lection
100%
BC Fuzzy
log-ic
Breast Sample size
BC Fuzzy log-ic Breast Identified the marked heterogenei-ty BC Fuzzy log-ic Breast GA reduced the varia-bles , and rules by 250% 80.98% BC NB Breast 71.86%
BC Adaboost Breast Malignant
95% Distinc-tion 83%
A good example of application of intelligent data classifiers in MITI is the clas-sification of OA and RA (Bhowmik et al. 2016), which has shown an accuracy of 100% despite the small size of the sample to be classified. Other good example of application of AI classifiers in MITI was the identification of Dry Eye disease (Archarya et al. 2014, Archarya et al. 2015) either with k-NN and SVM.
The classification of back pain (Koprowski 2015) and drunkenness (Koukiou and Anastassopoulos 2015) states in infrared images with intelligent classifiers presented an accepted accuracy, however if the sample images increase those val-ues may improve significantly.
The application of ANN in the classification of CTS in thermal images (Papež et al. 2008, Papež et al. 2009) had a significant sample size, although the authors considered that their approach was not recommended for diagnosis but it was wor-thily for monitoring.
The use of Fuzzy logic classifiers demonstrated to be helpful for features ex-traction.
The inexistence of healthy reference data and standard ROIs in MITI is the ma-jor barrier for the successful application of AI classifiers.
There is no doubt about the utility and usefulness of data classifiers in medical imaging applications (Dey 2016). The application of intelligent data classifiers in MITI is still unexplored, due to some barriers such as the unfamiliarity of the im-aging technique by the health professionals and its principles and the lack of a standard imaging file format, which difficult data exchange and integration into information systems and development of advance CAD tools.
Examples of MITI applications that could have a great success in using intelli-gent data classifiers are: diabetic foot ulcers, Raynaud’s phenomenon, soft tissues rheumatism, blood pressure, Hand-Arm Vibration Syndrome, peripheral nerves compressions, Complex Regional Pain Syndrome, fever screening, burns (tissue viability), Dermatological disorders, temporomandibular joint conditions, thyroid dysfunctions, renal dialysis, skin cancer, chemotherapy assessment and rehabilita-tion medicine procedures assessment.
Acknowledgements
The authors thank the partial funding of Project NORTE-01-0145-FEDER-000022 - SciTech - Science and Technology for Competitive and Sustainable In-dustries, co-financed by Programa Operacional Regional do Norte (NORTE2020), through Fundo Europeu de Desenvolvimento Regional (FEDER) and the FCT - Foundation for Science and Technology under the project (PEst-OE/EME/LA0022/2013).
References
Abe S (2005) Support vector machines for pattern classification. Volume 2. London: Springer. Acharya UR, Ng EYK, Tan JH, Sree SV(2012) Thermography based breast cancer detection
us-ing texture features and support vector machine. Journal of medical systems 36(3): 1503-1510
Acharya UR, Tan JH, Vidya S, Yeo S, Too CL, Lim WJE, Chua KC, Tong L (2014) Diagnosis of response and non-response to dry eye treatment using infrared thermography images. In-frared Physics & Technology, 67: 497-503.
Acharya UR, Tan JH, Koh JE, Sudarshan VK, Yeo S., Too CL, Chua CK, Ng EYK, Tong L (2015) Automated diagnosis of dry eye using infrared thermography images. Infrared Physics & Technology, 71: 263-271.
Ammer K (2003) Need for standardisation of measurements in thermal imaging. Thermography and Lasers in Medicine. Akademickie Centrum Graficzno-Marketigowe Lodart SA, Lodz (Poland), 13-18
Ammer K (2008) The Glamorgan Protocol for recording and evaluation of thermal images of the human body. Thermology international 18(4): 125-144
Bezdek JC, Ehrlich R, Full W (1984) FCM: The fuzzy c-means clustering algorithm. Computers & Geosciences 10(2-3): 191-203.
Barro S, Marín R. (Eds.) (2013) Fuzzy logic in medicine. Volume 83. Physica.
Bhowmik MK, Bardhan S, Das K, Bhattacharjee D, Nath S (2016) Pain related inflammation analysis using infrared images. In SPIE Commercial+ Scientific Sensing and Imaging. Inter-national Society for Optics and Photonics. 986116-986116
Dey N (Ed.) (2016) Classification and clustering in biomedical signal processing. IGI Global EtehadTavakol M, Sadri S, Ng EYK (2010) Application of K-and fuzzy c-means for color
seg-mentation of thermal infrared breast images. Journal of medical systems 34(1): 35-42 EtehadTavakol M, Chandran V, Ng EYK, Kafieh R (2013) Breast cancer detection from thermal
images using bispectral invariant features. International Journal of Thermal Sciences 69: 21-36
Freund Y, Schapire R, Abe N (1999) A short introduction to boosting. Journal-Japanese Society for Artificial Intelligence 14(771-780): 1612
Glowacz A, Glowacz Z (2016) Recognition of images of finger skin with application of histo-gram, image filtration and K-NN classifier. Biocybernetics and Biomedical Engineering 36(1): 95-101
Hassoun MH (1995) Fundamentals of artificial neural networks. MIT press
Howell KJ, Smith RE (2009) Guidelines for specifying and testing a thermal camera for medical applications. Thermology international 19(1): 5-14
ISO, TR13154 (2009) Medical Electrical Equipment - Deployment, implementation and opera-tional guidelines for identifying febrile humans using a screening thermograph.
Jakubowska T, Wiecek B, Wysocki M, Drews-Peszynski C, Strzelecki M (2004) Classification of breast thermal images using artificial neural networks. In Engineering in Medicine and Bi-ology Society, 2004. IEMBS'04. 26th Annual International Conference of the IEEE, 1155-1158.
Jones BF, Plassmann P (2002) Digital infrared thermal imaging of human skin. IEEE Engineer-ing in Medicine and Biology Magazine 21(6): 41-48
Koay J, Herry C, Frize, M (2004) Analysis of breast thermography with an artificial neural net-work. In Engineering in Medicine and Biology Society, 2004. IEMBS'04. 26th Annual Inter-national Conference of the IEEE, 1159-1162
Koprowski R (2015) Automatic analysis of the trunk thermal images from healthy subjects and patients with faulty posture. Computers in biology and medicine 62: 110-118
Koukiou G, Anastassopoulos V (2015) Neural networks for identifying drunk persons using thermal infrared imagery. Forensic science international 252: 69-76
Larose DT (2005) k‐Nearest Neighbor Algorithm. Discovering Knowledge in Data: An Intro-duction to Data Mining, 90-106.
Lawson R (1956) Implications of surface temperatures in the diagnosis of breast cancer. Canadi-an Medical Association Journal 75(4): 309-310
Lisowska-Lis A, Mitkowski SA., Augustyn J (2011) Infrared technique and its application in sci-ence and engineering in the study plans of students in electrical engineering and electronics. In Proceedings of 2nd world conference on technology and engineering education (WIETE 2011): 104-108
Milosevic M, Jankovic D, Peulic A (2014) Thermography based breast cancer detection using texture features and minimum variance quantization. EXCLI journal 13: 1204.
Murphy KP (2006) Naive bayes classifiers. University of British Columbia.
Ng EYK, Fok SC, Peh YC, Ng FC, Sim LSJ (2002) Computerized detection of breast cancer with artificial intelligence and thermograms. Journal of medical engineering & technology 26(4): 152-157
Ng EYK, Kee EC (2008) Advanced integrated technique in breast cancer thermography. Journal of medical engineering & technology 32(2): 103-114
Nicandro CR, Efrén MM, María Yaneli AA, Enrique MDCM, Héctor Gabriel AM, Nancy PC, Alejandro GH, Guillermo de Jesús HR, Rocío Erandi BM (2013) Evaluation of the diagnostic power of thermography in breast cancer using bayesian network classifiers. Computational and mathematical methods in medicine, 2013.
Papež BJ, Palfy M, Turk Z (2008) Infrared thermography based on artificial intelligence for car-pal tunnel syndrome diagnosis. Journal of International Medical Research 36(6): 1363-1370 Papež BJ, Palfy M, Mertik M, Turk Z (2009) Infrared thermography based on artificial
intelli-gence as a screening method for carpal tunnel syndrome diagnosis. Journal of International Medical Research 37(3): 779-790
Qi H, Diakides NA (2007) Infrared imaging in Medicine
Resmini R, Borchartt TB, Conci A, Lima RC (2012) Auxílio ao Diagnóstico Precoce de Patolo-gias da Mama Usando Imagens Térmicas e Técnicas de Mineração de Dados. Anais do Com-puter on the Beach, 305-314
Richards PL (1994) Bolometers for infrared and millimeter waves. Journal of Applied Physics 76(1): 1-24
Ring EFJ, Ammer K (2000) The technique of infrared imaging in medicine. Thermology interna-tional 10(1): 7-14
Ring EFJ, Ammer K, Jung A, Murawski P, Wiecek B, Zuber J, Zwolenik S, Plassmann P, Jones CD, Jones BF (2004) Standardization of infrared imaging. In Engineering in Medicine and Biology Society, 2004. IEMBS'04. 26th Annual International Conference of the IEEE, 1:1183-1185
Ring EFJ, Ammer K, Wiecek B, Plassmann P, Jones CD, Jung A, Murawski P (2005) Technical challenges for the construction of a medical image database. In Optical Systems Design 2005 International Society for Optics and Photonics. 59640N-59640N.
Ring EFJ (2007) The historical development of temperature measurement in medicine. Infrared physics & technology 49(3): 297-301
Ring EFJ, Ammer K, Wiecek B, Plassmann P, Jones CD, Jung A, Murawski P (2007) Quality assurance for thermal imaging systems in medicine. Thermology International 17(3): 103-106 Ring EFJ, Ammer K (2012) Infrared thermal imaging in medicine. Physiological measurement
33(3): R33-R49
Saniei, E., Setayeshi, S., Akbari, M. E., & Navid, M. (2016). Parameter estimation of breast tu-mour using dynamic neural network from thermal pattern. Journal of Advanced Research 7(6): 1045-1055.
Sathish D, Kamath S, Prasad K, Kadavigere R, Martis RJ (2016) Asymmetry analysis of breast thermograms using automated segmentation and texture features. Signal, Image and Video Processing, 1-8.
Schaefer G, Závišek M, Nakashima T (2009) Thermography based breast cancer analysis using statistical features and fuzzy classification. Pattern Recognition 42(6): 1133-1137.
Schwartz RG, Elliott R, Goldberg GS (2006) Guidelines for neuromusculoskeletal thermogra-phy. Thermology international 16(1): 5-9
Sebiskveradze D, Vrabie V, Gobinet C, Durlach A, Bernard P, Ly E, Manfait M, Jeannesson P, Piot O (2011) Automation of an algorithm based on fuzzy clustering for analyzing tumoral heterogeneity in human skin carcinoma tissue sections. Laboratory Investigation 91(5): 799-811
TC121, ISO, SC62D, SI (2008) Particular requirements for the basic safety and essential perfor-mance of screening thermographs for human febrile temperature screening.
Thomas RA (1999) The thermography monitoring handbook. Coxmoor Publishing
Wang L (Ed.) (2005) Support vector machines: theory and applications. Volume 177. Springer Science & Business Media
Williams KL (1964) Infrared thermometry as a tool in medical research. Annals of the New York Academy of Sciences 121(1): 99-112