Food Science and Technology
DOI:
D httpI://dx.doi.org/10.1590/1678-457X.23917
OSSN 0101-2061 (Print) OSSN 1678-457X (Dnline)
1 Introduction
Drying process is largely utilized to produce dried products by decreasing its moisture content and water activity (Thirugnanasambandham & Sivakumar, 2016). Dried products can be stored for a longer time without appreciable loss of nutrients compared with fresh products (Ray et al., 2016; García-Alvarado et al., 2014; Drtiz-García-Carrasco et al., 2015).
Yam is a very typical agricultural produce in China, which is highly nutritional because of its functional components and unique taste. On traditional Chinese medicine, Yam is used as functional foods and herbal medicinal ingredients (Li et al., 2016; Luo et al., 2016; Chen et al., 2015). Oron yam is a specialty of Henan province, which is commonly consumed in various forms, mainly in fresh raw. Fresh iron yam, however, is seasonal food and difficult to store and easy to damage during transportation, preservation and marketing (Wu et al., 2016). Both quantitative and qualitative deteriorations occur after being injured and contaminated (Kumar et al., 2014). Ot is very important to prolong the storage of iron yam for supplying in the off-season and with good nutritional functionality.
Oron yam chips can be obtained by different drying methods. Heat pump (HP) drying can effectively reduce energy consumption, and can control the drying temperature and humidity independently (Aktas et al., 2016), which is an ideal choice for thermal-sensitive materials.
Microwave (MW) drying has many advantages in removing moisture from the material (Motevali et al., 2016; Simha et al.,
2016; Zarein et al., 2015). The MW drying is widely used but this method is not without drawbacks. For example, it is impractical to install a temperature detector in the microwave drying chamber, so it is impossible to detect the internal temperature of the dried material (Figiel, 2010). However, controlling the temperature of materials during drying is an important way to obtain ideal quality products (Raghavan et al., 2010). At present, however, a fixed power was adopted in the whole drying process rather than a way to control the material drying temperature in most cases due to the difficulties mentioned above. As a result, the phenomenon of excessive drying of the product appears in such situations with the drying process (Dadalı et al., 2007). On order to avoid such defects, successful application of optical temperature detection showing that product temperature must be controlled effectively (Cuccurullo et al., 2012; Zhang et al., 2006). Thermal infrared imaging has been successfully applied to nondestructive detection of surface temperature distribution and variation. Thermal infrared imaging has a significant advantage due to its ability of detecting the temperature of a certain area of the surface, which is more representative. But beyond that, real time images with color representing temperature change patterns are available (Vadivambal & Jayas, 2011). Preliminary experiments showed that the temperature distribution in different parts of the iron yam chips was not uniform. Controlling the drying process is indispensable to avoid excessive drying at some parts of the yam chips while other parts are insufficiently dried. Dtherwise, aside from injuring the product quality, imprecise determination of the temperature can downgrade the drying efficiency.
Quality analysis of microwave dried iron yam chips controlled by
infrared thermal imaging
Song XOADYDNG1,2*
Received 24 July, 2017 Accepted 21 Dec., 2017
1 North China University of Water Resources and Electric Power, Zhengzhou, China 2 College of Food Science and Technology, Henan University of Technology, Zhengzhou, China
*Corresponding authorI: [email protected]
Abstract
The aim was to study the real-time temperature control by infrared thermography and the quality changes of the iron yam chips during drying processes. Microwave (MW) and heat pump (HP) were used to dry iron yam chips at 50, 60 and 70 °C. The material surface temperatures were online controlled by infrared thermal imaging system in the process of microwave drying. Temperature, drying efficiency, texture and color were estimated. The experimental results were shown on the basis of drying process characteristics and dried product qualities. Temperature fluctuations became more violent with the increase of drying time and drying temperature, and had a negative impact on the quality of dried iron yam chips. There were no significant differences of hardness and cohesiveness between both drying methods. The springiness and chewiness values of iron yams dried by HP were lower than samples dried by MW. Ot is worth noting that lightness and white index values of the iron yam chips dried by microwave at 70°C were obviously lower (p < 0.05) than the fresh samples and the iron yam chips dried by heat pump. Keywords: iron yam; drying; microwave; infrared thermal imaging; heat pump.
On this study, in order to control the product temperature, the self-made MW drying system can automatically and continuously convert the power levels by acting on the magnetron duty cycle time. The realizing feedback temperature control signal was provided by infrared thermal imaging, which allowed detecting the instantaneous maximum temperatures of the surface among the iron yam chips distributed randomly on the turning table during MW drying process. As a result, the feedback signal was the highest temperature iron yam chip, not the random one inside the MW chamber, avoiding that the improper temperature control could lead to adverse impacts on the drying process (Lombraña et al., 2010). As far as we know, there is little study on the effects of MW drying controlled by infrared thermography on the iron yam chips’ qualities.
The objectives of this study wereI: To control the iron yam chips’ temperature by infrared thermography. To compare the drying efficiency between MW drying and heat pump drying at the same temperatures. To study the texture and color of iron yam chips generated through different drying processes.
2 Materials and methods 2.1 Materials preparation
Fresh iron yams were purchased from a local market in Zhengzhou, China. The yams with similar size were selected according to the required cylindrical form and stored at 4 °C. The yam had a original moisture content of 70% w.b. Oron yams were peeled and both ends were removed before each experiment. Then, the yams were cut into 3 mm thickness chips with stainless steel blades immediately, and dipped into 0.005 mol L-1 citric acid solution for 5 min. After removing the excess water, the samples were placed on the drying tray in a single layer.
2.2 Experimental setup and methods
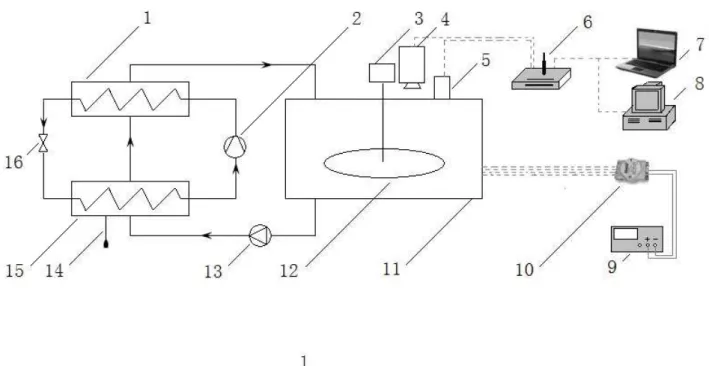
The drying of iron yam chips were performed by using a self-made experimental apparatus which composed of heat pump (HP) dryer, microwave (MW) and an infrared workstation (Figure 1). The dryer consists of a 1.5 kW heat pump to supply heat to the drying chamber, and a centrifugal fan driven by 1.0 kW motor. The dryer also includes a 2.0 kW capacity evaporator, a condensing unit, which consists of a 0.6 kW compressor and a 3.0 kW capacity condenser. The application of the microwave magnetrons with a nominal power output of 1000W operating at a frequency of 2.45 GHz, a double shielded drying chamber (1m3) was developed, which was connected to the heat pump dryer.
The infrared workstation was composed of a thermal infrared imager (RESEARCH-N1) and a remote dynamic control system. The main technical parameters included an uncooled focal plane array, spectral range 8-14 μm, viewing angle 24°×18°, spatial resolution 1.3 mrad, temperature resolution 0.08 °C, frame frequency 50 Hz, autocorrection for set-in blackbody, atmospheric transmissivity and radiance. The blackbody model is LS2000-100 (Electro Dptical Ondustries, ONC., Santa Barbara, California, USA). The internal software allows correction for object emissivity, object distance, relative humidity and ambient temperature. The object emissivity of the iron yam chip was measured by using a reference emitter, a kind of matt paint (PL6201, Guangzhou Bolei Coating, Ltd.) with a known emissivity of 0.98. The black matt paint was masked to the surface of the iron yam chip. Omages of the parts were acquired every 20 s for 10 min. Thermal infrared imaging was used to select an area of the black paint and an area of the slice surface adjacent to the paint. Thermal infrared imaging was also used to measure the temperatures of these areas. The emissivity setting of the area
of the iron yam slice was altered until its temperature was the same as that of the area of the black paint in order to provide the estimated yam emissivity. The object emissivity of iron yam chip (0.95) was measured and inputted in the camera settings as own parameter. The thermal infrared imager monitored the experimental materials through a hole with a diameter of 80 mm shielded with a metallic grid.
Samples weight, internal and external air temperature and humidity, reflected magnetron energy and duty cycle, were measured and transferred to the personal computer (PC) for controlling and recording purposes each minute. Power switching is controlled by remote far infrared dynamic control system. At intervals of 0.5 s, the transient maximum temperature acquired by thermal infrared imaging was transmitted to the control program. With the rotation of the turntable, the surface temperature distribution of each sample will be analyzed one by one. The code automatically adjusted the output power of the magnetron in intermittent mode with constant power density.
The iron yam chips were placed on a porous rotating plate (40 cm diameter, 20 rpm) in one layer and dried by either microwave drying method or heat pump drying method, each operating at 50°C, 60°C or 70°C. The drying characteristics were recorded and analyzed. For microwave drying, air flow of 50°C, 60°C and 70°C from an air blower was ensured in the microwave oven for the removal of moisture from the samples during the experiment. All heat pump drying experiments were carried out under the condition of air velocity of 1.0ms-1, with the microwaves off. The tray with samples was hung on the digital balance (PL2002, Mettler Toledo, Switzerland), which was fixed on the top of the oven to measure the weight change of the sample.
The weight percentage of the mass loss divided by initial water content obtained through the drying curve was used to estimate the final moisture content. On the HP and MW drying process, the water content of the sample decreased from the initial water content to 17% (w.b.). The dried iron yam chips were coolled down to room temperature and put into polyethylene packing bags for further analysis. All experiments were carried out in triplicate and the average values were reported.
2.3 Texture
A texture analyzer model TA-XT plus (Stable Micro Systems Ltd., Surrey, England, U.K.) was used to evaluate the texture properties of the dried samples in compressive form. The iron yam chips were fractured with a plane probe of 30-mm diameter at a test speed of 1 mm s-1. Dried samples were compressed twice to 50% of their original height. The following parameters such as hardness, springiness, cohesiveness and chewiness were determined according to the force–deformation curve. For different drying condition, twenty measurements were performed for each sample.
2.4 Color
A Color Difference Meter was used to measure the color of the dried samples following the method by Song & Li (2012) with some modifications. COE-Lab coordinates were obtained from
the reflection spectra of the samples by a D65 illuminant and observer angle 10°. Color parameters ranged from greenness (–a*)
to redness (+a*);blueness (–b*) to yellowness (+b*); and black (L*=0)
to white (L*=100). Browning index (BO) were calculated based on
the following equation (Bal et al., 2011). On Equation (1) below, it can be seen that the BO can more comprehensively reflects the color change of iron yam chips in the drying process.
* *
* *
( 1.75 )
100 0.31 0.17
(5.645 3.012 )
a L
BI
L a b
+ = −
+ −
(1)
Where L*, a*, and b* are the measured values of dried samples.
On order to reduce the measuring error, a small grinder was used to grind the samples into powder before each measurement. Dne gram of iron yam powder was put into a 2-cm diameter aluminum vessel. The lens of the colorimeter was directly placed on aluminum vessel to measure the color values. For each treatment, twenty individual samples were tested.
2.5 Data analysis
Statistical analysis of variance (ANDVA) was done using SAS (SAS Onst., Onc., Cary, N.C., USA). The significance of differences between means was determined by least significant difference (LSD) test at P<0.05.
3 Results and discussion
3.1 Temperature control of microwave drying process
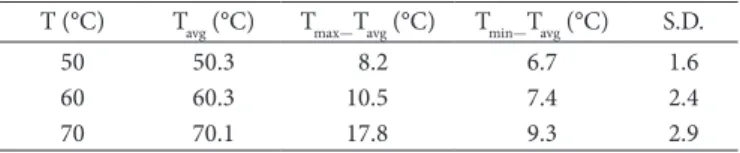
Figure 2 shows the temperature control of microwave drying process at 50, 60 and 70 °C. Table1 shows the setting value (T), average value (Tavg), temperature oscillations and standard deviations (S.D.) during drying process by microwave of iron yam chips. The average value of the maximum temperatures on
Figure 2. Temperature fluctuations on iron yam chips measured by infrared thermal imaging during microwave drying at 50, 60 and 70 °C.
Table 1. Setting value, average value, temperature oscillations and standard deviations during microwave drying.
T (°C) Tavg (°C) Tmax—Tavg (°C) Tmin—Tavg (°C) S.D.
50 50.3 8.2 6.7 1.6
60 60.3 10.5 7.4 2.4
the surface of iron yam chip was close to the setpoint within a difference value of 0.3°C.
From Figure 2 we can see that the temperature fluctuated violently with the drying process. The possible reason is that in the last drying stage, the power density increased with the decrease of sample’s weight. The maximum temperature fluctuations occured during the drying process at 70 °C was 17.8 °C. Results showed that the material temperature must be controlled accurately during the drying process with high temperature, otherwise excessive drying may occur. From Figure 2 we can also see that the temperature oscillations became more intense with increasing temperature. This result was also reported in Table 1, where the standard deviations increased with the increasing drying temperatures. As a result, the instantaneous temperature of the yam chips increased. Ot can be seen from Figure 2 that the amplitude of temperature oscillation was not symmetrical compared with the average temperatures. The maximum temperatures were more deviating from the corresponding average values than minimum temperatures.
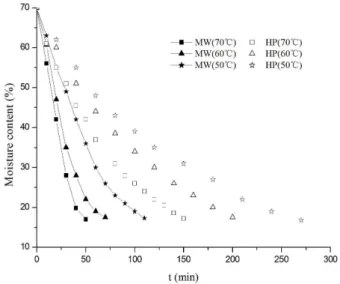
3.2 Drying characteristic curves
Figure 3 shows the typical drying curves of iron yam by HP and MW at different temperatures, which like most of the fruit dryingI: pre-heating period, constant rate drying stage and descending rate drying stage (Bezerra et al., 2015). The curves showed that the water content showed a nonlinear decreasing trend with the drying time prolonging. The results implied that diffusion controlled moisture movement, while water diffusion depended on moisture content. The pressure gradient of water vapor was generated on the inner and surface of the material during microwave drying process, which had an effect on the moisture transfer (Maskan, 2001).
Moreover, results showed that iron yam drying was faster at higher temperatures for MW and HP drying processes, one reason may be that high temperature give rise to the solubility of pectins in iron yam, thereby reducing the cellular tissue rigidity and the resistance of water transport. Similar results were reported by Cuccurullo et al. (2012). From Figure 3 we can also see that, MW drying time was reduced by half when the temperature increase from 50 to 60 °C, while only about 20% of the drying time was reduced when the temperature increase from 60 to 70 °C. This may be that the moisture diffusion coefficient decreased obviously when the drying temperature over 70 °C. Ot can be speculated that under the condition of the temperature, higher pectin gelation of drying samples appeared and the porosity or intracellular spaces decreased, and consequently the moisture diffusion coefficient decreased.
Figure 4 shows the drying rate curves of iron yam by HP and MW at different temperatures. We can see that these curves were overlapped firstly and then showed slightly decreasing slopes as temperatures increased. When the resistance to water transport to the material surface increased, the drying rate decreased during the descending rate drying stage. Therefore, the mechanism of internal diffusion was attributed to the loss of water with the drying process going on. Free water disappeared during the last stage of the falling period. As results, the thermal conductivity reached its minimum, the mass reduced and the power densities
increased. Temperature gradient generated inside the iron yam chip and promoted the moisture out of the sample.
3.3 Texture
The textural property is an important quality attribute of many fruits and vegetables (Song & Li, 2012). As can be seen from Table 2, there were no significant differences (p>0.05) of hardness and cohesiveness for the samples dried by the same method with different temperatures and for the samples dried with different methods by the same temperature. Similar results were obtained by different methods (Cuccurullo et al., 2012; Deng & Zhao, 2008; Ferreira et al., 2008; Contreras et al., 2005).
We can also see that the springiness of iron yams dried by MW at 60°C and 70°C were significantly higher (P < 0.05) than samples dried by MW at 50 °C and by HP. Springiness indicates the ability of the material to revert to its original shape when the deforming force is removed. The definition of chewiness is based on an amount of energy required to masticate a semi-solid sample for swallowing (springiness×hardness×cohesiveness). From Table 2 we can see that the chewiness values of iron yam Figure 4. Drying rate curves of microwave drying process at 50, 60 and 70 °C.
chips treated by MW was significantly higher (p < 0.05) than that of the samples treated by HP. This means that the iron yams dried by MW need more energy to chew. The higher rate of water reduction of MW drying at higher temperature could explain why there were differences in textural properties between different drying methods in the study.
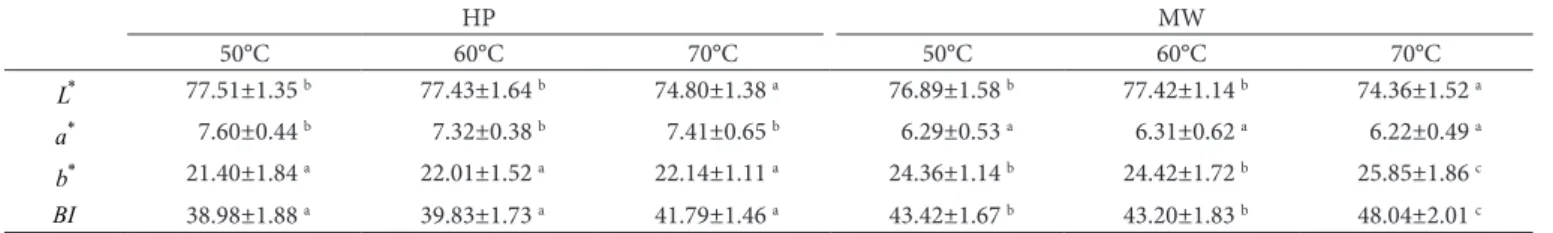
3.4 Colour
Table 3 shows the changes in colour parameters of yam chips with both drying methods at different temperatures. The original values about *
0
L, *
0
a, and *
0
b of fresh iron yam chips are 93.14-0.13 and 5.18, respectively. We can see that the L* values of
dried samples had no significant differences (P>0.05) compared with fresh samples except for samples dried by HP and MW at 70°C. On contrast, a* and b* values of the samples dried by
MW increased significantly compared to the samples dried by HP. As can be seen in Table 3 the iron yams dried by MW at 50, 60 and 70 °C showed a obvious difference (p < 0.05) of browning index (BO) compared with the iron yams dried by HP at three temperatures. Results showed that although MW drying may shorten the drying time, it may also cause the deterioration of the samples’ colour compared with HP drying. Table 3 also shows that the iron yams dried by MW at 70 °C showed a big difference (p < 0.05) of BO compared with samples dried by MW at 50 and 60 °C. Thus, colour changes were mainly affected by microwave temperature of the samples.High temperature drying of iron yam chips results in damage to its structure and colour. Ot was not difficult to speculate that the increase of the temperature during the MW drying process accelerated the browning phenomena.
4 Conclusions
Oron yam chips were dried by microwave and heat pump at 50, 60 and 70°C. The thermal infrared imaging system was used to effectively control the temperature by detecting the instantaneous maximum temperature among the samples under
microwave drying process. Compared with HP drying, drying time of MW heating was reduced significantly, a relatively small temperature fluctuations may be one of the possible reasons. Texture characteristics of iron yam chips dried by MW showed higher values for adhesiveness, springiness and chewiness than that of HP drying. Lightness and browning index values of iron yam chips dried at 70 °C by MW showed significantly lower (p < 0.05) than that of the fresh samples dried by heat pump.
Acknowledgements
This research was funded by the National Natural Science Foundation of China (31301586), the Chinese Postdoctoral Science Foundation (2015M582184).
References
Aktas, M., Şevik, S., & Aktekeli, B. (2016). Development of heat pump and infrared-convective dryer and performance analysis for stale bread drying. Energy Conversion and Management, 113(1), 82-94. httpI://dx.doi.org/10.1016/j.enconman.2016.01.028.
Bezerra, C. V., Silva, L. H. M., Corrêa, D. F., & Rodrigues, A. M. C. (2015). A modeling study for moisture diffusivities and moisture transfer coefficients in drying of passion fruit peel. International Journal of
Heat and Mass Transfer, 85, 750-755. httpI://dx.doi.org/10.1016/j.
ijheatmasstransfer.2015.02.027.
Chen, Y. F., Zhu, Q., & Wu, S. J. (2015). Preparation of oligosaccharides from Chinese yam and their antioxidant activity. Food Chemistry, 173, 1107-1110. PMidI:25466131.httpI://dx.doi.org/10.1016/j. foodchem.2014.10.153.
Contreras, C., Martın, M. E., Martınez-Navarrete, N., & Chiralt, A. (2005). Effect of vacuum impregnation and microwave application on structural changes which occurred during air-drying of apple.
Lebensmittel-Wissenschaft + Technologie, 38(5), 471-477. httpI://
dx.doi.org/10.1016/j.lwt.2004.07.017.
Cuccurullo, G., Giordano, L., Albanese, D., Cinquanta, L., & Di Matteo, M. (2012). Onfrared thermography assisted control for apples
Table 2. Texture properties of iron yam chips dried by heat pump and microwave.
Heat pump MW
50°C 60°C 70°C 50°C 60°C 70°C
Hardness 15.32±1.72 aA 15.52±1.48 aA 15.77±2.12 aA 15.77±1.54 aA 16.42±1.21 aA 16.77±1.35 aA
Cohesiveness 0.53±0.03 aA 0.54±0.05 aA 0.53±0.03 aA 0.56±0.04 aA 0.56±0.05 aA 0.60±0.03 aA
Springiness 0.65±0.06 aA 0.66±0.05 aA 0.69±0.06 aA 0.71±0.05 aB 0.86±0.03 bB 0.84±0.04 bB
Chewiness 11.32±1.43 aA 10.87±1.26 aA 12.57±1.72 bA 15.48±1.66 aB 17.03±1.48 aB 14.66±1.39 bB NoteI: Different letters (a, b and c) indicate significant differences (p < 0.05) among the samples dried to the same method with different temperatures. Different letters (A, B) indicate significant differences (p < 0.05) between the samples dried to the same temperature with different drying methods.
Table 3. Color changes of iron yam chips of different drying treatments.
HP MW
50°C 60°C 70°C 50°C 60°C 70°C
*
L 77.51±1.35 b 77.43±1.64 b 74.80±1.38 a 76.89±1.58 b 77.42±1.14 b 74.36±1.52 a
*
a 7.60±0.44 b 7.32±0.38 b 7.41±0.65 b 6.29±0.53 a 6.31±0.62 a 6.22±0.49 a
*
b 21.40±1.84 a 22.01±1.52 a 22.14±1.11 a 24.36±1.14 b 24.42±1.72 b 25.85±1.86 c
Motevali, A., Minaei, S., Banakar, A., Ghobadian, B., & Darvishi, H. (2016). Energy analyses and drying kinetics of chamomile leaves in microwave-convective dryer. Journal of the Saudi Society of
Agricultural Sciences, 15(2), 179-187. httpI://dx.doi.org/10.1016/j.
jssas.2014.11.003.
Drtiz-García-Carrasco, B., Yañez-Mota, E., Pacheco-Aguirre, F. M., Ruiz-Espinosa, H., García-Alvarado, M. A., Cortés-Zavaleta, D., & Ruiz-López, O. O. (2015). Drying of shrinkable food productsI: appraisal of deformation behavior and moisture diffusivity estimation under isotropic shrinkage. Journal of Food Engineering, 144, 138-147. httpI:// dx.doi.org/10.1016/j.jfoodeng.2014.07.022.
Raghavan, G. S. V., Li, Z. F., Wang, N., & Gariépy, Y. (2010). Control of microwave drying process through aroma monitoring. Drying Technology, 28(5), 591-599. httpI://dx.doi.org/10.1080/07373931003788049. Ray, S., Raychaudhuri, U., & Chakraborty, R. (2016). An overview
of encapsulation of active compounds used in food products by drying technology. Food Bioscience, 13(1), 76-83. httpI://dx.doi. org/10.1016/j.fbio.2015.12.009.
Simha, P., Mathew, M., & Ganesapillai, M. (2016). Empirical modeling of drying kinetics and microwave assisted extraction of bioactive compounds from Adathoda vasica and Cymbopogon citratus.
Alexandria Engineering Journal, 55(1), 141-150. httpI://dx.doi.
org/10.1016/j.aej.2015.12.020.
Song, X. Y., & Li, Y. F. (2012). Cell membrane damage by vacuum treatment at different pressure reduction rates. Journal of Food
Process Engineering, 35(6), 915-922.
httpI://dx.doi.org/10.1111/j.1745-4530.2011.00641.x.
Thirugnanasambandham, K., & Sivakumar, V. (2016). Enhancement of shelf life of Coriandrum sativum leaves using vacuum drying processI: modeling and optimization. Journal of the Saudi Society
of Agricultural Sciences, 15(2), 195-201. httpI://dx.doi.org/10.1016/j.
jssas.2014.12.001.
Vadivambal, R., & Jayas, D. S. (2011). Applications of thermal imaging in agriculture and food industry—a review. Food and Bioprocess
Technology, 4(2), 186-199.
httpI://dx.doi.org/10.1007/s11947-010-0333-5.
Wu, Z. G., Jiang, W., Nitin, M., Bao, X. Q., Chen, S. L., & Tao, Z. M. (2016). Characterizing diversity based on nutritional and bioactive compositions of yam germplasm (Dioscorea spp.) commonly cultivated in China. Journal of Food and Drug Analysis, 24(2), 367-375. PMidI:28911591.httpI://dx.doi.org/10.1016/j.jfda.2015.12.003. Zarein, M., Samadi, S. H., & Ghobadian, B. (2015). Onvestigation of
microwave dryer effect on energy efficiency during drying of apple chips. Journal of the Saudi Society of Agricultural Sciences, 14(1), 41-47. httpI://dx.doi.org/10.1016/j.jssas.2013.06.002.
Zhang, M., Tang, J., Mujumdar, A. S., & Wang, S. (2006). Trends in microwave related drying of fruits and vegetables. Trends in
Food & Technology, 17(10), 524-534. httpI://dx.doi.org/10.1016/j.
tifs.2006.04.011. microwave drying. Journal of Food Engineering, 112(4), 319-325.
httpI://dx.doi.org/10.1016/j.jfoodeng.2012.05.003.
Dadalı, G., Apar, D. K., & Özbek, B. (2007). Color change kinetics of okra undergoing microwave drying. Drying Technology, 25(5), 925-936. httpI://dx.doi.org/10.1080/07373930701372296.
Deng, Y., & Zhao, Y. (2008). Effects of pulsed-vacuum and ultrasound on the osmodehydration kinetics and microstructure of apples (Fuji).
Journal of Food Engineering, 85(1), 84-93. httpI://dx.doi.org/10.1016/j.
jfoodeng.2007.07.016.
Ferreira, D., Silva, J. A. L., Pinto, G., Santos, C., Delgadillo, O., & Coimbra, M. A. (2008). Effect of sun-drying on microstructure and texture of S. Bartolomeu pears (Pyrus communis L.). European Food Research
and Technology, 226(6), 1545-1552. httpI://dx.doi.org/10.1007/
s00217-007-0685-x.
Figiel, A. (2010). Drying kinetics and quality of beetroots dehydrated by combination of convective and vacuum-microwave methods. Journal
of Food Engineering, 98(4), 461-470. httpI://dx.doi.org/10.1016/j.
jfoodeng.2010.01.029.
García-Alvarado, M. A., Pacheco-Aguirre, F. M., & Ruiz-López, O. O. (2014). Analytical solution of simultaneous heat and mass transfer equations during food drying. Journal of Food Engineering, 142, 39-45. httpI://dx.doi.org/10.1016/j.jfoodeng.2014.06.001.
Kumar, C., Karim, M. A., & Joardder, M. U. H. (2014). Ontermittent drying of food productsI: a critical review. Journal of Food Engineering, 121, 48-57. httpI://dx.doi.org/10.1016/j.jfoodeng.2013.08.014. Bal, L. M., Kar, A., Satya, S., & Naik, S. N. (2011). Kinetics of colour
change of bamboo shoot slices during microwave drying. International
Journal of Food Science & Technology, 46(4), 827-833. httpI://dx.doi.
org/10.1111/j.1365-2621.2011.02553.x.
Li, H. Z., Wu, Z. L., Liu, W., Li, Z. Q., Hu, N., & Huang, D. (2016). Recovery of yam mucilage from the yam starch processing wastewater by using a novel foam fractionation column. Separation and
Purification Technology, 171(17), 26-33. httpI://dx.doi.org/10.1016/j.
seppur.2016.07.005.
Lombraña, J. O., Rodríguez, R., & Ruiz, U. (2010). Microwave-drying of sliced mushroom analysis of temperature control and pressure.
Innovative Food Science & Emerging Technologies, 11(4), 652-660.
httpI://dx.doi.org/10.1016/j.ifset.2010.06.007.
Luo, L., Zheng, S., Huang, Y. F., Qin, T., Xing, J., Niu, Y. L., Bo, R. N., Liu, Z. G., Huang, Y., Hu, Y. L., Liu, J. G., Wu, Y., & Wang, D. Y. (2016). Preparation and characterization of Chinese yam polysaccharide PLGA nanoparticles and their immunological activity. International
Journal of Pharmaceutics, 511(1), 140-150. PMidI:27374200.httpI://
dx.doi.org/10.1016/j.ijpharm.2016.06.130.
Maskan, M. (2001). Drying, shrinkage and rehydration characteristics of kiwifruits during hot air and microwave drying. Journal of Food
Engineering, 48(2), 177-182.