A Work Project, presented as part of the requirements for the Award of a Master Degree in Management from the NOVA – School of Business and Economics.
ITALIAN INTERLOCKING DIRECTORATES:
STRUCTURE, EVOLUTION AND CROSS-COUNTRY COMPARISONS
ELENA CASALI – 1272
A Project carried out under the supervision of: Prof. Àlvaro Ferreira da Silva
2 ITALIAN INTERLOCKING DIRECTORATES:
STRUCTURE, EVOLUTION AND CROSS-COUNTRY COMPARISONS
ABSTRACT
Interlocking directorates have historically represented an important characteristic of the Italian corporate network. Pyramidal groups and low developed capital markets have fostered this phenomenon. Nevertheless, the Italian interlocking directorates have registered earlier erosion than in other countries. Analyzing the ties between the 250 largest Italian firms, this work reveals that the major forces shaping the structure of the Italian interlocking directorates are the long-term commitment of banks in financing private companies, the level of shareholder protection and the role of the state in the economy. Cross-country comparisons sustain the first two results, while the effects of state intervention remain ambiguous.
Key words: interlocking directorates, mixed banks, corporate governance, business system.
3 1. INTRODUCTION
“An interlocking directorate occurs when a person affiliated with one organization sits on the board of directors of another organization” (Mizruchi, 1996). The reasons behind this situation have been speculated over time by many scholars; a uniform answer to this issue, however, is not still reached. In particular, a major separation exists between studies that consider IDs as a result of behavioral attitudes of corporations, and studies that relate IDs to the taxonomy of underlying structural characteristics. This work adopts the second approach, considering the peculiar traits of Italy in terms of corporate governance, shareholder protection, business system and state intervention.
Using the structure of interlocking directorates existent between the 250 largest Italian companies as a proxy for the Italian corporate network, this work explores how the Italian corporate network is structured in 2011 and how it has evolved over the past decade, as a result of the economic crisis and the introduction of new laws on corporate governance.
Furthermore, a long term analysis is conducted, adding the findings for 2011 to other seven benchmark years, according to data provided by Rinaldi and Vasta (2012). This trend analysis will permit to relate changes in the structure of the Italian interlocking directorates to major breakthroughs and to understand which forces play a major role in shaping companies’ ties.
Finally, in order to give a stronger support to the analysis and reach more robust conclusions, the structure of the Italian corporate network is compared with the network’s structure in five other countries - France, Germany, Portugal, UK and US - with different levels of shareholder protection and diverse corporate governance models and economic systems.
4 2. LITERATURE REVIEW
The first study on interlocking directorates (IDs) was conducted by the Pujo Committee under the direction of the United States House of Representatives interested in the Investigation of Financial and Monetary Conditions in the US (Windolf, 2002). In more recent years, academic research investigating the underlying causes of IDs flourished. Yet, the reasons behind corporate interlocks still remain ground for discussion. Mizruchi (1996) classifies the different causes stipulated over time in two groups. The inter-organizational causes relate IDs to the companies’ attempt to reduce environmental uncertainties. Differently, the interclass perspective considers IDs as the result of the “oligarchic control” exercised by the business elite to foster cohesion.
More recent research draws the attention to transnational IDs. Kratzer and Van Veen (2011) focus on interlocks formed among European countries in order to understand if the decline of national IDs can be explained by their substitution by cross-country interlocks. Rauch (2001) investigates instead the impact of transnational networks on international trade. Weak enforcement of international contracts and inadequate understanding of cross-country differences can in fact be overcome by creating transnational networks and substituting legal enforcement by trust.
Finally, a third body of literature relates IDs to countries’ specific characteristics and economic system adopted. The “law and finance” approach (La Porta et al, 1998) sees in shareholder protection the main determinant of different IDs choices. In countries granting high shareholder protection, companies allocate decision power to managers and directors have no direct influence on day-to-day decisions. Differently, companies in countries with low shareholder protection are strongly influenced by directors, and shareholders create pyramidal groups and IDs to safeguard their rights
5 (Bianchi et al, 2001). In Italy, pyramidal groups and interlocking directorates traditionally permitted a stable corporate control, but to the disadvantage of minority shareholders and capital market efficiency (Gambini et al, 2012).
Within the same body of literature, the political economy approach shows that IDs tend to change according to the influence exercised by the State in the economy (Rajan & Zingales, 2003). Again, Italy constitutes a typical example since state-owned enterprises have played a central role in the economy, at least until the 1990s.
According to Hall and Soskice (2001), instead, IDs’ structure is determined by specific institutions present in the country, which are in turn influenced by the type of market economy adopted. In liberal market economies exchanges are regulated by free competition and markets are seen as the main institution in coordinating relations among firms. Differently, in coordinated market economies, non-market relationships influence exchanges and are fundamental in providing access to confidential information. In this context IDs are useful in strengthening trust and cooperation. Similar conclusions are reached by Windolf (2002) emphasizing the relation between corporate networks and the type of national business system. This is also linked to the way firms finance themselves (Carroll and Fennema, 2002): in the absence of efficient capital markets, companies rely heavily on bank credits. As a result, banks are strongly exposed to non-financial sectors and create IDs to exercise their voice.
It is within this third body of literature that this research is developed. Italy presents in fact peculiar characteristics in terms of ownership structure, corporate governance system and state intervention. This work will, therefore, try to understand how the composition and configuration of the Italian corporate network have responded over time to these peculiar characteristics and to the major changes affecting them.
6 Adding the results of 2011 to the previous findings of Rinaldi and Vasta (2012), will allow not only to analyze the trend of the Italian IDs over almost one century, but also to assess the effects that the latest changes, namely the economic crisis and the reform of the Italian corporate law, had in the structure of the corporate network. Finally, a comparison with the IDs’ structure in countries with different competition and corporate governance models will permit to confirm or reject the hypothesis that IDs reflect the underlying structural characteristics of the economy.
3. SOURCES AND METHODOLOGY
The data used to develop the network analysis for the year 2011 represents the 250 largest firms by total assets1 incorporated in Italy. Information regarding firms’ names, assets and state participation are extracted from Le Principali Società Italiane, the R&S-Mediobanca annual research. The dataset includes 200 non-financial firms and 50 financial firms, with the exclusion of companies 100% owned by another firm represented in the sample. An adjustment has been made in collecting the 50 financial firms: simply considering the total assets, the sample would contain only banks. In order to have a more representative sample, 25 banks and the 25 largest firms in the sector of insurance, leasing and factoring have been included. The names of the boards’ members were taken from the Consob website for companies listed on the stock exchange, and from Infocamere - the Italian Chamber of Commerce dataset - for the remaining firms.
Decisions on the sample’s composition are driven by the desire to obtain results comparable to those of the previous studies of Rinaldi and Vasta (2012). However, an important difference regards the inclusion of the members of the supervisory board for
1
7 companies adopting the dualistic model of corporate governance. This choice reflects the 2003 reform of the Italian corporate law that allocated more powers to the supervisory board of companies adopting the dualistic board model.
In order to investigate the structure of interlocking directorates at the end of 2011, social network analysis techniques have been applied to the sample using the Pajek program. For the purposes of this analysis, neither the directionality neither the strength of the link has been taken into account. All the measures have been applied to a one-mode network resulting from the conversion of the original two-one-mode network and displaying only firms’ links. The appendix provides additional details on the methodology and reasons behind specific choices.
4. TOP ITALIAN FIRMS: STRUCTURE IN A LONG-TERM PERSPECTIVE
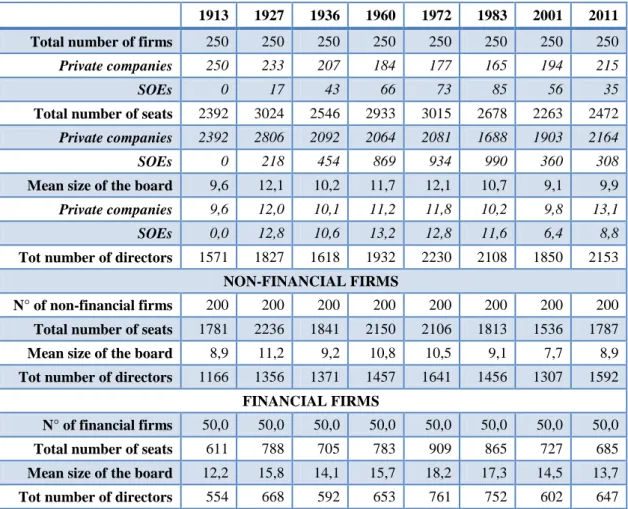
Table 1 summarizes general statistics of the top Italian firms for the eight benchmark years using, for years previous to 2011, data provided by Rinaldi and Vasta (2012). The last column shows that in 2011 the total number of seats was 2472, corresponding to an average size of the board of 9.9. The size of the board is remarkably different between financial and non-financial firms, with financial companies having a larger board of directors than industrial firms. This difference is not limited to 2011: the average size of the board has been larger in financial firms than in non-financial firms for all the period investigated. Interestingly, while starting from 1972 the total number of seats constantly decreased, from 2001 to 2011 it seems to rise again. However, this increase can be misleading: while for the benchmark years from 1913 to 2001 only the members of the board of directors are included, in 2011 for companies adopting the dualistic board model, members of Consiglio di Sorveglianza are included as well.
8 Moreover, the presence 13 cooperatives among the top non-financial firms with, in general, a larger board of directors, is remarkable. Correcting for both the members of the supervisory boards and the cooperatives, the average size of the board is 8.9.
An important distinction that should be drawn is the one between state-controlled and private firms. From Table 1, we can see that in 2011, the state holds a dominant participation2 in 35 out of 200 non-financial companies, while none of the financial firms is state-controlled. The influence of the state in the economy started to emerge in 1927 and reached its peak in 1983, when 85 companies out of 250 (Rinaldi & Vasta, 2012) were controlled by the state. After that year, the role of the state in the economy started to decline. Yet, despite the massive privatization processes of the 1990s, in 2011 the state still controls 17.5% of the top non-financial firms. Most interestingly, of the 35 companies controlled by the state, 11 are among the top 20 non-financial companies and both the top two non-financial firms, ENEL and ENI, are state participated. These evidences reveal that despite the number of state-owned firms drastically diminished from 1983 to 2011, the state continues to control the major Italian companies.
Table 2 shows the sector of activity of the top 250 Italian firms. An adjustment has been made for the holding companies: holding companies have been classified according to the main sector of activity of the controlled firms, except for six of them, for which the identification of a unique sector of activity is restrictive. These six companies are classified as “holdings”, a group that does not appear in previous studies. The most represented sector in all the benchmark years has been the manufacturing industry (Table 2). However, the number of the manufacturing firms among the top Italian firms dropped considerably from 1972 to 2011. Conversely, the growing
9 relevance of sectors that have traditionally maintained a marginal role such as services, warehousing and trade is remarkable. Together, these sectors now represent 24% of the top non-financial firms, signaling a general shift of the Italian economy away from the secondary to the tertiary sector.
The group showing the biggest change across the years is the utilities sector, within which electrical companies have been strongly affected over the years by state intervention. The electricity industry was nationalized in 1962 by a law granting ENEL the monopoly in the various phases of the value chain. This nationalization was accompanied by a consolidation process, decreasing the number of firms in the utility sector from 46 in 1960 to only five in 1972. By contrast, after the implementation of the European Directive 96/92/CE and the privatization of the energy sector, the number of firms included in this sector increased from seven in 1983 to 41 in 2001 (Table 2). However, Rinaldi and Vasta (2012) include also telecommunication firms in this category. This sharp increase should, therefore, be read more as a result of the internet boom and the consequent proliferation of telecom companies than as an increase in the number of electrical companies. In fact, due to the high investments necessary to compete in the electrical industry, companies that entered this sector after the privatization process were few and at the beginning of 2012 the state-participated ENEL remains the largest electrical firm. Following this reasoning, the recent decrease in the number of utility companies can be read as a consequence of the end of the internet bubble and the effect of the financial crisis on the telecommunication sector.
The last aspect to underline is the corporate governance model adopted by the top Italian companies. Although the reform of 2003 allows companies incorporated as
10 250 largest firms opted for the dualistic model - four banks and three non-financial companies - and none of them for the monistic one. The dualistic model was introduced to allow Italian companies to adopt a governance system similar to the one of Germany, given the frequent business relationships linking the two countries. Not surprisingly, the only foreign company adopting the dualistic model is Deutsche Bank SpA.
5. THE CORPORATE NETWORK IN 2011
5.1 Network Structure
Figure 1 shows the graphical representation of the network in 2011. The first feature emerging from the sociogram is the presence of eight separate components: the main component, a smaller component including four firms, an even smaller component with only three firms, and five components constituted by two firms each.
Figure 2 graphically shows that the network in 2011 is less cohesive and inclusive, with 93 isolated firms and only 56% of companies included in the main component. This is reflected in all the measures of cohesion. The total number of ties between firms is in fact considerably low for a sample composed by 250 firms. This is responsible for the low level of the overall network’s density (1.02). The density of the main component, however, is more than three times higher than the density of the total network (Table 3). This result is quite expectable given the absence of other large components besides the main one. Similarly, the average degree of the main component (4.4) is much higher than the network’s average degree (2.55), as shown in Table 3.
In Figure 1, colors indicate the sectors of activity of the firms in the network. The center of the main component is mainly represented by financial companies and manufacturing firms. All the holding companies are included in the main component,
11 except one holding that is part of the component with three firms. Interestingly, utilities companies - that have historically played a prominent position in the Italian corporate network - do not play a central role within the main component. By contrast, a more central position is assumed by building companies and by some companies belonging to the residual sector (airway, warehousing and communication). To be noticed is also the presence of one services company at the very center of the network.
To better understand the role played by different industries, Figure 3 represents the relations between network partitions: the sectors of business activity. The first remarkable aspect is that no industry is completely disconnected. Two sectors, the shipping and the railway industry, assume however a more peripheral position. By contrast, the manufacturing sector results to be the most connected industry, followed by the financial and the residual sector (airway, warehousing and communication). The financial sector, in particular, holds a very central position, denoting the strategic role played by banks and insurances in connecting the whole network. Broad relationships are also maintained by holdings and the utilities industry.
5.2 Actor Centrality
Actor centrality tries to assess which firms play the most important role in the corporate network. Table 4 provides an analysis of actor centrality ranking the ten most central companies on the basis of three measures: degree, closeness centrality and betweenness centrality. Confirming previous findings, the most central sectors according to all the three measures are the manufacturing and the financial sector.
The top two positions in each ranking are occupied by Pirelli & C. S.p.A. and Atlantia S.p.A. Interestingly, Pirelli & C. S.p.A maintains equity participations in other
12 top Italian companies, participations that in many cases overlap with the presence of interlocking ties. Altantia S.p.A., the service company at the very center of the network that was identified before, is part of the holding Edizione S.r.l. Many of the ties Atlantia S.p.A. has are between other companies in which Edizione owns a stake. Therefore, also the interlocks formed by Atlantia S.p.A. can be reconnected to the presence of share participations, albeit indirectly through the intermediation of the holding. Moreover, Pirelli and Atlantia are reciprocally linked by both cross-participations and ID ties.
The fact that two companies occupy the first position according to all the measures of centrality is remarkable because it signals that companies with the highest number of ties also assume a brokerage function in connecting firms otherwise isolated. This is the case not only for Pirelli & C. S.p.A. and Atlantia S.p.A., but also for the majority of top ten central firms. One of the exceptions is represented by Eni S.p.A. that does not appear among the most central companies according to the other measures, but still plays an important brokerage role. Eni S.p.A. is the only state-participated firm among the top central companies.
6 ONE CENTURY OF ITALIAN CORPORATE NETWORK
Figure 2 shows that the Italian network was already highly concentrated in 1913, the first benchmark year, when 91.6% of the firms in the sample belonged to the main – and at that time the only – component. However, the highest level of concentration was reached in 1927 and in 1960. In both benchmark years, the network was structured in three components with the main component comprising more than 90% of the firms.
In 1927 almost all the measures reached their peak (Table 3). Particularly relevant is the density, which registered its record value of 8.61. The period from 1913 to 1927
13 corresponds to the greatest diffusion of the mixed banks. Through the concession of long-term credits to private firms, mixed banks played an important role in financing and sustaining the Italian industrialization process at the beginning of the Twentieth Century (Rinaldi & Vasta, 2012). As Carroll and Fennema (2002) suggest, it was probably the long-term commitment to industrial firms together with a lack of an effective supervision and judicial system that led mixed banks to establish a different type of control over firms’ operations. Not surprisingly, banks were in this period at the center of the Italian corporate network.
From 1927 onward, however, the density registered a sharp decrease. In this period the state created IRI - Istituto per la Ricostruzione Industriale (1933) - in order to take over mixed banks in crisis and consequently also their participations in industrial firms. This period was also characterized by another important breakthrough in the financial system: the abolition in 1936 of the “banca mista” in favor of the specialization principle that determined the separation between financial and industrial firms. The sharp reduction in cohesion is therefore the consequence of the end of strong ties between banks and non-financial firms (Rinaldi & Vasta, 2012). However, the creation of numerous interlocks between SOEs and private firms prevented an even sharper disintegration of the network (Rinaldi & Vasta, 2012). As a result, the center of the network was in this period occupied by large electrical groups and, for the first time, by SOEs. Many factors fostered the interests of both SOEs and private companies to interlock: private investors continued to own equity participations in SOEs, the management in charge before the nationalization was retained, and cartels and agreements established with private firms continued to remain in place even after the nationalizations (Rinaldi & Vasta, 2012).
14 From 1936 until 1960, the connectivity of the network slightly rose again and the percentage of isolated and marginal firms reached their lowest level (Figure 2). In this period the state intervention in the economy was characterized by the creation of ENI in 1953, which signaled the first step toward the nationalization of the energy sector.
The nationalization of the energy sector in 1962 marked an important breakthrough that led to the beginning of the disintegration of the Italian corporate network (Rinaldi & Vasta, 2012). As a consequence, large electrical groups disappeared from the center of the network, and financial companies, together with industrial firms and state owned enterprises, regained in 1972 a central position (Rinaldi & Vasta, 2009). From 1960 onward, density as well as all the other cohesiveness measures started to decline, with the sharpest drop registered in the period from 1972 to 1983, when all measures almost halved. As a result, in 1983, the year in which the presence of the state in the economy reached its apex, the network’s density was less than half the one registered in 1913 in absence of the state intervention.
The year 1983 marks an important difference with respect to 1972 because it signs the exit of SOEs from the center of the network (Rinaldi & Vasta, 2012). The economic crisis caused, in fact, many state-owned enterprises to register great losses in the period of 1972-1983. In this context, the state bought the shares that private shareholders still held in SOEs, subjecting SOEs to a greater influence from political parties and reducing the incentives for private companies to interlock with the now entirely state-owned firms (Rinaldi & Vasta, 2009). As a result, the network in 1983 was more disintegrated than 11 years before, with manufacturing firms holding the central position.
From 1983 onward, the network cohesiveness continued its downward trend, but at a slower rhythm. The biggest change in the network structure after 1983 concerned
15 the number of firms included in the main component: after having remained more or less stable at high levels for all the benchmark years, from 1983 until 2001, this measure drastically dropped and continued to decrease until 2011 (Figure 2). Correspondingly, large privatization processes reduced the state intervention in the Italian economy. Moreover, the reintroduction in 1993 of universal banks in the Italian banking system fostered the establishment of new ties between financial and non-financial sectors, and allowed financial firms to win back the center of the network. This period also corresponds to the disappearance of state-owned banks and the dismantling of IRI.
The causes for the decreased cohesion in 2001 and 2011 must therefore be searched in factors different from those responsible for the weakening of the network after 1972. First of all, the reduced importance of the domestic market for many Italian firms, in contrast to a greater attention toward export, can have acted as a disincentive to national interlocks (Rinaldi & Vasta, 2012). Secondly, the Consolidated Act on Finance, enacted in 1998 to grant a more effective corporate governance system, introduced limits to the accumulation of functions by the members of the supervisory board of companies listed on the stock exchange3. While the exclusive concern of the 1998 Act was to ensure that members of the supervisory board could dedicate enough time to effectively exercise their controlling functions, a different approach can be found in more recent regulations.
In particular, the Manovra Salva Italia (Save Italy Decree) - also called the “Interlocking Ban” - introduced in 2011 a completely new approach in Italy. Similarly to what the Clayton Act stated in the U.S. already in 1914, this new regulation explicitly
3
Art. 144 terdicies, Reg. Emit. introduced two restrictions that apply to all board models:
1) Members of the supervisory board of a company listed on the stock exchange cannot hold this position in more than five listed companies;
2) Members of the supervisory board of a company listed on the stock exchange cannot hold other positions in other corporations if the total “weight” of such positions is higher than 6.
16 forbids to members of the board of directors and supervisory boards of financial firms to exercise similar functions in competing companies. This Decree is therefore moved by a new concern, related to the ability of IDs to ultimately alter competition.
This different concern is also reflected in the latest approach of the European Commission when approving mergers and acquisition processes. In fact, more and more often the EU makes the approval of an M&A dependent on the breaking of interlocking directorates with other competing firms. Exemplary was the case of the acquisition of INA by Generali Assicurazioni in 2000. The process was allowed by the EU only after the members of the board of directors of Generali left the board of directors of other insurance firms.4 According to the European Commission, it was not the M&A process per-se to alter the competition, but instead the “structural and/or personal links between competitors” (Case M. 1712 Generali/INA; 12 January 2000; CEE).
7 CROSS-COUNTRY COMPARISONS
Figure 4 shows the average degree of the network in six countries – Italy, France, Germany, Portugal, UK and US – across four benchmark periods. These countries show important differences in terms of market economy, corporate governance system and state participation. The UK and the US are two examples of liberal market economies, while Germany is the prototype of a coordinated market economy (Hall and Soskice, 2001). By contrast, Italy, France and Portugal take on a more ambiguous position, with an economy characterized by a strong intervention of the state (Hall and Soskice, 2001). Germany has always presented the highest cohesion, followed by Italy until the 1930s. This is not surprising, given that in Germany cooperation, cartels and informal
4 Similar examples happened both in Italy – Fondiaria/Sai, Allianz/Toro, Unicredit/Capitalia – and abroad
17 agreements were not only frequent, but also accepted and even protected by the legislator, at least until 1956 when the first German antitrust law was issued (Windolf, 2002). In Germany the average degree reached its peak in the same year the Italian corporate network registered the maximum cohesion. This can be read as the bailing-out in Germany, as well as in Italy, of many large universal banks (Windolf, 2012). In Germany, the degree remained at high levels despite the sharp decrease; on the contrary, in Italy the average degree at the end of the Twentieth Century was as low as the one of the UK, the country that shows the lowest network connectivity.
Interesting is also the evolution of the average degree in France: the general downward trend common to all five countries for the period of 1928-1938 is broken by an increase in the cohesiveness of the French corporate network. Windolf (2012) interprets this trend as the result of a protective policy adopted by private French companies when the Front Populaire ruled and many nationalization processes started. Therefore, in France state intervention in the economy seems to have positively influenced network connectivity. However, while in Italy SOEs and private companies were part of the same component, in France private companies interlocked only among themselves, with the scope to avoid state intervention (Windolf, 2012).
Surprising is also the increase that the average degree registered in the US from 1937 onward. This increase, even if very moderate, signals a positive attitude of US companies toward interlocking directorates, especially if we take into consideration the efforts that the US Antitrust Commission traditionally made in preventing IDs formation. Even if the US and the UK are traditionally classified as liberal market economies (Hall and Soskice, 2001), US companies have a greater tendency to create interlocks than their British counterparts. An explanation of this divergence can be
18 found in the different corporate governance models. In the US, the law grants cost reimbursement only for proxies sent by directors, discouraging shareholders to propose their own candidates. As a consequence, the chance that personal ties among the corporate elite influence the appointment of new directors is high.
Figure 5 highlights the average degree trend in Italy and Portugal. From 1913 to 1983, the trend in the two countries was similar, even though Portugal always maintained a lower degree. However, from 1983 onward, the reversal of the trend caused the degree in both countries to converge in 2011. Therefore, differently from what we have expected given a general downward trend registered in many European countries, IDs in Portugal are more important today than in the most of the Twentieth Century (Da Silva & Neves, 2013). This increase in network cohesiveness was promoted by three distinctive factors: the new laws that at the beginning of the 1980s allowed the private sector to invest in industries previously reserved to the state, the integration within the European Union and the greater liberalization of the economic system (Da Silva & Neves, 2013).
Despite the differences mentioned above, the connectivity of European networks at the end of the Twentieth Century was on average much lower than the one registered at the beginning of the 1990s (Windolf, 2012). This can be interpreted as the result of different forces. Firstly, the increase in the magnitude of international trade and the corresponding reduced importance of domestic markets may cause firms to lose interest to interlock with other national companies (Carrol & Fennema, 2002). An analysis of international interlocking would permit to understand if this development has resulted in an increase of cross-border interlocks (Kratzer and Van Veen, 2011). Secondly, changes in corporate law regarding interlocking directorates may have discouraged the formation
19 of interlocks which in the future could be banned. In particular, the recent attention the European Commission put on this issue suggests a probable further reduction in networks’ cohesion in the near future.
8 CONCLUSION
The cohesiveness of the Italian corporate network varied considerably over the last century. As a result of the decreasing trend started in 1960, the Italian corporate network in 2011 is less cohesive and inclusive than ten years before.
Over time, changes in the Italian interlocking directorates’ structure reflected the role played by two distinct actors. The first actor shaping the structure of the Italian IDs is represented by the mixed banks, which until the beginning of the 1930s were strongly involved in the share capital and board of directors of non-financial firms. The second one is the state, and in particular state owned enterprises, that by creating interlocks with private firms were able to maintain substantial network cohesiveness even after the exit of the mixed banks from the financial system.
By contrast, recent changes in corporate networks are the result of completely different drivers. In particular, the introduction of new corporate laws and the rising concern of possible anti-competitive effects of IDs - an approach that is completely new for Europe - not only explain the recent reduction in the Italian corporate network, but can predict a further disintegration of ID ties at the European level.
In a cross-country perspective, no clear conclusion can be drawn regarding the effects of state intervention on network cohesiveness; these effects seem to depend on how the intervention is implemented. Moreover, although some differences can be identified between liberal market economies and coordinated market economies, the
20 major drivers for corporate interlocks seem to be the corporate governance model and the level of shareholder protection, as the differences between the US and the UK reveal. In this sense, the case of Italy is exemplar. Regardless of the strong state participation and inefficient capital markets, recent laws granting higher protection of shareholders contributed to the reduction of cohesiveness of the Italian IDs, which in 2011 matched the low levels of the UK.
BIBLIOGRAPHY
Batagelj, Vladimir. Mrvar, Andrej. De Nooy, Wouter. 2011. Exploratory Social
Network Analysis with Pajek. Cambridge University Press.
Bianchi, Marcello. Bianco, Magda. Enriques, Luca. 2001. “Pyramidal Groups and the Separation between Ownership and Control in Italy.” In The Control of Corporate
Europe, ed. Barca Fabrizio and Becht Marco, ch.6. New York: Oxford University Press.
Carroll, William K. Fennema, Meindert. 2002. “Is there a Transnational Business Community?” International Sociology, 17(3): 393-419.
CEE. 2000. “Case M. 1712 Generali/INA”. Decision of 12th January 2000. Consob. February 24th 1998, n° 58. Consolidated Act on Finance.
Da Silva, Álvaro. Neves, Pedro. 2013. “Business Coalitions and Segmentation: Dynamics of the Portuguese Corporate Network”.
Gazzetta Ufficiale. December 27th 2011, n° 300. Manovra Salva Italia.
Gambini, Alessandro. Sarno, Emma. Zazzaro, Alberto. 2012. “Composizione e Struttura di Rete tra le Società Quatate in Italia.” In Reti d’Imprese e Territorio. Tra
Vincoli e Opportunità dopo la Crisi, ed. Zazzaro Alberto. Bologna: il Mulino.
21 The Institutional Foundations of Comparative Advantage, 1-68. Oxford: Oxford
University Press.
Kratzer, Jan. Van Veen, Kees. 2011. “National and International Interlocking Directorates within Europe: Corporate Networks within and among Fifteen European Countries.” Economy and Society, 40(1): 1-25.
La Porta, Rafael. Lopez-de-Silanes, Florencio. Shleifer, Andrei. Vishny, Robert. 1998. “Law and Finance.” The Journal of Political Economy, 106: 1113-1155.
Mizruchi, Mark S. 1996. “What Do Interlocks Do? An Analysis, Critique and Assessment of Research on Interlocking Directorates.” Annual Review of Sociology, 22: 271-298.
Rajan, Raghuram. Zingales, Luigi. 2003. “The great reversal: the politics of financial development in the twentieth century.” Journal of Financial Economics, 69: 5-50. Rauch, James E. 2001. “Business and Social Networks in International Trade.”
Journal of Economic Literature, 39(4): 1177-1203.
Rinaldi, Alberto. Vasta, Michelangelo. 2009. “State-Owned Enterprises in the Italian Corporate Network, 1972-1983.” Business and Economic History - On-line, 7.
Rinaldi, Alberto. Vasta, Michelangelo. 2012. “Persistent and Stubborn. The State in the Italian Capitalism: 1913-2001.” International Conference Corporate Networks in the
20th Century: Development and Structural Changes, University of Lausanne.
R&S Mediobanca. 2012. Le Principali Società Italiane. Milano.
Windolf, Paul. 2002. Corporate Networks in Europe and the United States. New York: Oxford University Press.
Windolf, Paul. 2012. “Corporate Networks in the 20th Century: German, United States and France in Comparison.” University of Lausanne, August 27th-28th 2012.
22 TABLES AND FIGURES
Table 1. Descriptive statistics of the network across eight benchmark years.
Table 2. Top Italian firms by sector of activity.
1913 1927 1936 1960 1972 1983 2001 2011 1. Financial* 50 50 50 50 50 50 50 50 2. Holdings - - - 6 3. Services 8 10 5 4 5 15 10 16 4. Utilities** 37 62 66 46 5 7 41 21 5. Trade 4 8 4 6 5 9 11 17 6. Manufacturing 101 85 98 118 148 142 111 98 7. Mining 9 10 7 9 6 2 1 1 8. Shipping 8 13 2 8 10 8 2 3 9. Railway 21 6 9 2 - - 3 1 10.Tramway 7 3 3 2 1 1 - 1 11. Building 4 3 4 - 3 7 11 21 12. Residual*** - - 2 5 17 9 9 15
Legend: *Financial sector: banks, insurances, leasing and factoring companies; **Utilities:
electricity, water, gas, telephone; ***Residual: airway, warehousing and communication. 1913 1927 1936 1960 1972 1983 2001 2011 Total number of firms 250 250 250 250 250 250 250 250
Private companies 250 233 207 184 177 165 194 215
SOEs 0 17 43 66 73 85 56 35
Total number of seats 2392 3024 2546 2933 3015 2678 2263 2472
Private companies 2392 2806 2092 2064 2081 1688 1903 2164
SOEs 0 218 454 869 934 990 360 308
Mean size of the board 9,6 12,1 10,2 11,7 12,1 10,7 9,1 9,9
Private companies 9,6 12,0 10,1 11,2 11,8 10,2 9,8 13,1
SOEs 0,0 12,8 10,6 13,2 12,8 11,6 6,4 8,8
Tot number of directors 1571 1827 1618 1932 2230 2108 1850 2153 NON-FINANCIAL FIRMS
N° of non-financial firms 200 200 200 200 200 200 200 200 Total number of seats 1781 2236 1841 2150 2106 1813 1536 1787 Mean size of the board 8,9 11,2 9,2 10,8 10,5 9,1 7,7 8,9 Tot number of directors 1166 1356 1371 1457 1641 1456 1307 1592
FINANCIAL FIRMS
N° of financial firms 50,0 50,0 50,0 50,0 50,0 50,0 50,0 50,0 Total number of seats 611 788 705 783 909 865 727 685 Mean size of the board 12,2 15,8 14,1 15,7 18,2 17,3 14,5 13,7 Tot number of directors 554 668 592 653 761 752 602 647
23 Table 3. Network structure and cohesiveness over time.
Table 4a. Actor centrality: top 10 companies by degree
Degree Firm's name Sector Ranking by assets
23 PIRELLI & C. SPA 6 84
21 ATLANTIA SPA 3 38
14 MEDIOBANCA SPA 1 15
13 ASSICURAZIONI GENERALI SPA 1 3
12 ITALCEMENTI SPA 6 68
12 LUXOTTICA GROUP SPA 6 69
11 AUTOGRILL SPA 3 104
11 GRUPPO EDITORIALE L’ESPRESSO SPA 12 198
10 FONDIARIA-SAI SPA 1 26
10 EDIZIONE SRL 2 31
Table 4b. Actor centrality: top 10 companies by closeness centrality
Closeness centrality
Firm's name Sector Ranking by
asstes
23,03% PIRELLI & C. SPA 6 84
22,43% ATLANTIA SPA 3 38
20,59% MEDIOBANCA SPA 1 15
20,59% GRUPPO EDITORIALE L’ESPRESSO SPA 12 198
20,48% ITALCEMENTI SPA 6 68
20,22% LUXOTTICA GROUP SPA 6 69
20,22% IMPREGILO SPA 11 102
20,01% FRENI BREMBO SPA 6 229
19,91% ASSICURAZIONI GENERALI SPA 1 3
19,76% AUTOGRILL SPA 3 104 1913 1927 1936 1960 1972 1983 2001 2011 N° of components 1 3 5 3 3 5 12 8 % of firms in the main component 91,6 93,6 89,2 91,60 88,80 83,60 61,20 56
Tot number of lines 1484 2680 1693 1768 1270 657 420 319
N° of multiple lines 304 736 463 545 291 182 143 68
Density (x 100) 4,77 8,61 5,44 5,68 4,08 2,05 1,35 1,02
Average degree 11,9 21,4 13,5 14,1 10,2 5,1 3,4 2,55
DiameterD Diameter 7 6 6 7 7 9 11 9
Density of the main component (x 100)
- - - 3,14
Average degree main component
24 Table 4c. Actor centrality: top 10 companies by betweenness centrality
Betweenness centrality
Firm's name Sector Ranking by
assets
7,69% PIRELLI & C. SPA 6 84
6,53% ATLANTIA SPA 3 38
4,08% FRENI BREMBO SPA 6 229
3,70% BUZZI UNICEM SPA 6 91
3,27% LUXOTTICA GROUP SPA 6 69
3,23% ASSICURAZIONI GENERALI SPA 1 3
2,71% GRUPPO EDITORIALE L’ESPRESSO SPA 12 198
2,61% FONDIARIA-SAI SPA 1 26
2,46% ENI SPA 7 6
2,31% MEDIOBANCA SPA 1 15
Figure 1. Network in 2011 with identification of firms’ sector of activity*.
* Legend provided in the next page.
Figure 2. Network integration over time.
0 50 100 150 200 250 1913 1927 1936 1960 1972 1983 2001 2011
Number of marginal firms
Number of isolated firms
Number of firms in the main component
25 Figure 3. Relations between partitions.
Figure 4. Average degree across countries.
*Data for Germany, US, France and UK from Windolf, 2012. **Data for Portugal from Da Silva & Neves, 2013.
Figure 5. Network’s average degree in Italy and Portugal.
*Data for Portugal from Da Silva & Neves, 2013. 0 5 10 15 20 25 30 35 40 45 1913/14 1925/28 1937/38 1993/97 Germany US France UK Portugal Italy 0 5 10 15 20 25 Italy Portugal Legend Financial sector Holding Services industry Utility sector Trade companies Manufacturing Mining industry Shipping industry Railways Tramways Building Residual