1 A Work Project, presented as part of the requirements for the Award of a Master Degree in
Management from the NOVA – School of Business and Economics.
Innovation in the EU- From the SME Instrument to the Accelerator
Pedro Miguel Amaral Carvalho
A Project carried out on the Master in Management Program, under the supervision
of:
Professor Francisco Queiró
2
ABSTRACT
The European Union has been increasingly investing in innovation, through the allocation of grants to SME’s and Startups with new and social impactful business ideas. This paper aims to assess the
financial impact of the SME Instrument (SMEI) grant in its recipients, when the EU is discussing
the transition from the SMEI to the “Accelerator”, under the new Horizon Europe. The effects of
the SMEI were found statistically significant in the volume of Assets and number of Employees,
when compared to the control group, while no evidence was found of the effect of this grant on the
performance of P&L and Revenues. Additionally, more asset intense industries were found to tend
to be more impacted by the grant than the more intense ones and there was no strong relation found
between the propensity of private investors to invest in a specific industry and the impact of the
grant in that industry.
Keywords: Public Funding, Startups, Small-Medium Enterprises, European Union
This work used infrastructure and resources funded by Fundação para a Ciência e a Tecnologia
(UID/ECO/00124/2013, UID/ECO/00124/2019 and Social Sciences DataLab, Project 22209),
POR Lisboa (LISBOA-01-0145-FEDER-007722 and Social Sciences DataLab, Project 22209) and
3 Introduction - Public funded R&D in the European Union
The European Union was born as an international organization which, at the time, had as its main
objective to rebuild Europe from the ashes of the II World War and ensure that such an event would
never occur again. Since 1957 it has went through several enlargements, growing from 6 to 28
countries. As it was growing, its objectives and scope of activity have also changed, and the
European Union has nowadays a wide range of areas in which it acts. From Social Causes, to
climate Action, passing by Science and Technology, External Affairs or Agriculture. The EU has
been working in several fields, always with an articulated and integrated approach amongst all
member-states. With such a diversified scope of areas in which it has action, the R&D funding
budget has also been substantially increasing over time.Between 2007 and 2017, the EU budget
for R&D increased from 1.77% of the European Union’s GDP to 2.07%, which was translated into
a growth from 229 601 million euros to 318 108 million euros spent. The target of the EU for 2020
is to reach the 3% of the EU GDP spent in R&D by 2020.
The European Union has been playing a substantially important role in boosting the innovation and
technological developments in Europe and it has been allocating a sizable amount of resources on
that. Due to political and historical motivations, the EU aims to position Europe as an innovation
hub and compete with the United States of American in the creation of scientific knowledge as a source of economic growth, through startups and SME’s, for instance. However, the allocation of
public funds to this kind of projects might not be an obvious choice as it has a considerable high
opportunity cost, such as the investment in sectors with a much more immediate impact, as it is the
case of Health, Agriculture or the Social Sector. Having this been said, it is important to understand
the rationale behind the public investment in disruptive innovation. Firstly, does R&D have a
4 question. The constant improvement of human living standards, is, in a sizable portion, attributed
to technological breakthroughs that impacted multiple dimensions of our life, such as healthcare,
mobility or communications. These innovations would not be possible without considerable
amounts of funds, especially in the last decades when the new scientific progresses demanded
increasing amounts of human and technological resources.
Being relatively undisputable that R&D is a key factor for human progress, why should public
institutions, in this case, the European Union, allocate their resources to it? Should not the market
validation of the importance of these projects, and the following investment, be enough to make
good ideas to prosper and positively impact our society? The commonsense acknowledgement in European Institutions is that the answer to the previous question is “No”. There is the idea that “the
private sector does not internalize the social benefits of innovation”, a fact that urges the EU to
take actions to compensate this market gap. Private interests are seldom willing to invest in a wide
set of areas due to its low potential market or its high level of risk, usually associated with the early
stage of development of these projects. Also, in the medium-term, R&D not only brings positive
results for its company but also implies positive externalities for other companies who can learn
from it. For these reasons, the EU has been creating mechanisms to compensate the absence of
response from the market to these situations. Startups or Small and Medium Enterprises, usually
do not have at their disposable the own resources to perform the research and product development
that will enable their product or services to reach the market or even private investment. In this
stage, the European Union tries to understand the potential impact of a given product or service,
and, also taking in consideration the financial viability of the project, decides about the allocation
5 The several mechanisms and Programs that EU has been creating to support these projects have
suffered significant mutations throughout the years and have also been awarded with a growing
share of the European Union budget, a fact that clearly signalizes the growing importance that these
matters have deserved from the higher decision makers in the European context. The Research for
the Benefit of SME( RSME), under the FP7( 7th Framework Program for Research), one of the first
grant programs from the EU, between 2007 and 2013 had an overall budget of 1.33 billion euros.
The Small-Medium Enterprises (SMEI) instrument is now coming to an end with a total of 2.8
billion euros invested and the upcoming Accelerator, from the recently created European
Innovation Council(EIC), has only for its first pilot (2019-2020) a budget of 1.3 billion euros.
The main objective of this paper is to assess if the Grants awarded by the European Union under
the SMEI represent, in fact, a boost in the performance of its recipients. The optimal approach to
this question would be the use of the Seals of Excellence recipients as the control group of the
treatment effect – receiving the grant. As explained in the next sections, the Seals of Excellence
constitute the optimal control group for the intended analysis, however, the access to its identity
was requested to the European Commission via email, but, unfortunately, due to confidentiality
reasons, that access was denied for the purposes of this study. The alternative matching strategy
relied on the selection of companies from the same country, operating in the same Industry and
displaying similar financial indicators before the receipt of the grant by the control group. The main
conclusions point for a positive impact of the SMEI funding in the Volume of Assets and
Employees, but no significant effect of the Grant was found on the P&L and Revenues. It was not
possible to establish any relation between the magnitude of the grant effect in each company and
6 Literature Review
The literature about the impact of public investment in R&D via this kind of subsidies is vast and
it is focused on mainly three aspects: the increase on the production of scientific knowledge after
the grant, the crowding-out effect that the public grants can have on the private investment and, lastly, the impact of the grant in the firms’ financial performance. The main focus of this research
will be the latter one. Sabrina Howell in “Financing Innovation: Evidence from R&D Grants”,
approaches this thematic with respect to the US Department of Energy’s SBIR grant program. This
program, prior to the SMEI, is, in many aspects very similar to it. It targets technological companies
with a social and/or climate impact. The Phase 1 grant corresponds to 150 thousand dollars and the
Phase 2 grant corresponds to 1 million dollars. Howell uses as control group of her research, the
set of companies that have applied for the grant but were not awarded with it. The study concludes
that the treatment effect leads to an increase in Revenues with a coefficient of 30%. Regarding the
type of industries that tend to benefit more from the public grant, Howell states that the hardware
industries are more likely to benefit from the grant than the software ones. Raffaello Bronzini and Eleonora Iachini in “Are Incentives for R&D Effective? Evidence from a Regression Discontinuity
Approach” have also reached some interesting conclusions, namely that small U.S. firms tend to
increase their investment by the amount of the grant they have received, a fact that tends to increase
their volume of Assets in the Balance Sheet. EU itself has also been producing several documents
in which evaluates its programs, according to different frameworks. It is worth mentioning that The Research for the Benefit of SME’s report clearly addresses the lack of SMART (Specific,
Measurable, Attainable, Relevant and Time-based) criteria to evaluate the program, which can be
a drawback in the alignment of objectives across the stakeholders. However, it has focused his
analysis on three main indicators: Employment Growth, Growth in Operating Revenue and Growth
7 Dijk dataset, using a nearest neighbor matching one-to-one that used as criteria the country of
origin, the number of employees and the sector, only in the variable of Employment the EU grant
was found statistical significance. It is worth mentioning that this econometrical study was
elaborated in 2014, with FP7 winners from 2007 to 2013, being the time horizon of the study
indicated as probably too short to properly assess the impact of the RSME, especially regarding
the other indicators: Profit Margin and Revenue. However, the RSME participants, in interviews
made, have reported an average increase of 16% in turnover, exports and employment.
The SME Instrument
The Small and Medium Enterprises Instrument is the Instrument, which is part of the Horizon 2020
Program, that has been used over the last years, from 2014 until now, to finance a set of projects
that can be framed in a considerably specific set of characteristics. The SME Instrument targets “high growth, highly innovative, Small and Medium Enterprises (SMEs) with European and global
ambitions”. In addition to that, over the last years it has been pursuing the goal of trying to
conciliate these requirements with a positive social or climate impact, handling the political
directives of the European Union and aligned with the Pillars of the Horizon 2020 itself. The
Horizon 2020 was conceived based on three pillars: Societal Challenges ( climate action, energy
efficiency, green mobility, food security, demographic challenges, etc.), Spreading Excellence and
Widening Participation and Science with and for Society and all the instruments/funds created from
it, should be aligned with, at least, one of its Pillars.
Evaluation Process- The Seals of Excellence
The evaluation of applications for the SMEI has been evolving over the years of the Program, but
it has always been made upon three award criteria: “Excellence”, which evaluates the innovative character of the project, “Impact”, which looks at the project’s ability to meet the market needs and
8 address a specific problem of society and “Implementation”, which evaluates the feasibility, the
coherence and efficiency of the project.
The program is divided in 2 Phases. The phase 1 corresponds to a fixed funding amount of fifty
thousand euros which is meant to be used in a feasibility assessment and business plan elaboration.
The phase 2 is the most important one and the amount of its grants range from five hundred
thousand euros to two million and five hundred euros, depending on the idiosyncrasies of each
project. It is worth to reinforce that these amounts are awarded in the form of non-repayable-grants,
meaning that the European Union will not have any direct financial return from these funding
operations, but it requires each project to have at least 30% of private funding, i.e., the European
Union maximum percentage of financing of each project is 70%. The access to the funds is made
throughout the duration of the project and it is conditional on several documents in which the
recipient is obliged to report its activity and make clear how the funding received is being spent.
The Phase 1 projects have the duration of 1 year, while the Phase 2 may last from 1 to 2 years,
being the payments always split throughout the time of the project.
The access to this fund is remarkably competitive. Between 2014 and 2017, 46 772 applications
were submitted por Phase 1 and Phase 2. 124 million euros were allocated to 2480 Phase 1 projects
and 1194 million to 729 phase 2 projects. These numbers reflect an 8% success rate for applications
for phase 1 and a 4.8% success rate for phase 2 application. Each application is classified in a scale
from 1 to 15, according to the previously mentioned criteria. According to the European
Commission there is a vast majority of companies, ranging from 60% to 85% which are rejected
because they simply do not gather the required conditions to be funded by the SMEI instrument.
However, there is a sizable portion of the rejected companies (between 15 to 40%) which is rejected
9 were marked with a very good grade, but they were not ranked in an eligible position to be funded
within the available budget for that specific call. As a mean to overcome this problem, the European
Commission created the Seal of Excellence (SoE) distinction. The SoE was created to distinguish
companies that were not funded but were ranked above a specific threshold in the evaluation
process. At the moment, to receive one Seal of Excellence the project must be marked with at least
13 points out of 15. In order to compensate these companies, the main goal of this Seal was to ease
the access of its holder to the national structural funds of its respective country. However, since the
creation of these Seals, the mechanisms of conversion from SoE to Structural funds did not come
up as linear and simple as the European Commission and the Commissioner Carlos Moedas wanted
it to be, a fact that is verifiable by the low percentage of Seals of Excellence recipients that were
funded through Structural Funds. Despite the fact that the SoE did not have the results they were
intended to have, it is important to understand that they can represent other benefits for its
recipients. The SoE can be an important signal to private investors, as long as it is properly
publicized by its owners. Venture Capital Funds and Private Equity Funds are potential kinds of
investors that can be interested in using this classification from the European Union to scout their
potential investments and save some resources in due diligence.
The Impact of the SME Instrument
After a brief introduction about the SME Instrument and how it works, it is time to introduce one
of the main questions of this research: is there statistical evidence that sustains the idea that the
funding form the EU has been a factor of financial success for the Phase 2 winners? Is the Phase 2
grant enabling them to outperform their industry and overcoming a hypothetical market gap? As
previously mentioned, the EU obliges every grant recipient to comply with a set of bureaucratic
requirements, but they do not constitute a significant source of pressure for the company to deliver
10 the European Union and other institutions, that clearly depict the SMEI as a very successful
program from different perspectives, there is not an obvious comparison with companies that were
not awarded with the EU grant. The goal of this research it to understand how the results of the
funded companies are ranked when compared to their similar. Following this path, it will be
possible to state with more confidence how important was the public funding from the European
Union for the results of the winning companies. By analyzing specific variables of interest, in the
next pages, this study is going to evaluate the performance of a set of companies which received
the European Union grant and another comparable set of companies that were not awarded with
the Phase 2 of SMEI funding.
Data Selection
As previously mentioned, the SMEI was launched in 2014 and it had already 29 cut-off dates. In
order to properly assess the progress of each company, bearing in mind that the kind of projects
targeted by SMEI usually needs some years to reach the market in a stable manner, the focus of the
analysis will rely only on the companies which were awarded with the grant in 2014 and 2015.
This way, it will be possible to study the performance of companies that, on average, have reached
a certain level of maturity and already went through its first years of activity. Another important
aspect which was taken into consideration was the relative dimension of the grant compared to the
company dimension. The SMEI instrument is awarded to projects, not to companies, meaning that,
as long as the companies comply with certain criteria, they may propose a project to be funded.
However, the importance of each project for the activity of the company may vary. There are
companies whose only project and revenue’ stream is the one which got funded by the SMEI and
there are others that have many other projects besides the one that was funded. Being the aim of
this analysis to understand the impact of the Phase 2 funding in the performance of its recipients it
11 available data regards to the overall results of each enterprise. Therefore, in order to mitigate this
problem, it was decided to disregard companies that presented these two conditions
simultaneously: the amount of funding received from EU represented less than 40% of their assets
in the current year and companies whose incorporation date was prior to 2013. This way, the
research will be able to consider the effect of this funds in fast-growing companies, that managed
to grow with several projects in a short period of time, but also older companies, that have been
incorporated several years before the grant, but only due to the project financed by SMEI grant
have started to have more active operations. With this filter, from 177 companies in 2014 and 194
in 2015, were maintained a total of 140 companies (58 from 2014 and 82 from 2015).
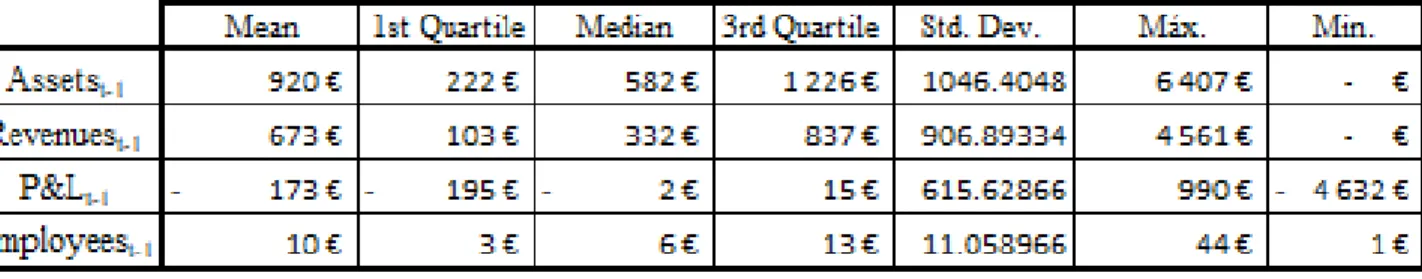
The 140 companies can be described according to the following parameters:
Fig. 1 Treatment Group - Descriptive Statistics
The Control Group
The first objective of the research was to use the Seal of Excellence recipients of 2014 and 2015 as
the control group of our analysis. These companies gather some conditions that can be considered
optimal to perform the intended comparison. As previously explained, the SoE are awarded to
companies with a very good grade in the selection process that tend to have a similar profile to the
ones who managed to get funded. With each assessment being made with a high level of detail , it
is reasonable to assume that, in the top tier applicants, the classifications that motivates a company
12 the evaluators and are not completely objective. In fact, as Powell concluded, the grant decision,
above a certain threshold can be perceived as random from a private perspective. All these factors
would contribute to make the SoE recipients an ideal set of comparable companies to the ones
awarded with the grant. However, after extended endeavors to have access to the identity of the
Seal of Excellence recipients, the European institutions who own this information were not able to
disclose that, a fact that obliged this research to abandon this approach, which could be considered
to be the most appropriate one. As an alternative, the set of companies that composed the control
group had to be constructed based on the profile of the set of the phase 2 recipient companies.
To form the control group there were 4 main financial indicators considered: Volume of Assets,
Revenues and P&L and the number of Employees. These indicators were considered in two
perspectives: its absolute value in t-1,the year prior to the grant receipt,(“Assetst-1”, “Revenuest-1”,
“Employeest-1” and “P&Lt-1”), and its growth rate from t-2 to t-1( “gAssets”, “gRevenues”,
“gEmployees”and “gP&L”), . The Incorporation Date (“Date”) was also considered.
In addition to the 5 previous indicators, the country of origin and the industry (NACE Rev. 2) of
each company were also taken into account to construct the control group being used as the first
binding conditions, whenever it was possible. The function that calculated the nearest neighbor
match was based on a Euclidian distance function. In order to assure that the 9 indicators would
have the same importance in the computation of the nearest neighbor match, they were all
normalized. For instance, to normalize the distance of a company i with respect to the phase 2
recipient firm z in the Assets variable, the following calculation was made: Normalized
Assetsiz(NAssetsiz)= Assetsiz/
σ
Assets , in which Assetsiz = |AssetsZ t-1 – Assetsi t-1| andσ
Assets13 for the 9 variables, and then each distance NDistanceiz was calculated according to the following
formula:
√𝑁𝐴𝑠𝑠𝑒𝑡𝑠𝑖𝑧2+ 𝑁𝑅𝑒𝑣𝑒𝑛𝑢𝑒𝑠𝑖𝑧2+ 𝑁𝑃/𝐿𝑖𝑧2+ 𝑁𝐸𝑚𝑝𝑙𝑜𝑦𝑒𝑒𝑠𝑖𝑧2+ 𝑁𝐷𝑎𝑡𝑒𝑖𝑧2+ 𝑁𝑔𝐴𝑠𝑠𝑒𝑡𝑠𝑖𝑧2+ 𝑁𝑔𝑅𝑒𝑣𝑒𝑛𝑢𝑒𝑠𝑖𝑧2+ 𝑁𝑔𝑃/𝐿𝑖𝑧2+ 𝑁𝑞𝐸𝑚𝑝𝑙𝑜𝑦𝑒𝑒𝑠𝑖𝑧2,
Fig. 2 Normalized Euclidian Distance Formula for the nearest- neighbor match.
The control group was created, by assigning to each one of the 140 companies under analysis, the
companies with the 10 lowest values of distance. In some cases, where there was not a similar
company in the same country operating in the same industry, the algorithm would search for
companies operating in the same industry, and, in case there was not still enough companies to
fulfill the list of 10 in this subset, it would only take the country as criterium. The control group
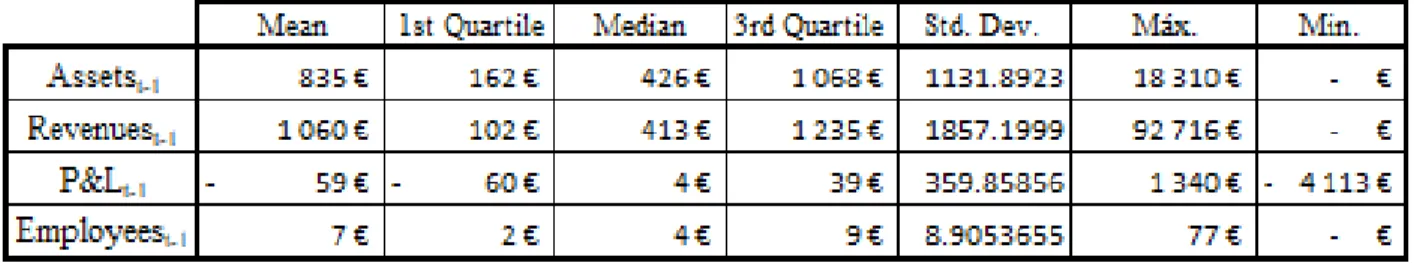
constructed displays the following features:
Fig. 3 Control Group - Descriptive Statistics
The Model
In order to perform the intended analysis, the values of Revenues, Assets, P/L and Number of
Employees were set as the Performance Variables that will constitute the success indicators of each
firm. Each variable was chosen for specific reasons: Revenues are a very good proxy for technology
validation from the market, Profits may reflect the financial sustainability of a company, while
14 special note for the fact that the EU has a particular focus in the creation of jobs within the funded
companies.
To construct the data for the performance variables mentioned above, it has been collected data
correspondent to the year immediately before the receiving of the grant until the latest year
available.
The main indicators of performance of the selected companies will be the evolution of these values from the “year -1”, the year before the grant until the “year +2” or “year +3”. Bearing in mind that
the kind of companies under the scope of the analysis need some time to start reflecting the impact
of the funds received on its financial results, the wider the interval of comparison, the better.
However due to the scarcity of available data for t+3, specially for the companies funded in 2015,
the following analyses will mostly rely on year +2, unless stated otherwise.
The dependent variables will be studied without the use of growth rates from t-1 to t+3 or t-1 to
t+2, being t the year when the grant started to be transferred. The values of the “performance variables” in the years t+2 or t+3 will be the explained variables of our model and the values from
t-1 will be one of the explanatory variables of the research. Compared to the use of growth rates,
by using this approach. the degrees of freedom of our model is increased by one unit. The purpose
of the change in the variables, making the starting level as one of the explanatory variables of the
model, is to account for the possibility of the starting level to have different weights in the final
level, across the existent range of variables and companies. For interpretation purposes, the
Performance Variables of this study will be logged, in order to depict each percentual variation
with respect to the receipt of the grant. Moreover, logged variables were also used to Normalize
our data, handling the right skewness of the distribution, confirmed by the fact that all the
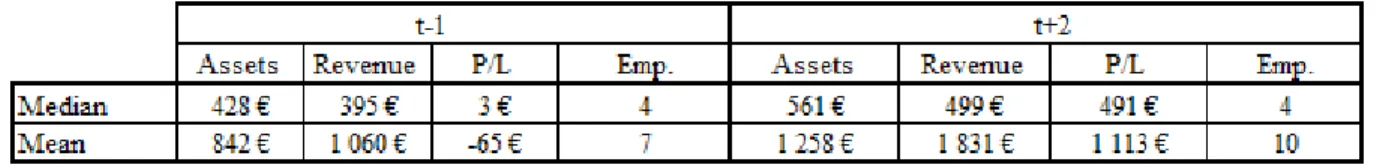
15
Fig. 4 Mean and Median Values for each Performance Variable in t-1 and t+2.(values in thousand euros)
In order to make the model as insightful and explanatory as possible and clean the effect of our
treatment variable- the receipt of the phase 2 grant – other variables were introduced. The GDP growth rate, the GDP growth rate of each company’s country in the period under analysis and three
of the main variables used to construct the control group: the Country of each company(dummy),
the Industry in which it is operating(dummy) and the Incorporation Date. With these new variables,
the model will account for the exposure of each country to exogenous variables that tend to affect
its performance. The main explanatory variable will be the binary variable “Grant” (“1” if the company was funded by the SMEI and “0” if it was not) , however throughout the study, other
alternative variables will be tested, such as the “Funding Percentage”, which will reflect the
percentage of the EU funding in the overall budget of the project ( EU contribution/ Total Budget*100) and “Funding Budget” which will correspond to the total EU contribution.
Results
1. The Impact of Receiving the Grant
The following equations (1-4) show the main independent variables of the first approaches
attempted.
16 (2) logRevenuest+2 = 𝛽0 + 𝛽1 logRevenuest-1+ 𝛽2 Grant
(3) logP&Lt+2 = 𝛽0 + 𝛽1logP&Lt-1+ 𝛽2 Grant (4) logEmployees t+2 = 𝛽0 + 𝛽1logEmployees t-1+ 𝛽2 Grant
The results of these first equations varied across the performance indicator used, specially the
statistical significance of the variable under testing, “Grant”: whether companies have received or
not the EU grant. The variable “Grant” is calculated statistically significance in the performance
indicators for Assets and Employees with p-values of 0.00, having as reference a 5% confidence
level in a bilateral test. In P/L and Revenues the calculations yielded a p-value higher than 5%
which does not allow the rejection of the null hypothesis (𝛽1 = 0). Focusing the attention of the
study of the remaining ones, all of them are statistically significant with a positive coefficient for the “Grant” variable. This indicates that, according to the analysis performed, companies that
received the SMEI grant tend to have higher relative values in Assets and Employees than the
comparable ones. According to the coefficients presented, on average, a Phase 2 winning company
presents 72% more assets and 52% more employees. (Appendices 1 to 4)
These results constitute a considerably strong evidence that, two years after the companies have
started to receive the grant, they are consistently performing above average in the mentioned
indicators.
The lack of statistical significance of the “Grant” factor in the “P/L” and “Revenues” variables can
be explained, precisely, by the short period of time under analysis. A consistent profit is a
consequence of a mature, sustainable and well-structured business plan with ability to deliver
constant Revenues, and, according to the criteria for the Phase 2 of the SMEI, it is credible to state
17 intensive and demand a sizable initial investment, the first years of activity might not be so bright
in this chapter, as these products tend to take some time to properly reach the market and increase
sales.
These results can be interpreted as a sign of a sizable structural growth of the company (higher
level of assets and more employees), but also demonstrate that the grant does not contribute for a
faster market validation (revenues) and profit.
The second models (5-8) built are similar to the first one, with the slight difference of using values
of t+3 in the explanatory variable, instead of the values of t+2. Although the reduced data available
to perform these analyses when compared to the previous ones, this model intends to study how the statistically significance of the “Grant” variable evolves with the addition of one year.
(5) logAssetst+3 = 𝛽0 + 𝛽1logAssetst-1+ 𝛽2 Grant (6) logRevenuest+3 = 𝛽0 + 𝛽1 logRevenuest-1+ 𝛽2 Grant
(7) logP&Lt+3 = 𝛽0 + 𝛽1 logP&Lt-1+ 𝛽2 Grant (8) logEmployees t+3 = 𝛽0 + 𝛽1 logEmployees t-1+ 𝛽2 Grant
After performing the regression, the “Grant” variable remains statistical significant in the same 2
performance indicators under a 5% confidence level in a bilateral test : Assets and Employees.
According to the results of the regression analysis on average, a Phase 2 winning company presents
77% more assets, 51% more employees than their comparable (Appendices 5 to 8). It is worth
noting that the magnitude of both effects - in the number of employees and in the volume of assets
18 However, by deepening the analysis on the control variables, there are important aspects observed
that can be considerably useful to explain some of the previous results.
2. The Industry Effect
Regarding the Industry factor, it is worth remarking that the 140 Phase 2 recipients represent 55
different industries which signalizes a considerable dispersion of companies amongst industries
with a vast majority of the industries, 36 out of 55, being represented by one single company.
However, there is a significant concentration of Phase 2 winners in three industries that jointly account for 41% of the recipients of the grant. These industries correspond to “Computer
Programming Activities” (6201), “Engineering activities and related consultancy” (7112) and “Other research and experimental development on natural sciences and engineering” (7219).
Having reached this conclusion, the next section of this research will look at these industries in
more detail, due to the possibility of making more robust inferences. In order to proceed with the
described analysis, were generated Interaction terms that will be used to understand which
industries are more exposed to the grant receipt. These Interaction Terms will be generated for each
industry as the following example: InteractionI7219= I7219* Grant, and it will be introduced in
the equation regression as follows:
(9) logAssetst+2 = 𝛽0 + 𝛽1logAssetst-1+ 𝛽2 Grant + 𝛽3 InteractionIndustry (10) logRevenuest+2 = 𝛽0 + 𝛽1 logRevenuest-1+ 𝛽2 Grant + 𝛽3 InteractionIndustry
(11) logP&Lt+2 = 𝛽0 + 𝛽1logP&Lt-1+ 𝛽2 Grant + 𝛽3 InteractionIndustry (12) logEmployees t+2 = 𝛽0 + 𝛽1logEmployees t-1+ 𝛽2 Gran + 𝛽3 InteractionIndustry
19 Starting with the “Computer and Programming Activities”(6201), and running the models (9-12),
within the overall sample, it is interesting to conclude that the “Grant” variable was found
statistically significant only on the Assets and Profit and Losses parameters, with negative
coefficients.(-49% and -221%, respectively) ( Appendices 9 to 12) . This result is a strong evidence
that, in one of the most fast-growing market of the last years, tendentially with a negative asset
intensity, the EU grants are not associated with a better perfomace. This exact same pattern is
verified both for t= 2 and t= 3, with extremely similar p-values for each “performance variable”.
Regarding the other most represented industry in this research: “Other research and experimental
development on natural sciences and Engineering”(7219), the statistical significance of the variable
interaction term was supported across Assets, Employees and Revenue. (Appendices 13 to 16) .
This fact indicates that, on average, companies from this industry benefit more from the grant that
the others, although the computed coefficients depict a small magnitude of effect.
On the other hand, there are relevant industries where opposite results were obtained. When
analyzing the “Engineering activities and related consultancy” (7112) industry it was possible to conclude that the “Grant” does not have a significative additional impact when compared to the
remaining ones. (Appendices 17 to 20). Comparing the two different types of engineering analyzed, in which the variable “Grant” had opposite “statistical significances” might be an insightful
exercise. While the first one, “Other research and experimental development on natural sciences
and Engineering”, is mainly related to laboratorial research in natural science, the second one is
more related to more professional applications of engineering services such as technical
20 that this grant tends to be additionally important in industries with a stronger research component.
Another relevant industry in the Phase 2 recipients’ companies was the “Research and experimental development on biotechnology” (7211) with 8 companies receiving the grant. This industry is
particularly relevant for the analysis, since, along with “Computer Programming Activities”, is part
of one of the industries with a higher amount of private early stage investment in the last years.
Although these two industries are both highly targeted by the private market they display different
behaviors regarding the statistical significance of the grant, which might indicate that there is no
relation between these two variables. By focusing only on this industry it was possible to find
evidence of statistical significance of the Interaction term in the Assets, Revenues and Employees. However, the magnitude of this effect, similarly to what was verified in the “Other research and
experimental development on natural sciences and engineering” is relatively low.(Appendices
21-24)
Although, it might be arguable that the small number of companies from each industry can be
enough to make any inference from this analysis, some conclusions can be stated. Although the
importance of the EU funding can vary across industries and indicators, the investment from the
private market does not seem to influence the importance of the grant in a specific industry. In the
other hand, the research indole of a specific industry can be an explanatory factor of the magnitude
of the impact of the grant in a given industry.
3. The Country Effect
Another aspect that can be highly useful to explain the results obtained in more detail is the country
of origin of each company. In 2014 and 2015, the phase 2 grant was awarded to 140 companies
from 19 different countries. Similarly to what happened in the Industry section, there is a small set
21 and Spain jointly represent 48 (28 from Spain and 20 from Great Britain) of the 140 companies on
the treatment set and there are 6 countries only represented by 1 or 2 companies. Therefore, in
order to adapt the analysis to these features, the following paragraphs will focus on understanding
better the reality in the two specific countries that concentrate such a sizable portion of the
companies that have won the Phase 2 of the SMEI. In order to perform the intended analysis two
interaction variables were created. InteractionSpain = Grant*ESP and InteractionGB = Grant*GB.
GB and ESP were binary variables regarding the country of each company and Grant, the variable
which has been broadly used, that takes the value “1” if the respective company was funded and “0” otherwise.
Having these new variables been settled, the following regressions were performed (maintaining
the control variables:
(13) logAssetst+2 = 𝛽0 + 𝛽1logAssetst-1+ 𝛽2 Grant + 𝛽3 InteractionCountry (14) logRevenuest+2 = 𝛽0 + 𝛽1 logRevenuest-1+ 𝛽2 Grant + 𝛽3 InteractionCountry
(15) logP&Lt+2 = 𝛽0 + 𝛽1logP&Lt-1+ 𝛽2 Grant + 𝛽3 InteractionCountry (16) logEmployees t+2 = 𝛽0 + 𝛽1logEmployees t-1+ 𝛽2 Grant + 𝛽3 InteractionCountry
The correspondent regressions were performed having as the InteractionTerms both
InteractionGB and InteractionESP. On the 8 regressions the Interaction Term only was found
statistically significant in the Variable Assets for Spain, with the Spanish recipients displaying,
on average a 66% better performance than the non-Spanish ones. However, this result indicates
that overall there is no strong evidence of different impacts of the grant across countries.
(Appendices 25 to 32).
22 One aspect that has not been introduced until now is the relative size of the funding in the overall budget of each project. More than interpreting this variable as binary variable with “yes” or “no” it is possible to use it as a continuous variable calculating the percentage of funding with which each project was awarded (EU Contribution/ Project Budget). Firstly, using all the data available, were performed the following regressions:
(17) logAssetst+2 = 𝛽0 + 𝛽1 logAssetst-1+ 𝛽2FudingPercentage
(18) logRevenuest+2 = 𝛽0 + 𝛽1logRevenuest-1+ 𝛽2 FudingPercentage
(19) logP&Lt+2 = 𝛽0 + 𝛽1 logP&Lt-1+ 𝛽2 FudingPercentage
(20) logEmployees t+2 = 𝛽0 + 𝛽1logEmployees t-1+ 𝛽2 FudingPercentage
As it would be expected, no significant differences were found, while comparing the statistical
significance results obtained for each performance variables with the ones obtained in the models
(1-4) of this research. Under the variables “Assets” and “Employees” the variable “funding” that
measures the percentage of co-funding of the European Union on each project was found
statistically significant. (Appendices 33 to 36)
It is worth mentioning that the variable “FundingPercentage” was not found statistically significant
in the variable “Revenues” but it has displayed a p-value of 10.8% which is considerably lower
than when using the “Grant” variable -18,5%. (Appendice 2), which might signalize a higher
explanatory power of this variable when compared to the first one.
5. The Return on “Investment”
During 2014 and 2015, the EU has 224 150 039 euros to the 140 companies under the scope of our
23 EU grants positively influence the performance of the awarded companies, especially in terms of
Assets, Revenues and Employees. In order to measure the impact of each euro invested by the EU,
the following equations were used:
(21) logAssetst+2 = 𝛽0 + logAssetst-1+ 𝛽2FundingBudget
(22) logRevenuest+2 = 𝛽0 + logRevenuest-1+ 𝛽2 FundingBudget
(23) logP&Lt+2 = 𝛽0 + logP&Lt-1+ 𝛽2 FundingBudget
(24) logEmployees t+2 = 𝛽0 + logEmployees t-1+ 𝛽2 FundingBudget
The variable budget represents the total amount in euros that each company received from EU.
This variable was found statistically significant in the Assets, Employees regressions in accordance
with the previous results. (Appendices 37 to 40). However, by interpreting these results, it is
possible to state that, on average, each euro invested from EU, generates 3.31e-07 additional jobs,
3.77e-07 euros of assets. Assuming that the EU has invested 224150039.53 euros, according to the
calculated coefficients, the SMEI in the universe under analysis, has created 74 additional jobs and
84504 euros in companies’ assets.
Critical Analysis of the Results
The strength and the reliability of the conclusions of this research are highly correlated with the
quality of the control group selected. As previously mentioned, the optimal approach would be the
use of Seals of Excellence as the control group of this statistical analysis. Being that impossible,
the control group used, though it has many important features to perform the analysis intended, it
is not as good as the Seals of Excellence would be. Firstly, though the companies selected were all
framed in a range of relevant financial indicators and in specific industries, it was not possible to
completely capture the indole of their business activity. Meaning, the Phase 2 recipients are, by
definition, companies with an innovative project, and it was not possible to take that considerably
24 sector of activity as specific as possible, with a four digits code being used. Moreover, there is a
clear trade-off between the imposition of binding conditions in the Industry and Country and the
resemblance of the Financial indicators of the Control Group with the Treatment Group. As the set
of companies in which the minimization function is applied becomes narrower with the exact
matching conditions, the more difficult is to find a control group with similar financial parameters
before the receipt of the grant. This question represents a major improvement opportunity and it is
a topic that further research should examine carefully.
Another important question has to do with the growth stage of each company. Although this
problem was mitigated with the introduction of the age of each company and the growth rate of the
previous year to the grant receipt in the construction of the control group, it is plausible to believe
that Phase 2 companies tend to have much more growth potential than its comparable. This
discrepancy, potentiated by the EU grant, can explain the high magnitude of some coefficients
found in this study. Another important limitation worth reinforcing is the reduced period of time
since the receiving of the grant until now. As previously explained, this potential problem was
mitigated by choosing only companies which were funded in 2014 and 2015, assuming that the 4
or 5 years since the receiving of the grants would be enough to better extract its impact in the
company. However, it is legitim to believe that more reliable results will arise from a later analysis of these companies’ performance. Last but not least, the decision of extracting from the phase 2
recipients the projects from larger enterprises might have led to an incomplete assessment of the
program.
Concluding, furtherer analyses may be performed on the same topic, and significant improvements are likely to be reached with full access to the Seals of Excellence’ recipients and with a wider time
25 A New Horizon - The Accelerator
This research is being made in a very particular moment of the European context. With the
upcoming terminus of the Horizon 2020 Program, the former European Commission, in particular
the Portuguese commissioner Carlos Moedas, has spent the last months of his tenant preparing the
transitions for the Horizon Europe under which the SMEI will also be rebranded and redesigned
with several changes to be implemented. The EU created the European Innovation Council, which
will take the place of the European Agency for Small and Medium Enterprises in the management
of these of funds. The Accelerator will constitute the key source of funding for the innovative and disruptive SME’s of the EU. More than the changes in the name, this new framework will bring a
new mindset. The EU will be able to use blended finance mechanisms in which, in addition to the
grant that will still range from 0.5 million to 2.5 million euros, there will be the possibility of the
EU to become partially owner of the company, by making an equity investment that can amount
up to 15 million euros. This blended finance mechanism represents a complete revolution in the
EU mindset, but there are still various aspects to be defined and the pilot in progress will be a very
26
References
Howell, Sabrina. 2016. “Financing Innovation: Evidence from R&D Grants “.Available at SSRN: https://ssrn.com/abstract=2687457 or http://dx.doi.org/10.2139/ssrn.2687457
Bronzini, Raffaello, and Eleonora Iachini. 2014. "Are Incentives for R&D Effective? Evidence from a Regression Discontinuity Approach." American Economic Journal: Economic Policy 6, no. 4 (2014): 100-34. www.jstor.org/stable/43189406.
Eurostat. 2019. “R&D Expenditure”. Accessed November 13.
https://ec.europa.eu/eurostat/statistics-explained/index.php/R_%26_D_expenditure
Welcomeurope. 2018. FP7 - Capacities - 2 Research for the Benefit of SMES. Accessed November 10. https://www.welcomeurope.com/european-funds/fp7-capacities-2-research-benefit-of-smes-626+526.html#tab=onglet_details
European Commission. 2019. “EIC pilot (Funding)”. Accessed November 10. https://ec.europa.eu/research/eic/index.cfm?pg=funding
European Commission. 2019. “EIC Accelerator (SME Instrument)”. Accessed November 10 https://ec.europa.eu/easme/en/eic-accelerator-sme-instrument
Elk, Koos van, Jacqueline Snijders, Yvonne M. Prince, Petra Gibcus, Sophie Doove, Paul Simmonds, Katharina Warta, Barbara Good, Sascha Ruhland and Sonja Sheikh. 2014. “Performance of SMEs within FP7. An Interim Evaluation of FP7 components.”
European Commission. 2018. HORIZON 2020 SMEI Instrument Impact Report. https://ec.europa.eu/easme/sites/easme-site/files/smei_2018_impact_report_final_may_2018.pdf GAEU Consulting. 2018. Seal of Excellence – a consolation prize or a real deal?. Accessed November 18. https://gaeu.com/artiklar/seal-of-excellence-a-consolation-prize-or-a-real-deal/ Eurostat. 2008. NACE Rev.2 Statistical classification of economic activities in the European Community https://ec.europa.eu/eurostat/documents/3859598/5902521/KS-RA-07-015-EN.PDF Statista. 2019. “Value of Early-Stage venture funding in Europe by Industry”. Retrieved from Statista database. https://www.statista.com/
SmallBizDaily. 2019. “5 Industries That Venture Capitalists Are Investing In”. Accessed November 18. https://www.smallbizdaily.com/5-industries-that-venture-capitalists-are-investing-in/#
European Commission. 2019. “ What is an SME?”. Accessed November 18. https://ec.europa.eu/growth/smes/business-friendly-environment/sme-definition_en
27
Appendices
Appendix 1.
28 Appendix 3.
29 Appendix 5.
30 Appendix 7.
31 Appendix 9.
32 Appendix 11.
33 Appendix 13.
34 Appendix 15.
35 Appendix 17.
36 Appendix 19.
37 Appendix 21.
38 Appendix 23.
39 Appendix 25.
40 Appendix 27.
41 Appendix 29.
42 Appendix 31.
43 Appendix 33.
44 Appendix 35.
45 Appendix 37.
46 Appendix 39.
47 Appendix 41.
48 Appendix 43.