Development of Multifunctional Composites
-Analysis and Correlation of Performance Properties
Jo˜
ao Korrodi de Azevedo Gomes Sottomayor
Supervisors:
Prof. Dr. Ant´onio Torres Marques Dr. Eng. Nuno M. P. Rocha
LY556 epoxy thermoset has been investigated as a carbon nanotube-loaded matrix for unidi-rectional prepreg carbon fiber-reinforced composite (Torayca IMS60). First the effect of the
nanofiller, from 0.25 to 1.5wt.%, in the epoxy was assessed. Dynamic mechanical analysis
(DMA) were performed to assess the flexural storage modulus, the glass-transition temperature Tg and loss coefficient tan δ as function of the nanotube content and type of functionalization, namely, pristine, carboxylic and thermally oxidized nanotubes.
DMA tests showed modulus enhancement for all nanotube functionalizations (up to 18% increase), although at distinct nanotube contents. The action of two dispersion agents was also studied, although with modulus deterioration.
Throughout the thesis, scanning electron microscopy (SEM) and transmission electron mi-croscopy (TEM) have been used to analyze the different nanocomposites tested and to evaluate the nanotube agglomeration and dispersion within the epoxy matrix down to the nano scale.
In addition, an experimental procedure was implemented to assess the effect on the nanotube orientation of an physical alignment method applied during the curing process and dynamic me-chanical tests revealed a substantial 14% increase in modulus. SEM imaging confirmed the existence of an alignment.
Finally, four analytical property prediction models were tested, revealing that the simple rule-of-mixtures cannot not be accurately correlated with the experimental data. On the other hand, two other models that have in consideration characteristics of nanotubes, presented better prediction capabilities.
A utiliza¸c˜ao de resina epoxy LY556 carregada com nanotubos de carbono foi investigada no sen-tido de a utilizar como matriz para pr´e impregnados unidirecionais de fibra de carbono (Torayca IMS60). Primeiro, o efeito da adi¸c˜ao de nanotubos na matriz, entre 0.25 e 1.5wt.%, foi estudado.
Testes de Dynamic Mechanical Analysis (DMA) foram efetuados por forma a obter o m´odulo de
armazenamento `a flex˜ao, a temperatura de transi¸c˜ao v´ıtrea Tg e o coeficiente de perdas tan δ, como fun¸c˜ao do conte´udo de nanotubos e tipo de funcionaliza¸c˜ao, nomeadamente, n˜ao tratados, carboxylic e oxidados termicamente.
Os testes de DMA revelaram um aumento do m´odulo (at´e 18%) para todos as
funcional-iza¸c˜oes, embora para conte´udos distintos. O efeito da adi¸c˜ao de dois agentes dispersantes foi tamb´em estudado, embora com deteriora¸c˜ao do m´odulo.
Ao longo da disserta¸c˜ao, imagens obtidas por microscopia eletr´onica (SEM e TEM) foram utilizadas para analisar, `a escala nanom´etrica, os diferentes nano comp´ositos testados e para avaliar os aglomerados e a dispers˜ao dos nanotubos na matiz.
Seguidamente foi estudado um processo f´ısico experimental de alinhamento dos nanotubos de carbono na matriz, durante o processo de cura. Testes DMA revelaram um aumento substancial
de 14% no m´odulo. Imagens SEM confirmaram o alinhamento.
Finalmente, quatro m´etodos anal´ıticos de previs˜ao de propriedades foram implementados. Correlacionando com os valores experimentais, a duas regras das misturas implementadas ex-ibiram previs˜oes groseiras, enquanto que os outros dois m´etodos, que tˆem em considera¸c˜ao a
natureza dos nanotubos, apresentaram melhores capacidades de previs˜ao.
The author acknowledges partial funding from EC-FP7 project EUCARBON (GA284500) and project NORTE-07-024 FEDER-000033 - Composite Materials, Structures and Processes, within the Portuguese National Strategic Reference Framework (QREN), through the European Re-gional Development Fund (ERDF).
Firstly, I wish to express my gratitude to Prof. Dr. Ant´onio Torres Marques and Dr. Eng. Nuno M. P. Rocha, supervisors of this thesis, for all the support and availability during the development of this thesis, even at the most occupied times.
To my INEGI lab group, Susana Silva, Marta Martins, Joana Prudˆencio, Ana Moreira and
Marina Torres, I thank for all the support and for all the valuable feedbacks and discussions. To all my friends, in particular to Carolina Furtado, Pedro Cavaleiro and Rodrigo Furtado, a special thanks for the friendship and support throughout all this years.
To my girlfriend, Cristina Aguiar Pinto, that was always supportive and pushing me forward. Lastly, a very special thanks to my parents, Francisco and Teresa, to my brother, Francisco, and to all my family for all the support and always being there for me.
This thesis is included within the scope of EUCARBON project, coordinated by INEGI, and is focused on the evaluation of how carbon fiber reinforced composites are affected by the inclusion of carbon nanotubes in the polymeric matrix, from the resin, prepreg and cured composites levels. The EUCARBON project aims to overcome the present recognized needs of European made space qualified carbon fiber and pre-impregnated materials. These materials are building blocks for technological innovation in space research. Presently, aerospace qualified carbon fiber is either produced outside Europe or produced in Europe under foreign countries supervision by only one source. This issue weakens European competitiveness in space, mainly related to the increased delivery lead times and costs. Therefore, the possibility for Europe to have free, unrestricted access to these materials requires their development in European facilities under European supervision. The following developments will result from the project:
• High and ultrahigh modulus carbon fibers to be produced in Europe by a European man-ufacturer;
• Space qualified pre-impregnated materials involving the developed carbon fibers and epoxy resins doped with carbon nanotubes. These novel materials will address one of the main issues linked to use of carbon fiber composites in space applications: their low thermal and electrical conductivity.
The main objective of this master’s thesis is to study the effect on mechanical and thermal properties of adding carbon nanotubes to epoxy resin, with the target of developing novel carbon fiber reinforced composites.
The above technologies will be demonstrated with the conception, production and testing of demonstrator parts for use as satellites and launchers components. EUCARBON will also pro-vide raw-materials for other strategic sectors of industry in Europe, such as aircraft, automotive and others.
Abstract i
Sum´ario iii
Acknowledgments v Background vii 1 Introduction 1 1.1 Motivation . . . 1 1.2 Thesis Overview . . . 2 2 State-of-Art 3 2.1 Carbon Nanotubes . . . 3 2.1.1 Chirality . . . 4
2.1.2 Synthesis of Carbon Nanotubes . . . 5
2.1.2.1 Electric Arc Discharge . . . 6
2.1.2.2 Laser Vaporization . . . 6
2.1.2.3 Chemical Vapor Deposition . . . 7
2.2 Epoxy Resin . . . 7
2.3 Carbon Nanotube Reinforced Polymer . . . 8
2.3.1 Proper Selection of the Polymer Matrix . . . 8
2.3.2 Dispersion . . . 9 2.3.2.1 Ultrasonication . . . 12 2.3.2.2 Ball Milling . . . 13 2.3.2.3 Calendering . . . 13 2.3.2.4 Mechanical Stirring . . . 13 2.3.2.5 Functionalization . . . 14 2.3.3 Load Transfer . . . 16 2.3.4 Geometry Defects . . . 16 2.3.5 Alignment . . . 17 2.3.6 Purity . . . 19
2.4 Carbon Fiber Reinforced Plastic . . . 19
2.5 Thermogravimetric Analysis . . . 21
2.6 Dynamic Mechanical Analysis . . . 22
3 Experimental Work 25 3.1 Epoxy Nanocomposite . . . 25
3.1.1 Porosity . . . 26
3.1.2 Experimental Procedure . . . 28 ix
3.1.2.1 Dynamic Mechanical Tests . . . 28
3.1.3 Results and Discussion . . . 29
3.1.3.1 Dispersion Agents . . . 36
3.2 Carbon Fiber/Carbon Nanotube Nanocomposite . . . 38
3.2.1 Carbon Fiber Prepreg . . . 38
3.2.2 Experimental Procedure . . . 39
3.2.2.1 Sample Preparation . . . 39
3.2.2.2 Dynamic Mechanical Tests . . . 40
3.2.2.3 Thermogravimetric Analysis . . . 41
3.2.2.4 Physical Alignment Method . . . 41
3.2.3 Results and Discussion . . . 41
3.2.3.1 Thermogravimetric Analysis . . . 41
3.2.3.2 Dynamic Mechanical Analysis . . . 43
4 Prediction of the Mechanical Properties of Nanocomposites 47 4.1 Analytical Models . . . 48
4.1.1 Micromechanical Models . . . 49
4.1.1.1 Rule of Mixtures . . . 49
4.1.1.2 Modified Rule-of-Mixtures . . . 50
4.1.1.3 Effective Interface Model . . . 52
4.1.1.4 Modified Halpin-Tsai Model . . . 54
4.2 Multiscale Modeling . . . 60
4.2.1 Molecular Structural Mechanics . . . 61
4.2.2 Equivalent-Continuum Approach . . . 64
4.3 Model Correlation . . . 65
5 Conclusions 69 5.1 Future Work . . . 71
Appendix A Other Relevant Curves 81
2.1 Dimension and corresponding number of particles in composites for different fillers . . . 10
2.2 Comparison of various physical techniques for CNT dispersion in polymer
com-posites . . . 12
2.3 Comparison of various physical techniques for CNT dispersion in polymer
com-posites . . . 14 3.1 Infromation of the constituents used for the resin. For more detailed information,
see Appendix B . . . 26 3.2 Properties of the carbon fibers used . For more detailed information, see Appendix B 38
3.3 Parameters used in the thermogravimetric analysis. . . 41
4.1 Lorentz parameters . . . 56
2.1 (a) Schematic representation of a Single-Walled Carbon Nanotube , (b) a
Multi-Walled Carbon Nanotube and (c) a Fullerene C60 . . . 3
2.2 Single-walled carbon nanotube with the end closed with a C60 Fullerene . . . 4
2.3 Density of carbon nanotube against diameter, for various values of number of walls . 4 2.4 (a) and (b): when n = m (θ = 00) the nanotube is called “armchair” type; when m = 0 (θ = 300) it is called the “zigzag” type; when n 6= m (θ between 00 and 300) it is a “chiral” tube . . . 5
2.5 Schematic representation of the Electric Arc Discharge method . . . 6
2.6 Schematic representation of the Laser Vaporization method . . . 6
2.7 Schematic representation of the Chemical Vapor Deposition method . . . 7
2.8 Crosslink schematic representation . . . 7
2.9 The evolution of the reinforcement of carbon nanotubes in epoxy composites with different matrix stiffness . . . 9
2.10 Scale difference between cabon nanotubes and carbon fibers . . . 10
2.11 Simulation of the distribution of various fillers in 1 mm3 with a constant filler volume fraction of 0.1% in volume. A: Al2O3 particle; B: Carbon Fiber; C: Graphite Nanopowder (GNP); D: Carbon nanotubes (CNT) . . . 11
2.12 (a) Viscosity as a function of the carbon nanotubes content, at a shear rate of 1s−1, and (b) visible high viscosity of a 0.75wt.% carbon nanotube filled epoxy. . 11
2.13 SEM image of entangled MWCNT agglomerates . . . 12
2.14 Schematic ball milling . . . 13
2.15 Schematic calendering process . . . 13
2.16 Stirrer used in the mixing process. . . 13
2.17 Chemical, or covalent, functionalization: (a) Sidewall and (b) Defect function-alization. Physical, or non-covalent, functionalization: (c) ”Wrapping” and (d) Endohedral functionalization . . . 15
2.18 Stress–position profiles when fiber length l is greater than the critical length, for a fiber reinforced composite that is subjected to a tensile stress equal to the fiber tensile strength σ∗f . . . 16
2.19 (a) The left panel gives the ideal tube structure, the middle and right panels show the effects of uniform bend and twist on the structure . (b) TEM image of a bent nanotube on the left and the restored shape on the right, showing the elastic nature of the deformation . . . 17
2.20 Aligned carbon naotubes between elecrodes . . . 17
2.21 Optical micrographs of 0.3 wt.%CNT/epoxy showing MWCNT networks in com-posites cured after (a) 5 min and (b) 15 min of the application of the electric field . . . 18
2.22 (A) Representative illustration of applying a magnetic field by a simple magnet, (B) uniform, unidirectional and non-turbulent movement of magnetical particles toward the magnet and (C) alignment of nanotubes along the flow lines by drag
force caused from magnetical particles movement . . . 18
2.23 (a) Stress vs. strain curves of MWCNT/epoxy composites and (b) TEM images of aligned MWCNTs–epoxy composites . . . 19
2.24 Schematic representation of a fibrous composite . . . 19
2.25 Schematic representation of a laiminate stack . . . 20
2.26 TA Instruments SDT Q600 . . . 21
2.27 Example of TGA curve, for a soda ash sample . . . 21
2.28 TA Instruments DMA Q800 . . . 22
2.29 (a) Creep test - Constant stress is applied while deformation is measured against time. After a certain time, the stress is removed and the recovery is measured. (b) Stress relaxation test - Constant deformation is applied while the decreasing of the stress against time is recorded . . . 22
2.30 (a) Elastic response of a ball that is dropped. (b) δ = 0o for purely elastic materials. δ = 90o for purely viscous materials. Polymers exhibit an intermediate phase difference. (c) From the complex modulus E* and δ, the storage modulus E0 and the loss modulus E00 can be computed. . . 23
2.31 Example of DMA curves for (a) neat epoxy resin and (b) carbon fiber reinforced epoxy. . . 23
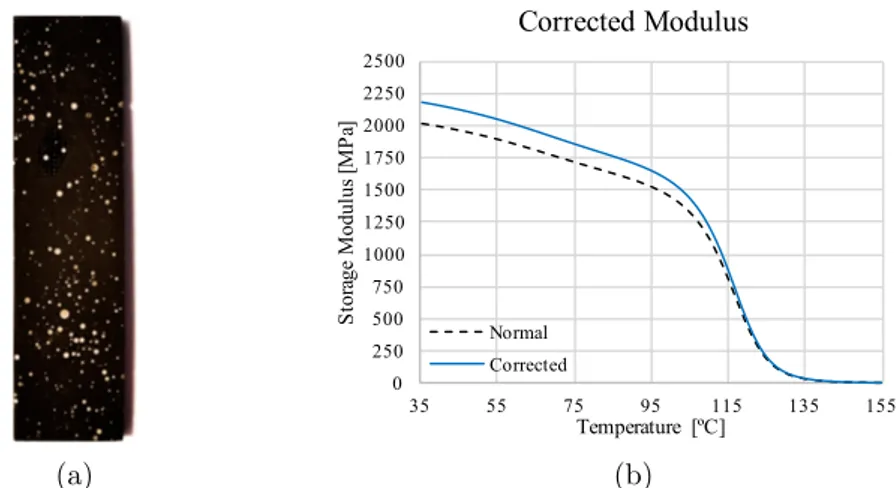
3.1 Schematic representation of the experimental epoxy nanocomposite samples used. 26 3.2 (a) High contrast image of a discarded epoxy/carbon nanotube sample. Superfi-cial porosities are filled with white epoxy powder, resulted from the sandpapering process. (b) Corrected modulus of a 0.5wt.% pristine carbon nanotube epoxy composite. . . 27
3.3 (a) The presence of this voids of air is aggravated by the increasing content of pristine carbon nanotubes and (b) note the spheroidal voids visible in SEM image of the fracture surface of an epoxy sample with 1.5wt.% pristine nanotubes. . . . 27
3.4 (a) Mechanical stir machine, (b) stirrer blade, (c) mold with nano loaded resin, (d) samples cutting process the samples at INEGI Porto and (e) three samples. . 28
3.5 Single cantilever mode used in the DMA machine. . . 28
3.6 Storage modulus against temperature, for 0.25wt.% of each carbon nanotube functionalization. . . 29
3.7 Loss coefficient tan δ against temperature, for 0.25wt.% of each carbon nanotube functionalization. . . 29
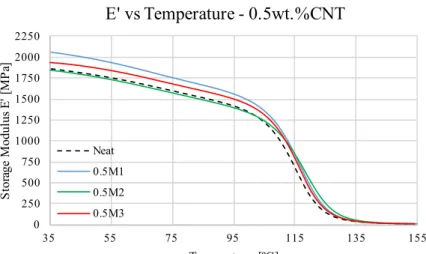
3.8 Storage modulus against temperature, for 0.5wt.% of each carbon nanotube func-tionalization. . . 30
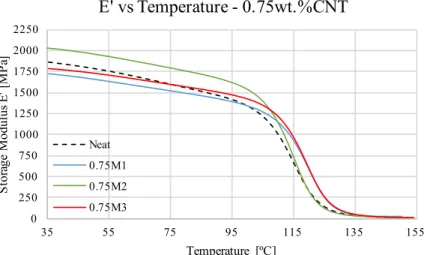
3.9 Loss coefficient tan δ against temperature, for 0.5wt.% of each carbon nanotube functionalization. It is possible to see the glass-transition temperature Tg shift. 30 3.10 Storage modulus against temperature, for 0.75wt.% of each nanotube functional-ization. . . 31
3.11 Loss coefficient tan δ against temperature, for 0.75wt.% of each carbon nanotube functionalization, showingthe glass-transition temperature Tg shifts for the vari-ous CNT functionalizations. . . 31
3.12 Tensile modulus of CNTs/epoxy composites with respect to CNTs loading . . . . 32
3.13 Storage modulus E’ at 35oC, for the various contents and functionalizations. In-terrupted line is the neat epoxy modulus. . . 32
3.15 Storage modulus against viscosity. . . 33 3.16 Storage modulus E’, with the respective scatter, for the various contents and
functionalizations: (a) M1 Pristine (b) M2 Carboxylic and (c) M3 Thermally Oxidized carbon nanotubes. . . 34 3.17 Glass-transition temperature (Tg) for the various contents and functionalizations. 34 3.18 Glass-transition temperature (Tg) for the various contents of pristine M1 carbon
nanotubes. . . 35 3.19 Glass-transition temperature (Tg) for the various contents of (a) carboxylic M2
and (b) thermally oxidized M3 carbon nanotubes. . . 35 3.20 SEM images of 0.75% of: (a) pristine nantubes at 5000× magnification, (b) of
0.75% carboxylic nantoubes 20000× and (c) thermally oxidized at 20000× . . . . 35
3.21 (a) Storage modulus E’ against temperature and (b) storage modulus at 35oC,
for the neat epoxy resin and the epoxy with 0.5% of each dispersion agent. . . . 36
3.22 (a) Loss coefficient tan δ against temperature and (b) glass-transition
tempera-ture, for the neat epoxy resin and the epoxy with 0.5% of each dispersion agent. 36
3.23 (a) Modulus E’ against temperature and (b) storage modulus at 35oC, for the
epoxy with 0.5% pristine carbon nanotubes (M1) and the same nanoreinforced resin with 0.5% of each dispersion agent. . . 37 3.24 (a) Loss coefficient tan δ against temperature and (b) Tg, for the epoxy with 0.5%
pristine carbon nanotubes (M1) and the same nanoreinforced resin with 0.5% of each dispersion agent. . . 37 3.25 (a) Prepreging machine and (b) example of a IMS60 prepreg sheet used for the
samples. . . 38 3.26 SEM image of a three layered [0o, 90o, 0o] lay-up carbon fiber/epoxy composite,
not used in this thesis. . . 39 3.27 Preparation sequence of the hybrid composite samples: (a) cutting the squares
from the prepreg sheet, (b) 60 by 60 millimeters with the respective reference name, (c) applying the blue transparent film, which prevents the sample from sticking and retains the excess resin, to the prepreg lay-up, (d) insert the samples, within Teflon protecting sheets, into the hot plate press (120oC for 2 hours) and (e) and (f) the final cured samples. . . 40 3.28 Thermogravimetric analysis for three types of carbon fibers, including the IM60
carbon fiber used, and for the LY556 epoxy resin. . . 42 3.29 Zoomed in TGA of the carbon fibers. The 1 to 2% mass loss is caused by the
degradation of the fiber sizing. . . 42 3.30 Experimental results of neat system compared to rule-of-mixture estimation of
the modulus. . . 43
3.31 Results of tan δ and storage modulus for IMS60 composite specimens. It is
noteworthy the consistent inverse relationship between the modulus and the tan δ values. . . 43 3.32 Predictions of the tan δ for 60% volume fiber for: (a) Neat systems, systems with
(b) 0.5wt.% pristine nanotubes (M1), (c) 0.5wt.% carboxylic nanotubes (M2) and (c) 0.5wt.% thermally oxidized nanotubes (M3). . . 44 3.33 The effect of the nanotube functionalization on the glass-transition temperature
Tg. . . 45 3.34 Storage modulus comparison between a sample of carbon fiber reinforced epoxy
with 0.5wt.% pristine carbon nanotubes and the same material subjected to a physical alignment process. . . 45
3.35 SEM imagens from CEMUP, University of Porto, of the sample, reveal the effect of the method used: (a) 20000x magnification image where several white nanoscale filaments have a clear orientation from the bottom left to the top right, and (b) 37500x revealed a two dimensional perpendicular orientation between nanotubes, similar to a football goal net. . . 46 3.36 Further magnification at 100000x of figure 3.35b, revealing a two dimensional
perpendicular orientation between nanotubes, similar to a football goal net. . . . 46
4.1 Various Modeling and simulation techniques for polymer nanocomposites . . . 47
4.2 Waviness parameter . . . 51
4.3 Comparison between the presented model and other typically used models . . . . 52
4.4 (a) Prediction of the Young’s modulus of MWCNT/epoxy E120–H100 composites
for various values of the waviness parameters and (b) SEM image of fracture surface for 5.0 wt.% nanotube epoxy composite . . . 52
4.5 Schematic illustration of effective interface micromechanics model . . . 53
4.6 Schematic of (a) outer layer of the multiwalled nanotube and (b) effective fibre
used to model the elastic properties of a nanotube embedded in a composite . . 55
4.7 (a) Histogram of the diameter distribution of carbon nanotubes, and (b) the non
linear fit to a Lorentz distribution . . . 57
4.8 SEM micrograph of multi-walled carbon nanotubes (a) without any
function-alization and (b) with COOH functionfunction-alization, with measurements of outside diameter indicated. . . 57
4.9 (a) TEM micrograph of a multi-walled carbon nanotube with measurements of
outside diameter, inside diameter and wall thickness indicated and (b) linear relationship between wall thickness and nanotube diameter . . . 58 4.10 (a) Variation in calculated nanotube density with the outside diameter and (b)
Histogram showing the distribution of nanotube density . . . 59 4.11 Illustration of the equivalence between a dispersed composite and N composites
each with a specific nanotube diameter and partial volume acting in parallel . . 60
4.12 Representative volume elements for molecular, structural and continuum models . 61
4.13 (a) Example of a truss stucture and (b) a reoresentation os a fullerene . . . 61
4.14 Bond structures and corresponding energy terms of a graphene cell . . . 62
4.15 (a) Normalized van der Waals force versus normalized atomic distance , and (b) load-displacement curve of the non-linear truss rod. . . 63 4.16 Equivalent-continuum modeling of non-functionalized . . . 64 4.17 Young’s moduli of both composite systems against nanotube length for a constant
1% nanotube volume fraction, and (b) Longitudinal Young’s moduli of both com-posite systems against nanotube volume fraction for a constant nanotube length of 400 nm . . . 65 4.18 Storage modulus E’, with the respective scatter, for the various contents and
functionalizations: (a) Untreated (M1), (b) carboxylic (M2) and (c) thermally oxidized (M3) carbon nanotubes. . . 65 4.19 Correlation of two sorts of the rule-of-mixtures with experimental data, presented
in section 4.1.1.1. . . 66 4.20 Correlation of the modified rule-of-mixtures developed by Omidi et al. , presented
in section 4.1.1.2, with experimental data from the pristine carbon nanotubes. . . 66
4.21 SEM image from the 1.5wt.% pristine carbon nanotubes. . . 67
4.22 Correlation of the Modified Halpin-Tsai model, presented in section 4.1.1.4, with experimental data, for various legth values. . . 67
A.1 Storage modulus against temperature, for various contents of Pristine carbon nanotubes. . . 81
A.2 Tan δ against temperature, for various contents of Pristine carbon nanotubes. . . 81
A.3 Storage modulus against temperature, for various contents of carboxylic function-alized carbon nanotubes. . . 82 A.4 Tan δ against temperature, for various contents of carboxylic functionalized
nan-otubes. . . 82 A.5 Storage modulus against temperature, for various contents of thermally oxidized
functionalized carbon nanotubes. . . 82 A.6 Tan δ against temperature, for various contents of thermally oxidized
Introduction
1.1
Motivation
With a launch cost from 3000 to more than 10000 euros per Kg [1], weight reduction is the primary reason for using fiber-reinforced composites in space vehicles. In addition, the unique combination of mechanical properties and thermal stability is leading to an increasing number of applications for carbon fiber-reinforced epoxies in artificial satellites.
In the last couple of decades, material scientists and engineers have focused a huge re-search activity on carbon nanotube based nanocomposites. This attention is justified by the extraordinary mechanical and functional properties shown by this carbon nanofillers. This form of carbon nanostructure, in paper, represents an ideal candidate as an advanced filler material not only in a neat hosting system, but also in advanced matrices in traditional fiber reinforced composites, which can lead to the potential development of a new generation of multifunctional composite materials with exceptional mechanical, thermal and electrical properties.
Several studies have sought to verify the reinforcement effect of carbon nanotubes on the mechanical properties of polymer matrices [2–5]. Generally, these studies found that the elas-tic modules of the carbon nanotube polymer composites improved by adding only few weight percentages of this nanofiller. Although conflicting results about improvement in strength or fracture toughness have been reported, a common tendency is for the enhancements on Young’s modulus.
The main objective of this master’s thesis is to study the effect on mechanical and thermal properties of adding multi-walled carbon nanotubes, with specific functionalizations, into epoxy thermoset resin, with the target of using it as a matrix in carbon fiber reinforced composites.
1.2
Thesis Overview
• Chapter 2 begins with the study of carbon nanotubes, from the atomic structure to the synthesis processes, followed by a brief presentation of the epoxy resin. Then, carbon nan-otube reinforced polymer composites are exploited, and the reasons why this composites do not fully use the exceptional properties of the carbon nanotubes are presented and thoroughly explained in the following subsections.
• In chapter 3, LY556 epoxy thermoset was investigated as a carbon nanotube-loaded matrix for fiber-reinforced composite. First the effect of the nanofiller in the epoxy was assessed. In this work, dynamic mechanical analysis were performed to assess the flexural storage and loss modulus, the glass-transition temperature Tg and loss coefficient tan δ as a func-tion of the nanotube content and type of funcfunc-tionalizafunc-tion. In addifunc-tion, the acfunc-tion of two dispersion agents in the loaded epoxy and the application of a physical alignment method during cure of the nanotube loaded prepreg were also explored.
• Chapter 4 presents several approaches, form the simple rule-of-mixtures to more complex multiscale models, developed to predict mechanical properties of nanocomposites. After-wards, some of the models are applied and their prediction capabilities are tested.
• In chapter 5, concluding remarks of the work and study performed are drawn and some ideas of future work are presented.
State-of-Art
2.1
Carbon Nanotubes
Carbon nanotubes (CNTs) are graphene sheets wrapped into a hollow cylinder, made of sp2
covalent bonded carbon atoms - stronger than the sp3 bonds found in diamond - organized in
a hexagonal mesh [6, 7]. The first Transmission Electron Microscopy (TEM) evidence for the tubular nature of some nano-sized carbon filaments is believed to have appeared in 1952 in the Journal of Physical Chemistry of Russia [8], but was only in 1991, with Iijima et al.’s paper in Nature magazine [9], that it had an international projection and boosted the development [10].
CNTs exist in two different basic forms: Single-Walled Carbon Nanotubes (SWCNTs), which are the fundamental cylindrical structures (fig.2.1a), and Multi-Walled Carbon Nanotubes (MWCNTs), which can have two or more coaxially van der Waals bonded SWCNTs, separated by a fraction of a nanometer (0.34 nm) (fig.2.1b).
(a) (b) (c)
Figure 2.1: (a) Schematic representation of a Single-Walled Carbon Nanotube [11], (b) a Multi-Walled
Carbon Nanotube [12] and (c) a Fullerene C60 [13].
Carbon nanotubes are only a few nanometers in diameter and can be tens of microns long. Usually, on each extremity they are closed with half of a fullerene molecule (fig.2.1c and 2.2), which consist of a spherical structure made of carbon atoms displaced in hexagons and pentagons.
Figure 2.2: Single-walled carbon nanotube with the end closed with a C60Fullerene [14].
Carbon nanotubes possess extraordinary mechanical, thermal and electric properties. Stiffness was first determined by observing the amplitude of thermal vibrations in transmission electron microscopy (TEM) and the average value was reported to be 1.8 TPa for multi-walled and 1.25 TPa for the single-walled ones [15, 16]. Experimental results of tensile tests operated inside a scanning electron microscope (SEM), showed that the strength of the outer shell of the MWCNT was between 11 and 63 GPa at fracture strains up to 12% and the elastic modulus ranged from 270 to 950 GPa [15].
The density of carbon nanotubes depends on the diameter and on the number of walls.
Laurent et al. [17] developed an equation to
determine the density of the carbon nanotube as a function of its diameter and number of walls.
dM W = 4000 1315 n dout − 0.34 n−1 P i=0 i d2 out (2.1)
where dM W is the multi-walled carbon nanotube density, n is the number of walls and dout, is the outer diameter, in nm, of the nanotube. The equation is graphically represented in the figure 2.3. 0.0 0.5 1.0 1.5 2.0 2.5 3.0 3.5 4.0 4.5 5 walls 1 wall graphite 10 walls 20 walls 2 walls Densi ty 0.0 0.5 1.0 1.5 2.0 2.5 3.0 3.5 4.0 4.5 0 5 10 15 20 25 30 Outer diameter (nm) 5 walls 1 wall graphite 10 walls 20 walls 2 walls
Figure 2.3: Density of carbon nanotube against diameter, for various values of number of walls [17].
2.1.1 Chirality
Single-walled carbon nanotubes can be fully described, with the exception of their length, by a single vector ~C, called chiral vector. Two atoms in a planar graphene sheet are chosen and one is used as origin. The ~C is pointed from the first atom toward the second one (fig. 2.4a) and is defined by the following equation:
~
C = n ~a1+ m ~a2 (2.2)
where n and m are integers, and ~a1 and ~a1 are unit cell vectors of the two-dimensional lattice formed by the graphene sheets. The direction of the nanotube axis is perpendicular to this chiral vector.
The chiral angle θ is defined as the angle between chiral vector ~C and the ”zigzag” axis.
θ = tan−1 m √ 3 m + 2n ! (2.3)
Three types of CNTs are revealed with these values:
1. when n = m (θ = 00), the nanotube is called “armchair” type; 2. when m = 0 (θ = 300), it is called the “zigzag” type;
3. when n 6= m, so θ is between 00 and 300, it is a “chiral” tube.
(a) (b)
Figure 2.4: (a) and (b): when n = m (θ = 00) the nanotube is called “armchair” type; when m = 0
(θ = 300) it is called the “zigzag” type; when n 6= m (θ between 00 and 300) it is a “chiral” tube [18, 7].
The values of (n, m) determine the ”chirality” of the nanotube and it affects the mechani-cal, electronic and optical properties. Nanotubes with |n − m| = 3q are metallic and those with |n − m| = 3q ± 1 are semiconducting, with q as an integer).
For multi-walled, there are only a few possible (n, m) sequences that have a plausible intershell spacing (d) between two successive tubes, in the range from 0.344 nm to 0.36 nm. These values suggest a possible dependence of intershell distance on the tube size and some authors gives an empirical relationship to fit TEM experimental data:
d = 0.334 + 0.1e−r (2.4)
where r is the radius of the tube. As a consequence of the tube diameter increase, the intershell distance decreases to 0.344 nm [19].
The analysis in this dissertation will be mainly focused in the MWCNTs, which theoreti-cally exhibit a relatively high elastic modulus and are moderately priced, therefore, have a high potential of being used in reinforcing composites on a commercial scale.
2.1.2 Synthesis of Carbon Nanotubes
There are many techniques used to produce SWCNTs or MWCNTs. Methods such as electric arc discharge, laser vaporization and chemical vapor deposition techniques are well established to produce a wide variety of CNTs and currently widespread at an industrial scale, e.g. Arkema, Nanocyl and Future Carbon. These methods are described in following sections.
2.1.2.1 Electric Arc Discharge
The electric arc discharge method, initially used for the production of the C60fullerene, already mentioned in section 2.1, is perhaps the most common and easiest way to produce carbon nanotubes (CNTs). This method consist in striking an electric arc between graphite electrodes in an inert gas atmosphere, typically argon or helium, at controlled pressure, to generate the high temperatures, around 3000oC, needed to vaporize carbon atoms into a plasma (fig.2.5) [20, 6]. A disadvantage is the production of graphitic impurities such as carbon soot with amorphous carbon and fullerens.
Figure 2.5: Schematic representation of the Electric Arc Discharge method [21].
2.1.2.2 Laser Vaporization
Laser vaporization, also known as laser ablation, uses an intense laser pulse to vaporize a carbon target. This carbon target, which also contains small amounts of transition metals, such as nickel and cobalt, playing the role of catalysts, is placed in a tube furnace at 1200oC. As the target is ablated, inert gas passes through the chamber carrying the grown nanotubes on a cold finger for collection (fig.2.6). This method mainly produces bundles of Single-Walled carbon nanotubes in the form of ropes [6]. However, MWCNTs were found when a pure graphite target was used.
2.1.2.3 Chemical Vapor Deposition
In chemical vapor deposition (CVD) a hydrocarbon vapor passes at atmospheric pressure through a tubular reactor in which a catalyst material is present. This catalyst, together with tempera-tures from 600 to 1200oC, acts as a substrate and decompose the hydrocarbon, forming CNTs on its surface. The nanotubes are collected upon cooling the reactor to room temperature (fig.2.7).
Figure 2.7: Schematic representation of the Chemical Vapor Deposition method [21].
Depending on the adhesion between the catalyst and the substrate, there are two different growth methods:
1. Tip Growth Method, where, during the growth, the catalyst particles remain in the ex-tremity of the growing nanotubes
2. Base Growth Method, where the catalyst particles stay at the base of the nanotube Comparing to the arc and laser methods, this technique is a simple, versatile and economic way to produce industrial quantities of cabon nanotubes at low temperatures and ambient pressure. In addition, there is more control over the structure and length of the nanotube and purity levels are higher. However, in crystallinity, arc and laser produced CNTs reveal superior levels [6, 22].
2.2
Epoxy Resin
Epoxy resins are generally formed from the crosslinking reaction of polyepoxides (monomer) and polyamines (hardener) to form a rigid network [23]. Chemically crosslinked systems (fig. 2.8) are typically known as thermosetting polymers because the crosslinking agent is heat activated.
Crosslinking proportionally increases the density of a poly-mer, and with this increase, molecular motion in the sample is hindered, causing a rise in the glass-transition temperature (Tg). The higher the Tg, the higher the cross-linked density and consequently the higher the modulus [24, 25], therefore, the Tg is strongly dependent on the curing process. Although an ordered molecular structure could conceptually exist, the overall molecular
structure of a crosslinked epoxy is amorphous [26]. Figureschematic2.8:representationCrosslink [27].
2.3
Carbon Nanotube Reinforced Polymer
Carbon nanotubes (CNTs) have gained significant interest to provide multifunctional character to carbon fiber reinforced composites. They offer strong potential as a nanoscale filler material because of their exceptional mechanical, thermal and electrical properties, already reviewed in chapter 2.1. The incorporation of this filler in a polymer matrix, such as epoxy resin, should result in a significant improvement in matrix properties. However, the obtained properties are inferior to the expectations. This can be explained by a number of reasons that are enumerated below and further explored in the following sections:
1. Some polymer matrices are more sensitive than others to the presence of the carbon nan-otubes, therefore, a proper selection of the matrix is essential - section 2.3.1;
2. Van der Waals’ attraction makes entangled agglomerates incapable of fully blending into the polymer with a good dispersion - section 2.3.2;
3. Poor interfacial interaction between CNTs and polymer matrix can lead to a insufficient load transfer - section 2.3.3;
4. Defects on the structure and geometry, such as bent and twisted CNTs - section 2.3.4; 5. Alignment of carbon nanotubes within the composites - section 2.3.5;
6. Level of purity of the carbon nanotubes used in the composites - section 2.3.6.
Although the CNT production cost is higher than conventional fillers, it should be bal-anced out by the low loading levels required, usually between 0.1 and 3%, and consequently, there is no significant weight addition. In addition, the processing equipment required for such nanocomposites is the same as that used for neat resins.
2.3.1 Proper Selection of the Polymer Matrix
Both thermosetting and thermoplastic polymers have been used as matrix materials in carbon nanotube/polymer composites. Depending on the polymer matrix and processing conditions, large variations in their measured properties are found. Therefore, the properties of carbon nanotube/polymer composites are highly polymer specific.
According to Lijie Ci et al. [28], the reinforcement role of carbon nanotubes gradually reduces while increasing the stiffness of matrix. By controlling the curing process, Lijie Ci and co-worker prepared carbon nanotube/epoxy nanocomposites with different matrix stiffness (fig.2.9). The reinforcement role was assessed in the different matrices according to the me-chanical tests and SEM observations. In soft and ductile matrices, nanotubes show a significant reinforcement effect because of the possible accelerated curing process and the better interface adjoining. On the other hand, the interface interaction is poor in the stiff composite, due to complete cross-link of the polymer molecules surrounding the carbon nanotubes.
0.0 0.5 1.0 1.5 2.0 2.5 3.0 0.5 1.0 1.5 2.0 2.5 3.0 3.5 EC /E M and σC / σM
Matrix Modulus (GPa) Young's modulus Normalized tensile stress
Figure 2.9: The evolution of the reinforcement of carbon nanotubes in epoxy composites with different matrix stiffness [28].
2.3.2 Dispersion
Carbon nanotubes, in all their forms, are difficult to disperse and dissolve in water and in organic medium and they are extremely resistant to wetting and, for a nanocomposite, a good dispersion of the nanofiller within the matrix is crucial. Since the extremely large surface area leads to strong tendency to form agglomerates, preventing re-aggregation of the nanofiller is a challenging task. A non uniform dispersion can lead to carbon nanotube agglomerates acting as defect sites and limiting the efficiency of CNT as reinforcement filler [29]. In order to evaluate the dispersion at nano scales, several methods can be used [30]:
• Microscopy, optical, transmission electron (TEM) or scanning electron (SEM), are com-monly used to observe dispersion and can provide useful information about the aggregate size and microscale dispersion quality. SEM and TEM were used to assess dispersion qual-itatively in cured samples. However, this method is qualitative and usually covers a small area of the sample, which may not be representative of the whole system.
• Rheological analysis of nanotube suspensions can provide insight into the microstructure and can be used to correlated with enhancement of properties. Rheological properties of the suspension are strongly influenced by the nanotube volume fraction and aspect ratio, polymer–CNT interactions and the state of nanotube dispersion and network formation. • An effective quantitative method is ultraviolet–visible (UV–Vis) spectroscopy. Individual
carbon nanotubes exhibit characteristic bands of absorption, whereas agglomerates are hardly absorptive in the wavelength region between 200 and 1200 nm. Furthermore, it is possible to correlate the amount of individual nanotubes in suspension with the intensity of the corresponding absorption spectrum. Therefore, UV–Vis spectroscopy can be used as a quantitative tool for nanoscale dispersion characterization in diluted uncured samples. • Measuring the electrical conductivity, which is based on the fact that higher electrical conductivity is obtained in the case of better nanotube dispersion [31] is an indirect method to evaluate the dispersion.
• Other methods, such as Thermogravimetric Analysis (TGA) and Differential Ccanning Calorimetry (DSC) can be used as well. However, potential effects of additives can mod-ify results. Due to the high viscosity of the resin used, the sedimentation technique is unfeasible.
The dispersion problem for carbon nanotubes (CNTs) is dimensionally different (fig.2.10) from other conventional fillers, such as spherical particles or short fibers, because CNTs are nanometer scale small diameter associated with high aspect ratios (l/d > 1000) and, conse-quently, extremely large surface area. In addition, the commercial CNT products are supplied in the form of heavily entangled aggregates, which results in inherent difficulties in dispersion and also in a high viscosity of the nanotube/polymer mixture [32, 7].
Figure 2.10: Scale difference between cabon nanotubes and carbon fibers
Table 2.1 compares the dimensions of common fillers, such as alumina Al2O3 particles, carbon fibers, graphite nanoplatelets (GNPs) and CNTs and the number of particles correspond-ing to a 1 mm3 cube with a uniform filler volume fraction of 0.1% in volume.
Table 2.1: Dimension and corresponding number of particles in composites for different fillers [7].
Filler Average Diameter d Average Length l Average Thickness t No of particles in 1mm3 and 0.1vol% Surface area of each particles Al2O3 particle 100µm - - 1.9 S = πd2 Short Carbon Fibers 5µm 200µm - 255 S = πdl + πd 2/2 GNP - 45µm 7.5 nm 6.58 × 10⁴ S = 4l2+ 2lt CNT 12nm 20µm - 4.42 × 10⁸ S = πdl + πd2/2
The large quantity of particles and their size effect will lead to an exceptionally large surface area of nano-scale fillers in the composite. There is about 500 times difference in surface area between the Al2O3 and CNT particles. In figure 2.11, it is possible to compare the theo-retical distribution of the different fillers. The inherent difficulty in the dispersion of CNTs into a polymer matrix is explained by this large surface area and particle agglomeration due to the electrostatic interaction and van der Waals force. The real distribution of the nano-scale fillers (C and D in Fig.2.11) should be more complex than the shown simulation. This agglomeration effect increases with increasing content of the nanotubes.
Figure 2.11: Simulation of the distribution of various fillers in 1 mm3 with a constant filler volume
fraction of 0.1% in volume. A: Al2O3 particle; B: Carbon Fiber; C: Graphite Nanopowder (GNP); D:
Carbon nanotubes (CNT) [7].
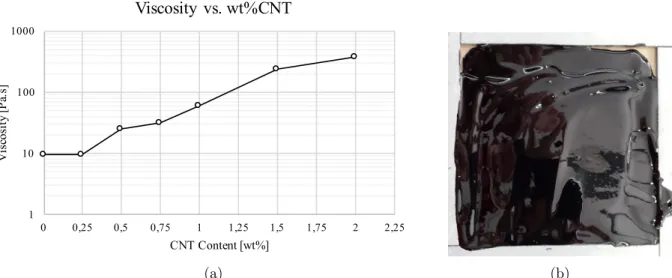
Associated with this large surface, there is an increase in the viscosity of the uncured resin. This higher viscosity turns more difficult the processing of the resin and can preclude its use in industrial applications, such as the impregnation of carbon fibers 2.12b.
1 10 100 1000 0 0,25 0,5 0,75 1 1,25 1,5 1,75 2 2,25 V is cos it y [P a. s] CNT Content [wt%] Viscosity vs. wt%CNT (a) (b)
Figure 2.12: (a) Viscosity as a function of the carbon nanotubes content, at a shear rate of 1s−1, and (b)
visible high viscosity of a 0.75wt.% carbon nanotube filled epoxy.
Fig.2.13 shows scanning electron microscopy (SEM) image of CNT entanglements. It has been proven that these agglomerates result in diminished mechanical and electrical properties of composites as compared with theoretical predictions related to individual CNTs [33–35].
It is possible to achieve improved dis-persion by applying various techniques, for example, employing physical treatment such as ultrasonication, ball milling, calendering, stirring, and extrusion [7], through functional-ization of the nanotube [36] or even adding a dispersion agent [37].
The dispersion within the polymer ma-trix can be controlled as well through in-situ polymerization of nanotube/polymer monomer
mixture, solution casting of suspension of
carbon nanotubes in the dissolved polymers, melt mixing of carbon nanotubes/nanofibers with polymers, and the use of surfactants [32].
Figure 2.13: SEM image of entangled MWCNT agglomerates [7].
However, any treatment aimed at obtaining good dispersion, purification or chemical re-activity must be performed with care because certain implications and limitations associated with its use can exist. For example, ultrasonication use, with prolonged exposure, may induce structural damage to the nanotubes [3] as can extensive ball milling, decreasing the CNT length [38] and, consequently, lowering the aspect ratio, which can resulted in relatively less strong bond with the matrix [5].
Table 2.2: Comparison of various physical techniques for CNT dispersion in polymer composites [7]
Technique Damage
to CNTs Suitable Polymer Matrix Factors
Ultrasonication Yes Soluble polymer, low viscous
polymer or oligomer, monomer
Power, mode of sonicator, sonication time
Calendering No Liquid polymer or oligomer,
monomer Rotation speed and gap
Ball Milling Yes Powder (polymer or monomer) Milling time, rotation speed,
size of balls and ball/CNT ratio
Shear Mixing No Soluble polymer, low viscous
polymer or oligomer, monomer
Propeller’s size and shape, mixing speed and time
Extrusion No Thermoplastics Screw’s temperature,
configuration and rotation speed
2.3.2.1 Ultrasonication
Ultrasonication is a technique that uses ultrasound energy to agitate particles in a solution, and it is the most frequently used method for nanoparticle dispersion. Ultrasound waves promote the ”peeling off” of individual nanoparticles located at the outer part of the nanoparticle bun-dles, or agglomerates, and thus results in the separation of individual nanoparticles from the bundles. This method is effective in dispersing CNTs in liquids with low viscosity, such as water, acetone or ethanol. However, most polymers have a higher viscosity and therefore need to be diluted using a solvent [7]. This technique was used to disperse the carbon nanotubes to en-hance the Scanning Electron Microscope (SEM) visualization of the nanotubes without the resin.
2.3.2.2 Ball Milling
Ball milling is a type of grinding method that uses collision between very small rigid balls, as small as 100nm in diameter, concealed in a container to induce high pressure locally and grind the mate-rial into a fine powder (fig. 2.14). Different matemate-rials are used as balls including ceramic, flint pebbles and stainless steel. Ball milling of CNTs in the presence of chemicals not only enhances their dispersibility, but also introduces some functional groups onto
the CNT surface [7]. Figure 2.14:ball milling Schematic
2.3.2.3 Calendering
The calender is a machine tool that uses rollers to employ shear force and mix disperse or homogenize viscous materials. The general configuration of a calendering machine consists of three adjacent cylindrical rollers each of which runs at a different angular velocity (fig.2.15). The gaps between the rollers combined with the mismatch in angular velocity of the adjacent rollers, result in local high shear forces with a short residence time [4].
The first and third rollers, called the feeding and apron rollers (from the left to the right fig.2.15), rotate in the same direction while the center roller rotates in the opposite direction. In order to maximize dispersion, the processing cycle can be repeated several
times. The narrow gaps can be mechanically or hydraulically
adjusted and maintained (from 500 to about 5 µm), thus it is easy to get a controllable and narrow size distribution of particles in
viscous materials. Figure 2.15: Schematic
calendering process [7]. To disentangle and disperse CNT agglomerates into a polymer medium, a high shear stress is required. However, the dimensional disparities between the gaps and the typical diameter of the CNTs, suggests that this process only breaks the agglomerates into smaller ones with some desentangled individual CNTs [7].
2.3.2.4 Mechanical Stirring
Mechanical stirring (fig.2.16) is a commonly used technique to
dis-perse nanoparticles. It consists in a propeller that rotates and
creates shear stresses in the resin. The dispersion result can be controlled by the shape and size of the propeller, the duration and speed of stirring. Carbon nanotubes tend to re-agglomerate after the stirring, mainly because van der Waals attractive forces. Dur-ing stirrDur-ing, frictional contacts and elastic interlockDur-ing mechanisms that makes the desegregation more difficult [39]. Nevertheless, a relative fine dispersion can be achieved after intensive stirring of
2.3.2.5 Functionalization
Due to the aromatic nature of the bonds, the chemical stability of the carbon atoms is respon-sible for the inert interaction of the CNTs with the surrounding matrix. They can interact mainly through van der Waals (vdW) force, which is unable to provide an efficient load transfer between the CNTs and the matrix [7]. Therefore, methods to modify surface properties of the CNTs have potential. These methods can be divided into chemical functionalization and physical methods based on the interactions between the active molecules and carbon atoms on the CNTs.
Table 2.3: Comparison of various physical techniques for CNT dispersion in polymer composites [7].
Method Type Principle Damage
to CNTs Easy to use Interaction CNT re-agglomeration Chemical
method Side wall
Hybridization of C
atoms from sp2 to sp3 Yes No Strong Yes
Defect Defect transformation Yes Yes Strong Yes
Physical method
Polymer wrapping
vdW force, π − π
stacking No Yes Variable Yes
Surfactant
adsorption Physical adsorption No Yes Weak Yes
Endohedral Capillary effect No No Weak Yes
Chemical functionalization can be used to tailor the interaction between the nanotubes and the polymer matrices, a solvent or even other nanotubes. It helps preventing the re-aggregation of the carbon nanotubes (CNTs) and leads to a better coupling with the polymeric matrix. The latter is very important for an efficient load transfer of the stresses to the nanotubes. Therefore, functionalization might improve solubility and processibility of the composite [36].
This functionalization is based on the covalent linkage of functional groups onto the carbon structure of CNTs. It can be performed at the sidewalls or at the end of the nanotubes. Direct covalent sidewall functionalization is associated with a change of hybridization from sp2 to sp3 and a simultaneous loss of π-conjugation system on graphene layer (fig.2.17a). This functional-ization can be produced by reaction with some molecules of high chemical reactivity.
Defect functionalization is another method for covalent functionalization of CNTs and can be achieved by introducing some functional groups on defect sites of CNTs (fig.2.17b). This de-fect sites can be the open ends and/or holes in the sidewalls, pentagon or heptagon irregularities in the hexagon carbon nanotube framework. Using oxidizing agents, such as strong acids, can result in the formation of carboxylic (-COOH) or hydroxyl groups (-OH) on the surface of nan-otubes. The chemically functionalized CNTs can produce strong interfacial bonds with many polymers, allowing CNT based nanocomposites to enhance mechanical and functional properties. Carboxylic Acid functionalization procedure consists in grafting carboxylic acid func-tional groups onto the nanotubes surface. Carboxylic acid-funcfunc-tionalized multi-walled carbon nanotubes (MWCNT-COOH) are obtained by oxidation pristine MWCNTs via sonication in sulfuric-nitric acid [41].
Thermal oxidation process consist of a heat treatment ranging from 1500oC to 2500oC. Oxidation of carbon nanotubes removes impurities, such as amorphous carbon, and improves
temperature increases, removal of smaller diameter tubes can occur [42]. Finally, the thermal oxidation creates bonding sites on the tube walls by breaking the C–C bonds [43]. Composite materials may benefit by having tubes of a narrower range diameter distribution, free of amor-phous carbon impurities and more bonding sites for better contact with the matrix [44].
(a)
(b)
(c)
(d)
Figure 2.17: Chemical, or covalent, functionalization: (a) Sidewall and (b) Defect functionalization. Physical, or non-covalent, functionalization: (c) ”Wrapping” and (d) Endohedral functionalization [36].
Physical functionalization is a non-covalent functionalization technique for tuning the in-terfacial properties of nanotubes. The suspension of CNTs in the presence of polymers or surfac-tants, such as poly(phenylene vinylene)[45] or polystyrene [46], forming a wrap of the polymer around the nanotubes (fig.2.17c), creating a supermolecular complexes of CNTs. The polymer wrapping is achieved through van der Waals interactions and π − π stacking between CNTs and polymer chains containing aromatic rings [7]. All these previous mentioned functionalizations are exohedral, or in other words, applied to the exterior of the nanotube. A special case is the endohedral functionalization, i.e., the filling of the tubes interior with atoms or small molecules (fig.2.17d)[36].
A functionalized nanotube might have different mechanical or electrical properties from those of the neat nanotube, and thus it may be used for fine-tuning the chemistry and physics of CNTs. Although it can lead to significant improvement in CNT dispersion and stress trans-fer, it can also cause deterioration of intrinsic properties of the CNTs. For example, chemical functionalization often lead to tube fragmentation and the physical functionalization results in poor exfoliation. Therefore, dispersion and stabilization require compromises to be made [47, 6].
16 2.3. CARBON NANOTUBE REINFORCED POLYMER
2.3.3 Load Transfer
The large surface area of the carbon nanotube filler means a large interface area present between the filler and matrix. In composites, a definition of this ”‘interface” is a surface formed by a common boundary of the reinforcement and the matrix that is in contact and maintains the bond for stress transfer. The load-bearing capability of a composite depends on that efficiency of stress transfer, which is largely controlled by the nature of the bonding at the interface region, in addition to the mechanical properties of the fiber and matrix [48]. In general, a strong inter-facial bond corresponds to an effective transfer of the applied load to the reinforcement element, in this case the carbon nanotubes, theoretically resulting in improved mechanical properties [7]. In fibrous composites, the stress transfer between the matrix and fiber is transferred by shear stresses. At some critical value of the interfacial shear stress, either the matrix near the interface or the matrix–nanotube bond will rupture, resulting in debonding. This value for the shear stress is known as the InterFacial Shear Strength (IFSS) and reveals the maximum possible stress transferred to the nanotube, being an important parameter for any fiber-like reinforced composite [49].
It has been reported that the interfacial bonding between the carbon nanotubes and poly-mer resins is weak and the load transfer from the polypoly-mer to the nanotubes is not large enough for them to be broken under tensile loading. Instead, the CNTs tend to be pulled out [50, 28].
Commercially available nanotubes are usu-ally 0.5–5 µm long. In the design of conven-tional composites, it is well known that the fiber length has a major influence on the stiffness and strength of the matrix. For effective load trans-fer, the fiber length has to exceed a critical value lc(fig. 2.18) given by the following equation [51]:
lc= σf∗d
2τc
(2.5) where σf∗ is the tensile strength of the fiber, d is the fiber diameter and τc is the fiber–matrix bond strength or the shear yield strength of the matrix, whichever is smaller [52].
* * * Position 0 l l > lc Stress f f f lc 2 lc 2
Figure 2.18: Stress–position profiles when fiber length l is greater than the critical length, for a fiber reinforced composite that is subjected to a tensile stress equal to the fiber tensile strength σ∗f [52].
It has been found that the long-nanotube composite shows an increase in the stiffness rela-tive to the polymer and behaves anisotropically under the different loading conditions. However, the short-nanotube composite shows no enhancement relative to the polymer, most probably because of its low aspect ratio [32].
2.3.4 Geometry Defects
It was observed that the number of defects, like structural defects, bends or twists (fig. 2.19a), affect the strength of the nanotubes [53]. Buckling of the CNTs happens presumably because of the shrinkage of the polymer matrix as the composite cools down, which originates compressive and/or bend stresses on the nanotubes [54, 55]. However, the creation of defects is not always a disadvantage, as can be analyzed in section 2.3.2.5.
Waviness of carbon nanotubes (fig.2.19b), as well as interfacial bonding conditions, play a critical role in determining the reinforcing efficiency in carbon nanotube reinforced composites. It is shown that the waviness can significantly reduce the stiffening effect of the nanotubes. The effective elastic constants of the composites are very sensitive to the waviness when debonding is small [56].
(a) (b)
Figure 2.19: (a) The left panel gives the ideal tube structure, the middle and right panels show the effects of uniform bend and twist on the structure [53]. (b) TEM image of a bent nanotube on the left and the restored shape on the right, showing the elastic nature of the deformation [55].
2.3.5 Alignment
The mechanical and electronic properties of carbon nanotubes are not only sensitive to their diameter and chirality (see section 2.1) but are also highly anisotropic. Thus, in order to maxi-mize some properties, it is important to have a controllable alignment of the carbon nanotubes in the final composites [32]. Several techniques were developed to overcome this issue, and some of them, with applicability in thermosets, are described bellow:
• Electrical field alignment - The applied electric field induces a strong dipole moment in the axis parallel to the length of the nanotubes, they attempt to align perpendicular to the two parallel electrodes and along the electric field direction. However, the nanotubes are drawn by the strong Coulomb (electrostatic) forces at electrode edges and are largely deposited on the electrodes. Kumar et al. [57] reported a ”few CNTs aligned vertically to the electrodes” when applied a DC electric field of 25 kV/cm between the electrodes (fig. 2.20).
Figure 2.20: Aligned carbon naotubes be-tween elecrodes [57].
Khan et al. [58] reported that nanotube alignment (fig.2.21) gave rise to improvements in mechanical properties (approximately 40% rise in modulus for 0.3 wt.%CNT) and electrical conductivity in the direction of orientation, compared to composites containing randomly-oriented CNTs.
Figure 2.21: Optical micrographs of 0.3 wt.%CNT/epoxy showing MWCNT networks in composites cured after (a) 5 min and (b) 15 min of the application of the electric field [58].
• Magnetic field alignment - The nanotubes are aligned in a polymer matrix by polymer-izing under a magnetic field. Magnetic susceptibility, electrical conductivity, and elastic modulus measurements showed clear anisotropy, indicating magnetic field induced align-ment [59, 60]. Choi et al. [61] prepared aligned epoxy/CNT nanocomposites under a 25 T magnetic field. Their thermal and electrical properties along the magnetic field alignment direction are increased by 10 and 35%, compared with epoxy/MWCNT nanocomposites without the application of a magnetic field.
• Magnetic field assisted alignment - The movement of magnetic particles under an applied magnetic field provide drag force in the direction of field lines, imposing a direction to the nanotubes in the matrix (fig.2.22 and 2.23b). The magnetic particles can be removed by cutting the edge of the composite or with another magnet to recollect them [62]. In figure 2.23a it is possible to see the effect of the magnetic assisted induced alignment in the stress-strain curves.
Figure 2.22: (A) Representative illustration of applying a magnetic field by a simple magnet, (B) uniform, unidirectional and non-turbulent movement of magnetical particles toward the magnet and (C) alignment of nanotubes along the flow lines by drag force caused from magnetical particles movement [62].
(a) (b)
Figure 2.23: (a) Stress vs. strain curves of MWCNT/epoxy composites [62] and (b) TEM images of aligned MWCNTs–epoxy composites [62].
2.3.6 Purity
Depending on the method used to produce carbon nanotubes, impurities such as carbon soot/ catalyst nanoparticles mixed with the nanotubes can exist, undermining the properties of the final composites [63]. Higher level of purity could be achieved using fabrication methods that produce less impurities (section 2.1) and by precisely controlling the manufacturing process [32, 64]. Heat treatments, such as the one present in the thermal oxidation functionalization process (section 2.3.2.5), can eliminate some carbon impurities, being possible to achieve higher values of purity [44].
2.4
Carbon Fiber Reinforced Plastic
Carbon fiber composites, particularly those with polymeric ma-trices, have become the dominant advanced composite materials for aerospace, automobile, high performance sporting goods, and other applications, due to their highest specific modulus and specific strength of all reinforcing fiber materials. Fibers are the load-carrying component while the matrix acts as a load transfer element, keeping them together, in the desired orientation and protected from the environment (fig.2.24) [65, 52].
JWCL187_ch16_626-672.qxd 10/28/09 9:56 AM Page 629
Figure 2.24: Schematic
representation of a fibrous composite [52].
Carbon fibers refer to fibers which are composed by, at least, 92 wt.% carbon [65]. They can be chopped or continuous, with diameters ranging between 4 and 10 µm, and can be pre-pared from polymeric precursor materials such as polyacrylonitrile (PAN), cellulose (or rayon), pitch and polyvinylchloride. PAN based carbon fibers are the most common and have good strength and modulus properties, while pitch-based fibers have a higher modulus with a lower strength [66]. Carbon fiber can retain their properties at elevated temperatures, however
high-temperature oxidation may be a problem. At room temperature, they are not affected by
moisture or a wide variety of solvents, acids, and bases. In addition, carbon fibers are normally coated with a epoxy sizing that not only improves adhesion with the polymer matrix, but also protects [52].
”Prepreg”, which is the industry’s term for continuous-fiber reinforcement impregnated with a polymer resin, is probably the most widely used form of composite for structural applications. This material has to be stored at negative temperatures and is used in a partially cured state that is finished with heat and pressure (for example, with an autoclave).
Laminate (fig. 2.25), which is a consolidated stack of thin two-dimensional sheets, or layers, of fibers embedded in a matrix that have a preferred high-strength direction, is the most common form of continuous fiber-reinforced composite and it is used in structural applications. Mechanical properties of the laminate are controlled by the layer stacking sequence and the volume percentage and orientation of the fibers in each layer. This way, it is possible to optimize the mechanical properties to a specific load solicitation [52].
Figure 2.25: Schematic
representation of a laimi-nate stack [52].
For each fiber–matrix combination, a critical fiber length lc exists, which depends on
diameter d and tensile strength σ∗f of the fiber and on the bond strength between them and the matrix or the shear yield strength of the matrix, whichever is smaller, τc.
lc= σf∗d
2τc
(2.6)
For continuous and aligned fibers (l > 15lc), mechanical properties are highly anisotropic. In the alignment direction, reinforcement and strength are maximum and perpendicular to the alignment, they are a minimum. Rule-of-mixtures expressions for the modulus in the longitudinal (eq.2.7) and transverse orientations (eq.2.8) are known to compute an accurate estimation.
EcL= VfEf + (1 − Vf)Em (2.7)
EcT = EmEf
VfEm+ (1 − Vf)Ef
(2.8)
where E is the elastic modulus and V stands for the volume fraction, respectively, and subscripts c, f and m represent composite, fiber and matrix, respectively [52].
The introduction of carbon nanotubes in advanced matrices of traditional fiber reinforced composites may lead to the potential development of a new generation of multifunctional com-posite materials with exceptional mechanical, thermal and electrical properties. However this area is rather uncharted. It has been reported that the addition of carbon nanotubes into fibrous composites may enhance a number of properties. Thostenson et al. [67] reported that the pres-ence of carbon nanotubes, synthesized on the surface of carbon fibers, improves the interfacial shear strength of the composites.
2.5
Thermogravimetric Analysis
Thermogravimetric analysis (TGA) is an experimental technique in which the mass of a sample is measured as a function of temper-ature or time. The sample is typically heated at a constant heating rate (dynamic measurement) or held at a constant temperature (isothermal measurement), depending on the type of information
required about the sample. Additionally, the atmosphere used
in the experiment plays an important role and can be reactive, oxidizing or inert. In this work, only dynamic mode with inert Nitrogen atmosphere was used, in order to obtain the effective fiber content for the composite samples.
Figure 2.26: TA
Instru-ments SDT Q600 [27]. The equipment present in the laboratory is a SDT Q600 (TA Instruments, New Castle, US) (fig. 2.26), which is a simultaneous thermogravimetric (TGA) and differential scanning calorimeter (DSC) analyzer.
The results of a TGA measurement are typically displayed as a curve in which mass, or per cent mass, is plotted against temperature and/or time (fig. 2.27). Mass variation occurs when the samples looses material, and it can be caused, for example, by the following factors:
• Evaporation of volatile constituents; drying; desorption of gases, moisture and other volatile substances; loss of water of crystallisation;
• Oxidative decomposition of organic substances;
• Thermal decomposition with the formation of gaseous products. With organic compounds, this process is known as pyrolysis or carbonisation.
2.6
Dynamic Mechanical Analysis
Dynamic Mechanical Analysis (DMA), or Dynamic Mechanical Thermal Analysis (DMTA), is a technique used to measure the me-chanical properties of a wide range of materials, including polymers. Polymers behave both like an elastic solid and a viscous fluid, thus the term viscoelastic. DMA differs from other mechanical testing devices in two ways.
1. In many applications, viscous component is critical and typ-ical tensile test devices focus only on the elastic component. It is the viscous component that determines properties such as impact resistance.
2. DMA works primarily in the linear viscoelastic range and typical tensile test devices work primarily outside this range. Therefore, DMA is more sensitive to structure.
Figure 2.28: TA
Instru-ments DMA Q800 [27]
Viscoelastic properties are measured using either transient or dynamic oscillatory tests. Transient tests include creep and stress relaxation. In creep, a constant stress is applied to the sample while deformation is measured against time. After a certain time, the stress is removed and the recovery is measured (fig.2.29a). In stress relaxation, a constant deformation is applied to the sample while the decreasing of the stress against time is recorded (fig.2.29b). Both tests are used to assess the viscoelastic behavior of materials.
(a) (b)
Figure 2.29: (a) Creep test - Constant stress is applied while deformation is measured against time. After a certain time, the stress is removed and the recovery is measured. (b) Stress relaxation test - Constant deformation is applied while the decreasing of the stress against time is recorded
The most common test is the dynamic oscillatory test, where a sinusoidal stress is applied to the material and a sinusoidal strain is measured (fig. 2.30b). Also measured is the phase difference, δ, between the two sine waves. The phase angle is expressed in radians or degrees and will be zero degrees for purely elastic materials and 90 degrees for purely viscous materials. Polymers will exhibit an intermediate phase difference.
E˝ ~ Energy loss in internal motion E´ ~ Elastic response 53124_C005.indd 74 4/28/08 2:48:17 PM (a) (b) (c)
Figure 2.30: (a) Elastic response of a ball that is dropped. (b) δ = 0ofor purely elastic materials. δ = 90o
for purely viscous materials. Polymers exhibit an intermediate phase difference. (c) From the complex
modulus E* and δ, the storage modulus E0 and the loss modulus E00 can be computed.
Since the modulus is the quotient of stress and strain, the complex modulus E*, can be calculated. From E* and the measurement of δ, the storage modulus E0 and loss modulus E00can
be computed (fig.2.30a and 2.30c). The real part E0 of the modulus may be used for assessing
the elastic properties, while the imaginary part E00 for the viscous properties.
According to ISO 6721-1[68], the storage modulus E0represents the stiffness of a viscoelas-tic material and is proportional to the elasviscoelas-tic energy stored during a loading cycle. It is roughly the same as the elastic modulus for a single, low load and rapid stress solicitation with totally
reversible deformation. The loss modulus E00 is defined as being proportional to the energy
dissipated during a loading cycle. It represents, for example, energy lost as heat with molecular motions, and is a measure of vibrational energy that has been converted and that cannot be recovered. 0,0 0,1 0,2 0,3 0,4 0,5 0,6 0,7 0,8 0,9 0 250 500 750 1000 1250 1500 1750 2000 2250 35 45 55 65 75 85 95 105 115 125 135 145 155 Ta nẟ E ' a nd E '' [M P a] Temperature [ºC]
Typical epoxy DMA curves
E' E'' Tan (a) 0,0 0,1 0,1 0,2 0,2 0,3 0 10000 20000 30000 40000 50000 60000 70000 80000 90000 50 60 70 80 90 100 110 120 130 140 150 Ta nẟ E ' a nd E '' [M P a] Temperature [ºC]
Typical epoxy/carbon fiber DMA curve
E' E'' Tan
(b)
Figure 2.31: Example of DMA curves for (a) neat epoxy resin and (b) carbon fiber reinforced epoxy.
The tangent of phase difference δ, also known as the loss factor, is the ratio of loss mod-ulus to storage modmod-ulus, and is another common parameter that provides information on the relationship between the elastic and loss component. It is a measure of the energy lost and rep-resents mechanical damping or internal friction in a viscoelastic system. High tan δ values are indicative of a material that has a higher plastic strain component, while a low value indicates a more elastic behavior. These parameters can be determined as a function of time, temperature (fig.2.31), frequency, or amplitude (stress or strain) depending on the objective [27, 68].
![Table 2.2: Comparison of various physical techniques for CNT dispersion in polymer composites [7]](https://thumb-eu.123doks.com/thumbv2/123dok_br/15721595.1070529/32.892.86.761.591.841/table-comparison-various-physical-techniques-dispersion-polymer-composites.webp)
![Table 2.3: Comparison of various physical techniques for CNT dispersion in polymer composites [7].](https://thumb-eu.123doks.com/thumbv2/123dok_br/15721595.1070529/34.892.79.772.311.523/table-comparison-various-physical-techniques-dispersion-polymer-composites.webp)
![Figure 2.21: Optical micrographs of 0.3 wt.%CNT/epoxy showing MWCNT networks in composites cured after (a) 5 min and (b) 15 min of the application of the electric field [58].](https://thumb-eu.123doks.com/thumbv2/123dok_br/15721595.1070529/38.892.155.699.221.423/figure-optical-micrographs-showing-networks-composites-application-electric.webp)