MASTER
I
NTERNATIONAL
E
CONOMICS AND
E
UROPEAN
S
TUDIES
MASTER´
S FINAL WORK
DISSERTATION
T
RADE PATTERN OF
C
HINA WITH HIGH
-
AND LOW
-INCOME COUNTRIES
ZHU JIE
MASTER
INTERNATIONAL
ECONOMICS
AND
EUROPEAN
STUDIES
MASTER´
S FINAL WORK
DISSERTATION
TRADE
PATTERN
OF
CHINA
WITH
HIGH-
AND
LOW-INCOME
COUNTRIES
ZHU
JIE
S
UPERVISION
:
PHD.
PROFESSOR
PEDRO
ALEXANDRE
REIS
CARVALHO
LEÃO
i
ACKNOWLEDGMENTS
I would like to thank professor Pedro Leão for his orientation, support and encouragement along my dissertation writing process.
I would like to thank my family, especially my mother and my uncle for the support during my academic and personal life and the incentive to achieve my goals.
I would like to thank all my professors of ISEG for the patience given to me during the lectures.
Last but not the least, I would like to thank my colleagues and friends for the companionship during thesis writing.
ii
ABSTRACT
The objective of this dissertation is to analyze the present trade pattern of China with two distinct countries groups – the first group is composed of 20 developed & high-income countries and the second group consists of 20 developing & low-income countries. The analysis is based on trade data for the year of 2016.
The paper consists of two main parts - inter-industrial trade and intra-industrial trade analyses between China and the two countries groups. The ratio analysis methodology and Grubel-Lloyd´s Intra-industrial trade Index are applied to capture, respectively, the inter-industrial trade and intra-inter-industrial trade patterns of China with the two groups. Several international trade theories are used to interpret the empirical results.
The results show that the inter-industrial trade patterns of China with two groups are very distinct. Moreover, it is concluded that the intra-industrial trade between China and the High-income group is much bigger than it between China and the Low-High-income group.
Keywords: China; High-income countries; Low-income countries; Inter-industrial trade; Intra-industrial trade; Product categories.
iii
CONTENTS
1. INTRODUCTION ... 1
2. THEORETICAL FRAMEWORK ... 1
3. METHODOLOGY ... 3
3.1 TRADE PARTNERS AND DATABASE ... 4
3.1.1. Trade partners’ selection ... 4
3.1.2 Database’s selection ... 6
3.2 INTER-INDUSTRY TRADE APPROACH ... 7
3.2.1. Analysis strategy ... 7
3.2.2 Four basic variables... 8
3.2.3 Two research methods and four indicators ... 9
3.3INTRA-INDUSTRY TRADE APPROACH ... 11
4. RESULTS ANALYSIS ... 13
4.1INTER-INDUSTRIAL TRADE RESULTS ANALYSIS ... 13
4.1.1. First research method – trade indicator with the High-income group/Low-income group .. 13
4.1.2. Second research method – exports/imports indicator with two income groups ... 24
4.2 INTRA-INDUSTRY TRADE RESULTS ANALYSIS ... 28
4.2.1. Intra-industrial trade between China and two income groups ... 28
4.2.2. Intra-industrial trade by sector between China and two income groups ... 29
1
1. Introduction
Over the past few decades: from the reform and opening-up policy in 1980, the entrance to WTO in 2001 to the “One Belt and One Road” initiative in 2013, China has become increasingly integrated in international trade and investment. And some striking results have occurred: in 2009 China surpassed Germany and became the world biggest exporter; in 2013, China became the world’s largest trader of merchandises, overtaking the United States.
This work attempts to capture China’s typical trade patterns in the international merchandise trade, by selecting two representative trading partners’ groups – one represented by advanced and industrialized economies like the United States and Germany, another represented by developing and low-income countries such as Tanzania and Senegal.
The analysis and comparison of the merchandise trade between China and these two groups of countries is thus the primary objective of this thesis. Several major international trade theories are used to explain the trade patterns revealed by the empirical results.
The paper proceeds as follows: firstly, I defined the study objects (trading partners and databases) and research methods for this work. Then, I analyzed the empirical results, using the international trade theories. Finally, I drew conclusions from the previous analysis. I started by briefly introducing the international trade theories used in the analysis.
2. Theoretical framework
This part explains the international trade theories that this work will utilize to interpret the empirical results, including mainly Ricardo´s comparative advantage theory, the Heckscher-Ohlin model, Krugman’s intra-industrial theory and the Linder theory.
In the book “Principles of Political Economy and Taxation” published in 1817, David Ricardo brought up the famous comparative advantage theory. Ricardo assumes that the production technologies are different between countries and therefore the same product with the same quality requires different hours of work to be produced in different countries (Ricardo, 1817).
2
products (products A and B) relative to country 2, it is still beneficial for country 1 to open up to trade. That is, even though country 1 produces fewer quantities of products A and B per hour than country 2, if the opportunity cost of producing A in terms of B is lower in country 1 than in country 2, there would be a joint gain if country 1 exports product A to country 2 and imports product B from country 2.
Moreover, Ricardo’s theory asserts that even though country 1 may have a lower productivity in product A, if it has a lower wage than country 2 and the country 1’s low productivity is more than offset by its low wage, country 1 ends up with a lower unit cost of production in product A. Therefore, country 1 will export A to country 2 and import B from that country.
The Heckscher-Ohlin model bases the motives of international trade on the national endowments of production factors – labour and capital. It asserts that the country relatively more endowed with labour has a relatively lower wage compared with the country relatively more gifted in capital and, thus, it has a lower unit cost in producing the labour-intensive goods. As a result, this country will export labour-intensive products and import capital-intensive products (Heckscher, 1919).
After World War II, the phenomenon of ever-increasing trade within the same sectors between developed countries attracted attention. As the traditional international trade theories could not explain it, intra-industry theories emerged. In Krugman’s intra-industry trade theory, the consumer’s preference for variety played the key role. Some consumers of country 1 prefer the varieties of a good produced in country 2 and some consumers of country 2 prefer the varieties of a good produced in country 1. This leads countries 1 and 2 to export and import between them varieties of the same good. In sum, consumers’ love for variety leads to intra-industry trade (Krugman, 1979).1
Another explanation for intra-industry trade is Brander and Krugman´s Reciprocal Dumping Model. This model has the following assumptions: competition is not perfect; companies have their domestic markets as main markets; and the domestic market and foreign
1 Intra-industry trade means the exchange of goods within the same industry and inter-industry trade means the
3
markets are segmented. It states that the firms are inclined to export products to foreign markets with a price lower than the local price. The logic is that it brings gains from selling in foreign markets without harming domestic revenues because the domestic and foreign markets are segmented.
On the other hand, if companies of country 1 dumps in country 2’s market and companies of country 2 dumps in country 1’s market, intra-industrial trade will arise (Brander and Krugman, 1983).
The Linder Theory, also called Overlapping Demand Theory, considers that the similar consumption patterns between countries is the fundamental reason for trade. Firstly, it is claimed that the per capita income level of a country makes the pattern of demand. More specifically, if consumers have a higher income, they tend to consume more sophisticated and higher quality goods; if consumers have a lower income, they tend to consume less sophisticated and lower quality goods.
Even though their own country produces the goods that the consumers desire, they would still want to purchase the goods of the same category imported from other countries because of product differentiation. Consequently, the more similar are the two countries’ consumption patterns, the more overlapped are the products desired by the two countries’ national consumers, and therefore the more trade occurs between them. By contrast, between two countries with distinct consumption patterns, the products that consumers want are sparsely overlapped. As a result, less trade occurs.
One important note of Linder theory is that it does not indicate the direction of trade – it is compatible with either inter-industrial trade (one direction), or intra-industrial trade (two directions) or both (Dennis and Alfred, 2001).
3. Methodology
This chapter explains the methodology applied in this work and has three parts: The first part explains the criteria used to select China’s trade partners and the databases used. The second and third parts explain the methodology used to analyze the inter-industrial trade and
4
the intra-industrial trade, respectively.
3.1 Trade partners and database
3.1.1. Trade partners’ selection
There are two main classifications of countries according to their level of development. The first is the division between developed and developing countries proposed by the IMF. It defines all 193 countries into two groups: 39 as advance economies (hereafter: developed countries) and the remaining 154 as emerging market and developing economies (hereafter: developing countries).
The second taxonomy is based on the gross national income (GNI) per capita, presented by the World Bank. This divides 217 countries and regions into four categories: high, upper-middle, lower-middle and low-income economies. The thresholds for the four groups are updated annually. For example, for the year 2016, the four groups have the following limits: above US$12735, between $4126 & $12735, between $1046 & $4125 and under $1045 (Group, 2018). Interestingly, a China turned into an upper-middle income economy in 2010 and has maintained that position ever since.
I defined two groups of countries by overlapping these two classifications. Firstly, the countries within the first group need to meet two criteria: they are developed countries and, at the same time, high-income countries. The figure below shows the relations between these two criteria, and only the countries belonging to the small circle were chosen to form the first group.
Figure 1 - Countries choice about the first group Source: IMF & World Bank
Developed countries
High-income countries
5
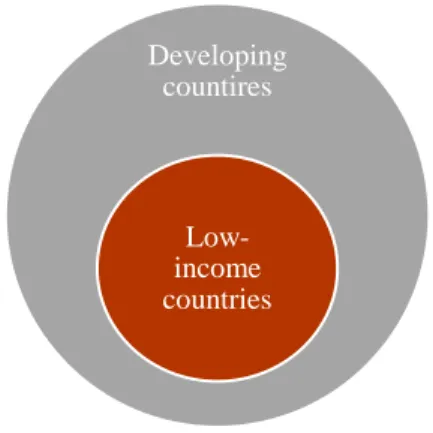
With the same criteria, the countries in second group are not only developing economies, but also low-income countries. In Figure 2, only the countries situated in the small circle were selected to establish the second group.
Figure 2 – Countries choice about second group Source: IMF & World Bank
So, why would it not be appropriate to use only one of these two classifications?
Firstly, if the criterion of developing and developed countries was the only one considered, countries like Poland and Mozambique would fall into the same category – developing countries, even though these two countries have huge differences at the economic level. This phenomenon is caused by its too broad definition2.
Secondly, if the criterion of per capita income was the only one considered, both highly industrialized countries like Germany and oil-rich countries like United Arab Emirates would be high-income countries, even though the domestic economic structures of these two countries are clearly different.
So, only considering one of these two criteria would not be enough. By contrast, overlapping these two classifications leads to a better selection of countries.
To make sure that the selected countries have large trade volume with China, these countries are trade partners with which China has the most trade in the two country’s categories
2 Because this taxonomy divides 193 countries in only two groups.
Developing countires
Low-income countries
6
mentioned above - developed & high-income countries and developing & low-income countries. So, in this manner, two countries groups were created: first group - 20 developed and high-income countries that China has most trade (hereafter: High-high-income group): United States, Japan, Republic of Korea, Germany, Australia, United Kingdom, Singapore, Netherlands, France, Canada, Italy, Switzerland, Spain, Belgium, Sweden, New Zealand, Israel, Czechia, Denmark and Ireland; second group – 20 developing and low-income countries with which China trades most (hereafter: Low-income group): Dem. People's Rep. of Korea, United Republic of Tanzania, Ethiopia, Dem. Rep. of the Congo, Senegal, Benin, Togo, Mozambique, Guinea, Liberia, South Sudan, Zimbabwe, Madagascar, Nepal, Uganda, Sierra Leone, Mali, Haiti, Afghanistan and Gambia.
3.1.2 Database’s selection
All the databases of trade data applied here are collected and compiled on the basis of Standard International Trade Classification (SITC), Revision 3 3 . SITC has various
disaggregation levels in terms of trading commodities: 10 sections at 1-digit level, 65 divisions at 2-digit level, 261 groups at 3-digit level and so on.
For the first part of this work - inter-industry trade approach - the database provided by UNCTAD STAT is adopted, which aggregates product groups of SITC Rev.3 into broader product categories. This categorization divides most of products in six categories, according to the factor intensities and degree of manufacturing: Primary commodities, Labour-intensive & resource-intensive manufactures, Low-skill & technology-intensive manufactures, Medium-skill & technology-intensive manufactures, High-Medium-skill & technology-intensive manufactures and unclassified products.4 The latter category will not be used in the analysis.
As the intra-industry trade requires certain degree of disaggregation of product groups and the SITC at 3-digit level is considered the closest classification to the intra-industry trade
3
The Original SITC was drew up in 1950 by the United Nations Secretariat and later the UN’s Economic and Social Council urged “all Governments to make use of this Standard Classification”. From then, SITC has been the “basis for the reporting of trade statistics” worldwide (‘Standard International Trade Classification Revision 3’, 2010).
4
UNCTAD put forward the division of SITC’s product groups into 6 categories in “Trade and Development Report” published in 2002 (Nations, 2002).
7
definition academically, the database of SITC Rev.3 at 3-digit level published by UNCTAD STAT is adopted for the second part of analysis. The industry's disaggregation level here is at 254 product groups.
3.2 Inter-industry trade approach
3.2.1. Analysis strategy
This part analyzes and compares the inter-industrial trade flows by sector between China and the two trading groups. In order to standardize the row trade data, the inter-industry approach adopts the ratio analysis methodology. This methodology captures the weight of each sector’s trade in total trade and bases the comparison analysis on those weights. For example, when comparing one sector’s exports with imports, instead of comparing the exports and imports values themselves, the share of exports of this sector in total exports and the share of imports of this sector in total imports are compared.
I created two research methods for inter-industry trade analysis. The first is to compare exports and imports between China and each group. The second is to compare the exports or imports between China and two groups. Each method includes two indicators with different objectives. Therefore, there are four indicators in total.
To simplify indicators’ expression, the following abbreviations are created and used in the expressions:
Table I
Abbreviation applied in ratios
Terms abbreviation
Exports EX
Imports IM
China c
Each country j Each products category a i
Total exports/imports of 5 sectors t High-income group Hg Low-income group Lg
8
(a) There are 5 product categories here: Primary commodities, Labour-intensive & resource-intensive manufactures, Low-skill & technology-resource-intensive manufactures, Medium-skill & technology-intensive manufactures and High-skill & technology-intensive manufactures.
3.2.2 Four basic variables
The four indicators are constructed on the basis of four variables – Formula (1) to Formula (4).
The first variable captures the average exports share of each sector in total exports from China to the High-income group specifically. It is obtained as follows:
(1) 𝐸𝑋̅̅̅̅𝑖𝑐𝐻𝑔=
∑𝐸𝑋𝑖 𝑐𝑗 𝐸𝑋𝑡𝑐𝑗
20 (i = 1, ..., 5; j = 1, ...., 20)
In this formula, the ratio 𝐸𝑋𝑖 𝑐𝑗
𝐸𝑋𝑡𝑐𝑗 means the share of exports by sector i from China to each high-income country j in total exports from China to that country. In turn, 𝐸𝑋̅̅̅̅𝑖𝑐𝐻𝑔 is the average exports share of sector i from China to the High-income group, calculated by averaging the sum of 20 high-income countries’ ratio values.
The second variable captures the average exports share of each sector in total exports from China to the Low-income group specifically. It is obtained as follows:
(2) 𝐸𝑋̅̅̅̅𝑖𝑐𝐿𝑔= ∑𝐸𝑋𝑖
𝑐𝑗 𝐸𝑋𝑡𝑐𝑗
20 (i = 1, ..., 5; j = 1, ...., 20)
In this formula, the ratio 𝐸𝑋𝑖 𝑐𝑗
𝐸𝑋𝑡𝑐𝑗 means the share of exports by sector i from China to each low-income country j in total exports from China to that country. In turn, 𝐸𝑋̅̅̅̅𝑖𝑐𝐿𝑔 is the average exports share of sector i from China to the Low-income group, calculated by averaging the sum of 20 low-income countries’ ratio values.
9
about the imports flow and are constructed with same logic.
The third variable represents the average imports share of each sector i in total imports of China from the High-income group specifically. It is obtained as follows:
(3) 𝐼𝑀̅̅̅̅𝑖𝑐𝐻𝑔= ∑𝐼𝑀𝑖
𝑐𝑗 𝐼𝑀𝑡𝑐𝑗
20 (i = 1, ..., 5; j = 1, ...., 20) In this formula, the ratio 𝐼𝑀𝑖
𝑐𝑗
𝐼𝑀𝑡𝑐𝑗 means the share of imports by sector i of China from each high-income country j in total imports of China from that country. In turn, 𝐼𝑀̅̅̅̅𝑖𝑐𝐻𝑔is the average imports share of sector i of China from the High-income group, calculated by averaging the sum of 20 high-income countries´ ratio values.
The fourth variable represents the average imports share of each sector i in total imports of China from the Low-income group. It is obtained as follows:
(4) 𝐼𝑀̅̅̅̅𝑖𝑐𝐿𝑔= ∑𝐼𝑀𝑖
𝑐𝑗 𝐼𝑀𝑡𝑐𝑗
20 (i = 1, ..., 5; j = 1, ...., 20) In this formula, ratio 𝐼𝑀𝑖
𝑐𝑗
𝐼𝑀𝑡𝑐𝑗 means the share of imports by sector i of China from each low-income country j in total imports of China from that country. In turn, 𝐼𝑀̅̅̅̅𝑖𝑐𝐿𝑔 is the average imports share of sector i of China from the Low-income group, calculated by averaging the sum of 20 low-income countries´ ratio values.
These four variables (formula (1) to (4)) will be used to calculate the indicators in section below.
3.2.3 Two research methods and four indicators
The first research method focuses on both exports and imports flows that China has with
each group by sector, including two indicators facing each group.
10
(5) 𝐸𝑋𝑖 𝑐𝐻𝑔
𝐼𝑀𝑖𝑐𝐻𝑔 ∈ (0,1) 𝑜𝑟 [1, +∞)
It is the ratio ofexports share by sector i from China to the High-income group (formula (1)) versus imports share by sector i of China from the High-income group (formula (3)). Dividing (1) by (3), the first indicator can detect the trade pattern between China and the High-income group. When the value belongs to the interval (0,1), it means that China exports proportionally less than imports with the High-income group in this sector; if the value is bigger than 1, it means that China exports proportionally more than imports with the High-income group in this sector.5
Similarly, trade indicator with the Low-income group (second indicator) is obtained as below:
(6) 𝐸𝑋𝑖 𝑐𝐿𝑔
𝐼𝑀𝑖𝑐𝐿𝑔 ∈ (0,1) 𝑜𝑟 [1, +∞)
It is the ratio of exports share by sector i from China to the Low-income group (formula (2)) versus imports share by sector i of China from the Low-income group (formula (4)). Dividing (2) by (4), the second indicator can capture the trade pattern between China and the Low-income group. Likewise, if the indicator value is between 0 and 1, it means that China exports proportionally less than imports with the Low-income group in this sector; if the indicator value is bigger than 1, it means that China exports proportionally more than imports with the Low-income group in this sector.
With different research emphasis to the first method, the second method focuses on exports
or imports that China has with two groups, including two indicators focusing different trade
flows.
Exports indicator with two groups (third indicator) is obtained as below: (7) 𝐸𝑋𝑖
𝑐𝐻𝑔
𝐸𝑋𝑖𝑐𝐿𝑔 ∈ (0,1) 𝑜𝑟 [1, +∞)
5
In these four indicators, I disregard the case in which the ratio value is equal to 0, because the numerator is always positive in any ratio according to the trade data.
11
It is the ratio of exports share by sector i from China to the High-income group (formula (1)) versus exports share by sector i from China to the Low-income group (formula (2)). Dividing (1) by (2), the third indicator compares the exports that China has with two groups. When the indicator value is between 0 and 1, it means that China exports proportionally less to the High-income group than to the Low-income group in this sector. When it is bigger than 1, it means that China exports proportionally more to the High-income group than to the Low-income group in this sector.
Similarly, Imports indicator with two groups (fourth indicator) is obtained as below: (8) 𝐼𝑀𝑖
𝑐𝐻𝑔
𝐼𝑀𝑖𝑐𝐿𝑔 ∈ (0,1) 𝑜𝑟 [1, +∞)
It is the ratio of imports share by sector i of China from the High-income group (formula (3)) versus imports share by sector i of China from the Low-income group (formula (4)). Dividing (3) by (4), the fourth indicator can compare the imports that China has with the two groups. With the same logic, if the indicator value is between 0 and 1, it means that China imports proportionally less from the High-income group than from the Low-income group. If it is bigger than 1, it means that China imports proportionally more from the High-income group than from the Low-income group.
In conclusion, the first research method, including the first and second indicators, allows the analysis of trade pattern between China and each group; the second research method, including third and fourth indicators, permits the comparison of exports from China to the two groups or comparison of imports of China from the two groups. Together, these two methods can capture the inter-industrial trade patterns that China has with these two groups. Therefore, the inter-industrial trade analysis will be based on the results of these four indicators.
3.3
Intra-industry trade approach
12
of this approach is to compare the intra-industry trade that China has with the High-income group and the Low-income group.
In this case, the Grubel-Lloyd´s Intra-industrial trade Index (hereafter: GL Index) is applied to capture the intra-industrial trade of China with its trade partners. The Grubel-Lloyd Index is the most widely used indicator to measure the level of intra-industry trade.
The intra-industrial indices between China & the High-income group and between China & the Low-income group are calculated as follows.
Firstly, I calculate the GL index between China and its 40 trade partners by 254 sectors. It is obtained as follows: (9) 𝐺𝐿𝑐𝑗𝑖 =1 - |𝐸𝑋𝑖 𝑐𝑗 – 𝐼𝑀 𝑖 𝑐𝑗| 𝐸𝑋𝑖𝑐𝑗 + 𝐼𝑀𝑖𝑐𝑗
In this formula, |𝐸𝑋𝑖𝑐𝑗− 𝐼𝑀𝑖𝑐𝑗| means the absolute value of the difference of exports from China to each country j and imports of China from that country by sector i, which indicates the inter-industrial trade per sector. 𝐸𝑋𝑖𝑐𝑗+ 𝐼𝑀𝑖𝑐𝑗 means the total trade per sector between China and each country j, because it is the sum of exports from China to each country j and imports of China from that country by sector. So, |𝐸𝑋𝑖
𝑐𝑗
– 𝐼𝑀𝑖𝑐𝑗|
𝐸𝑋𝑖𝑐𝑗 + 𝐼𝑀𝑖𝑐𝑗 indicates the weight of inter-industrial trade by sector i. And the 𝐺𝐿𝑐𝑗𝑖 means the weight of intra-industrial trade by sector i between China and each country, obtained by calculating 1 minus the inter-industrial trade weight.
It varies from 0 to 1. If it equals to 0, China has no intra-industry trade with its trade partner j in sector i. Conversely, if it equals to 1, it means that the total trade in this sector is intra-industry trade. So, the closer to 1 the value is, the bigger the intra-intra-industry trade is.
Secondly, I calculate the total intra-industrial trade indicator between China and every country. As every sector has a different weight in total trade, the weighted average for all the sectors makes more sense. Therefore, the weighted average of all sectors’ GL Index of one country is calculated to represent the total intra-industrial indicator between China and this country.
13
groups. As this work tends to capture the general patterns, the simple arithmetic average of 20 countries’ values can achieve it. Therefore, the intra-industrial trade index between China and the High-income group is calculated by averaging the total GL Index of 20 high-income countries. And the intra-industrial trade index between China and the Low-income group is obtained by averaging the total GL Index of 20 Low-income countries.
4. Results analysis
4.1 Inter-industrial trade results analysis
As mentioned in the methodological part, two research methods are applied here for inter-industrial trade analysis. I will display and discuss the results separately.
4.1.1. First research method – trade indicator with the High-income group/Low-income group
The first research method constructed a trade indicator for each singe group at a time.
4.1.1.1 Trade indicator with the High-income group
(a) Results of Formula (1) and (3)
The Figure 3 below, which is obtained through Formula (1), presents the exports share of each of the five products categories in total Chinese exports to the High-income group.
14
Figure 3 - Average exports share of five product categories from China to the High-income group - Formula (1) results
Source: UNCTAD and author’s calculations.
In turn, Figure 4 below, which is obtained through Formula (3), presents the imports share of each of the five products categories in total Chinese imports from the High-income group.
Figure 4 - Average imports shareof five product categories of China from the High-income group – Formula (3) results
Source: UNCTAD and author’s calculations.
5.31% 25.65% 10.03% 26.37% 32.53% Primary commodities/Total Labour-intensive & resource-intensive manufactures/Total Low-skill & technology-intensive manufactures/Total Medium-skill & technology-intensive manufactures/Total High-skill & technology-intensive manufactures/Total 32.89% 3.50% 3.67% 25.10% 34.77% Primary commodities/Total
Labour-intensive & resource-intensive manufactures/Total Low-skill & technology-intensive manufactures/Total Medium-skill & technology-intensive manufactures/Total High-skill & technology-intensive manufactures/Total
15
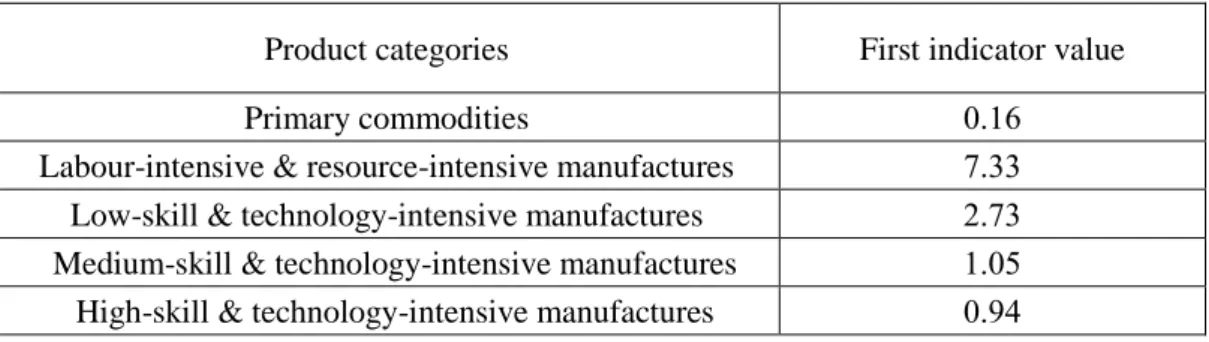
(b) Results of the first indicator
The first indicator is obtained by dividing formula (1) by formula (3). It analyzes the trade flows between China and High-income countries, in five product groups. The results are showed in Table II below.
Table II
First research method – trade indicator results with the High-income group Product categories First indicator value Primary commodities 0.16
Labour-intensive & resource-intensive manufactures 7.33 Low-skill & technology-intensive manufactures 2.73 Medium-skill & technology-intensive manufactures 1.05 High-skill & technology-intensive manufactures 0.94 Source: UNCTAD and author’s calculations.
As far as the first product category “Primary commodities”6 as concerned, the indicator
value is 0.16, according to Table II. As it is between 0 and 1, it means that China exports proportionally less than imports primary commodities with the High-income Group. More specifically, the value 0.16 means that in primary commodities, the exports proportion (in total exports) from China to the High-income group, is 16% of imports proportion of China from the High-income group. This shows that China is a big net importer of primary commodities from High-income countries.
In regard to the other four remaining manufactures categories, the first two indicators (Labour-intensive & resource-intensive and Low-skill & technology-intensive manufactures) are both bigger than 1, meaning that China exports proportionally more than imports with the High-income group in these two product categories. And the last two indicators (Medium- and High-skill & technology-intensive manufactures) are both close to 1, showing that the exports and imports proportions of China with the High-income group are similar in these two product
6
Primary commodities include food and live animals; beverages and tobacco; inedible crude materials; mineral fuels; oils, fats and waxes; non-ferrous metals, precious stones etc. (SITC 0 + 1 + 2 + 3 + 4 + 68 + 667+ 971).
16
categories.
(c) Interpretation of the results:
i) For the massive imports of primary commodities of China from the High-income group, I can devise an ad hoc explanation, (no need to use the international trade theories). Industry is a sector that consumes a lot of resources. According to the data of 2016 published by World Bank, in China the percentage of industry’s value added in GDP is 39.88%, while the average of the same percentage for those 20 high-income countries’ is 23.82%. That is, China has a much larger weight of industry in its economy than the high-income countries and this generates more demand for raw materials. Therefore, China needs more resources than it has, importing from the High-income Group. By contrast, the service sector of the High-income countries is the pillar of their economies and thus need less resources than they own, exporting them to China.
ii) The massive exports of Labour-intensive & resource-intensive manufactures7
from China to the High-income group can be interpreted using Ricardo’s theory.
In Ricardo’s comparative advantage theory, there would have a joint gain if one country exports the products in which it has comparative advantages and imports goods in which it has comparative disadvantages. The comparative advantage of goods can be determined by its unit cost of production. And the unit cost depends not only on the labour productivity, but also on the wage.
According to the International Labour Organization (ILO), China´s labour productivity in 2016 is $26001.60 (in constant 2011 international PPP $). In turn, the mean labor productivity of the High-income group is $92659.25 (see Table III). That means that the labour productivity of the High-income group is 3.56 times that of China.
Table III
Labour productivity -- ILO modelled estimates, 2016
7
Labour-intensive & resource-intensive manufactures are characterized by clothing, textile fabrics, footwear, bags, construction materials, wood manufacture, mineral manufactures, etc.
17
Output per worker
(GDP constant 2011 international $ in PPP) High-income group 92659.25 a
Low-income group 4203.05
China 26001.60
(a) The arithmetic average of 20 high-income/low-income countries’ data is calculated to represent the High-income group/Low-income group.
Source: ILO and author’s calculations.
Still according to the ILO, the minimum wage of China in 2013 (last year available) is $226 (in constant 2011 PPP $), while the minimum wage of the High-income group is $1422.07 (see Table IV). Therefore, the minimum wage of the High-income group is six times more than the wage of China. 8
Table IV
High-income, Low-income groups and China’ Statutory nominal gross monthly minimum wage in 2016 (or last year available)a
Monthly minimum wage (in constant 2011 PPP $) High-income group (13)b
1422.07 c
Low-income group (15) 62.47
China 226.00
(a) If any country doesn't have data of 2016, the data of last year available is used.
(b) Between 20 high-income countries, 13 countries' data are available and between 20 low-income countries, 15 countries' data are available.
(c) The arithmetic average of 13/15 available data is calculated to represent the High-income group/Low-income group.
Source: ILO and author’s calculations.
Thus, the high-income group’s labour is 3.56 times more productive and 6.29 times more expensive than Chinese labour. So, even though Chinese labour is 3.56 times less productive
8
The minimum wage is applied as labour cost indicator here because other indicators for example hourly earnings, average monthly/yearly earnings don´t have data for the low-income countries analyzed.
18
than High-income countries, this is more than offset by labour 6 times cheaper. So, Ricardo´s theory can explain well the trade pattern of this sector: China has lower unit costs of producing labour-intensive products than high-income countries, and thus exports their products.
iii) The interpretation of the results obtained for the other three sectors will be made using the Heckscher-Ohlin theory.
As far as Low-skill & technology-intensive manufactures9 as concerned, in 2016 China
exports proportionally 2.73 times more than imports with the High-income group.
The educational attainment can be used as a proxy to represent different skill levels: primary education corresponds to low-skilled workers, upper secondary education corresponds to medium-skilled workers and higher-education corresponds high-skilled workers.
According to UNESCO, in China the percentage of population above 24 years old with only primary education is equal to 28.09. In the High-income group, the average percentage of population with only primary education is only 8.28. So, the population share with primary education in China is 3.39 times more than it in the High-income group. Because China is relatively more abundant in low-skill workers than the High-income group, according to the Heckscher-Ohlin theory, it should specialize in low-skill manufactures and exports them to the High-income group.
Table V
Share of population by educational attainment, population 25 years and older, last year availablea Primary (%) Upper secondary (%) Higher-educational (%) High-income group 8.28c 35.59 27.41 Low-income group (18)b 12.49 4.68 2.80 China 28.09 13.50 3.58 9
Low-skill & technology-intensive manufactures contain goods like iron, steel, household equipment, motorcycles, trailers, railway vehicles, ships, office and stationery supplies, etc.
19
(a) The data of last year available is adopted here as there isn’t one reference year with majority of data.
(b) 18 low-income countries have data available, except Democratic People's Republic of Korea and Madagascar.
(c) The arithmetic average of 20/18 available data is calculated to represent the High-income/Low-income group.
Source: The United Nations Educational, Scientific and Cultural Organization (UNESCO) and the author’s calculation.
Finally, concerning the fourth and fifth categories – Medium-10 and High-11 skill &
technology intensive manufactures, the exports and imports shares of China with the High-income group are similar in these two product categories, as already mentioned.
The High-income group´s population shares with Upper secondary and Higher-education are respectively 2.64 and 7.66 times higher than China (see table V), which means that High-income countries are relatively more abundant in middle and high skilled workers than China. However, the trade results cannot reflect this advantage and thus cannot be explained by the Heckscher-Ohlin theory.
Now, these two sectors also require a lot of middle and high technology input. To represent the technology endowment of each country, this paper adopts the indicator - R&D expenditure as a percentage of GDP. According to UNESCO, in 2016, the percentage of R&D expenditure in GDP of China is 2.11%, which is close to the average percentage of High-income countries 2.38% (see Table VI). Hence, high-income countries and China are both abundant in technology and therefore – according to the Heckscher-Ohlin theory, they should both export the technology- intensive manufacture, which is what the results show.
Table VI
10
Medium-skill & technology intensive manufactures are comprised of electronics like household type equipment, articles of rubber, engines & motors, agricultural machinery, civil engineering plant & equipment, other machinery, motor vehicles, etc.
11
High-skill & technology-intensive manufactures include electronics such as office machines, television and radio-broadcast, chemical products like hydrocarbons, carboxylic acids and metallic salts, medicaments, cosmetics, aircraft, photographic apparatus, musical instruments, arms, etc.
20
Gross domestic expenditure on R&D (GERD) as a percentage of GDP, 2016 or last year availablea
GERD % High-income group 2.38c
Low-income group (11)b 0.31
China 2.11
(a) If any country doesn't have data of 2016, the data of last year available is used. (b) Between 20 low-income countries, 11 countries have data available.
(c) The arithmetic average of 20/11 available data is calculated to represent the High-income/Low-income group.
Source: UNESCO and the author’s calculation.
4.1.1.2 Trade indicator with the Low-income group
(a) Results of Formula (2) and (4)
The figure 5 below, which is obtained through Formula (2), presents the exports share of each of the five products categories in total Chinese exports to the Low-income group.
Figure 5 - Average exports share of five product categories from China to the Low-income group - Formula (2) results
Source: UNCTAD and the author’s calculation.
In turn, Figure 6 below, which is obtained through Formula (4), presents the imports share of each of the five products categories in total Chinese imports from the Low-income group.
7.14%
32.32%
19.29% 24.57%
16.65% Primary commodities/Total
Labour-intensive & resource-intensive manufactures/Total Low-skill & technology-intensive manufactures/Total Medium-skill & technology-intensive manufactures/Total High-skill & technology-intensive manufactures/Total
21
Figure 6 - Average imports share of five product categories of China from the Low-income group – Formula (4) results
Source: UNCTAD and the author’s calculation.
(b) Results of the second indicator
The second indicator is obtained by dividing Formula (2) by Formula (4). It analyzes the trade flows between China and the Low-income group, in five product groups. The results are showed below:
Table VII
First research method – trade indicator results with the Low-income group Product categories Second indicator value Primary commodities 0.09
Labour-intensive & resource-intensive manufactures 4.07 Low-skill & technology-intensive manufactures 6.88 Medium-skill & technology-intensive manufactures 62.24
High-skill & technology-intensive manufactures 3.51 Source: UNCTAD and the author’s calculation.
First of all, the indicator’s value about primary commodities is 0.09, lower than 1, meaning that proportionally China exports primary commodities much less than it imports them from the Low-income group.
83.29% 7.94%
2.80%0.39%
4.74%
Primary commodities/Total Labour-intensive & resource-intensive manufactures/Total Low-skill & technology-intensive manufactures/Total Medium-skill & technology-intensive manufactures/Total High-skill & technology-intensive manufactures/Total
22
Conversely, in all manufacture’s categories, the indicator values are all bigger than 1, showing that proportionally China exports more each of those four products categories than it imports them from the low-income group.
There is a clear pattern in this bilateral trade: China exports manufactures to the low-income group and imports raw material from that group.
(c) Interpretation of the results
i) The predominance of imports of primary commodities from the Low-income group can be explained by the huge demand of China for raw-materials and by the incipient industries of Low-income countries. As previously explained, China has huge demand for raw materials due to the large proportion of industry in its national economy. According to the same database of World Bank, the average percentage of industry’s added value in GDP of 20 low-income countries is 21.85, while the percentage of China is 39.88. Furthermore, the percentage of the Low-income group owes much to its mining industry. Still, the supply of raw-materials in the Low-income group exceeds the need of their domestic industries, so, these countries end up exporting the excessive raw materials to China.
ii) Concerning labour-intensive & resource-intensive manufactures, the indicator value is 4.07, which means that China exports proportionally four times more than it imports this kind of manufactures. So, is Ricardo’s theory also applicable to this phenomenon?
As illustrated in the Table III, the output per worker of the Low-income group and China are respectively $4203.05 and $26001.60. In addition, the monthly minimum wage of the Low-income group and China are respectively $62.47 and $226.00, exhibited in the Table IV.
That is, the Chinese labour is 6.19 times more productive than the Low-income group’s labour and at the same time, the labour cost in China is only 3.6 times higher than in the Low-income group. So, even though Chinese labour is 3.6 times more expensive than labour of the Low-income group, it is more than offset by labour 6 times more productive. In line with Ricardo’s theory, China has comparative advantages in labour-intensive goods facing the
Low-23
income group, and it is favorable for China if it exports labour-intensive manufactures, which is accordant with the results.
iii) For the trade results of the other three sectors, this paper will check if Heckscher-Ohlin theory is explicable.
As for low-skill & technology-intensive manufactures, China exports proportionally 6.88 times more than imports with the Low-income group. According to table V, the population share with primary education in China is 2.25 times higher than in the Low-income group. Therefore, China is more abundant in low-skill workers compared to the Low-income group and effectively exports low-skill intensive manufactures, which is consistent with Heckscher-Ohlin theory.
The most eye-catching result in Table VII is the indicator value about medium-skill & technology-intensive manufactures. China exports proportionally 62.24 times more than imports with the Low-income group in this product category.
According to Table V, the population share with upper secondary education in China is 2.88 times higher than it in the Low-income group. Moreover, the expenditure on R&D as a percentage of GDP of China is 6.8 times more than the Low-income group (see Table VI). Therefore, the results can be explained by Heckscher-Ohlin theory: China is more abundant in medium-skill workers and technology and exports medium-skill & technology-intensive manufactures.
The fact that this value is so relevant is related to the small denominator of the second indicator in medium-skill & technology-intensive manufactures. The second indicator is obtained by dividing formula (2) by formula (4). In this sector, the numerator – the exports share from China to the Low-income group - is 24.57% (see Figure 5), whereas the denominator – the imports share of China from the Low-income group in this category- is only 0.39% (see Figure 6).
24
Regarding the High-skill & technology-intensive manufactures, China exports proportionally 3.51 times more than it imports from the Low-income group. Looking at their high-skill workers situation, the population shares with Higher-education of China and Low-income countries are 3.58% and 2.80% (see Table V). Besides, the percentages of R&D expenditure in GDP of China and the Low-income group are 2.11% and 0.31% (see Table VI). Comparing with low-income countries, China is not only more abundant in high-skill workers but also has more investment in R&D. Therefore, China exports high-skill & technology-intensive manufactures to low-income countries in accordance with Heckscher-Ohlin theory.
In sum, about the results of first indicator, the Ricardo’s comparative advantage theory can explain the Chinese exports surplus in Labour-intensive & resource-intensive manufactures and the Heckscher-Ohlin theory can explain the Chinese exports surplus in Low-skill & technology-intensive manufactures.
For the trade results of Medium- and High- skill & technology-intensive manufactures, the differences in skilled worker’s endowment between China and the High-income group don’t really support the results. However, their similar technology investment can explain their mutual exports in these two product categories.
About the results of second indicator, the Ricardo’s theory can explain the Chinese exports surplus in Labour-intensive & resource-intensive manufactures and the Heckscher-Ohlin theory is able to explain the Chinese exports surplus in other three manufactures categories.
4.1.2. Second research method – exports/imports indicator with two income groups
The second research has a different focus to the firstone. When previously, the center is the trade analysis between China and one separate group, the present research centers on the exports flows from China to the two income groups or the imports flows of China from the two income groups. It includes exports and imports indicator, expressed respectively by third indicator and fourth indicator.
25
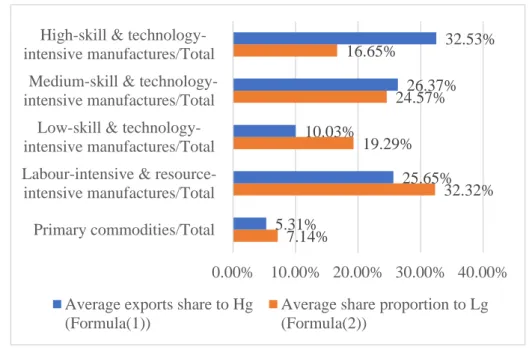
4.1.2.1. Exports indicator with two groups (a) Results of Formula (1) and (2)
The Figure 7 below shows visually the results of Formula (1) and (2) and permits a straight comparison of the same.
Figure 7 - Average exports share from China to the High-income and Low-income groups Source: UNCTAD and the author’s calculation.
(b) Results of the third indicator
The exports indicator is obtained by dividing Formula (1) by Formula (2). It captures the exports pattern that China has with the High-income and Low-income groups, structured in five categories. The results are showed in Table VIII below:
Table VIII
Second research method – exports indicator with two income groups Product categories Third indicator value Primary commodities 0.74
Labour-intensive & resource-intensive manufactures 0.76 Low-skill & technology-intensive manufactures 0.52 Medium-skill & technology-intensive manufactures 1.07 High-skill & technology-intensive manufactures 1.95 Source: UNCTAD and the author’s calculation.
7.14% 32.32% 19.29% 24.57% 16.65% 5.31% 25.65% 10.03% 26.37% 32.53% 0.00% 10.00% 20.00% 30.00% 40.00% Primary commodities/Total Labour-intensive & resource-intensive manufactures/Total
Low-skill & technology-intensive manufactures/Total Medium-skill & technology-intensive manufactures/Total High-skill & technology-intensive manufactures/Total
Average exports share to Hg (Formula(1))
Average share proportion to Lg (Formula(2))
26
As concerns primary commodities, the indicator value denotes that China exports proportionally less to the High-income group than to the Low-income group.
In fact, China’s primary commodities exports only accounts for a small fraction in the total Chinese exports. The average exports shares to the High-income group and Low-income group are only 5.30% and 7.14% (See Figure 7). Previously, the first research method part already showed that China is a big importer of primary commodities.
As for Labour-intensive & resource-intensive manufactures and Low-skill & technology-intensive manufactures, the indicator values are 0.76 and 0.52. They are both smaller than 1, meaning that China exports proportionally less to the High-income group than to the Low-income group in these two product categories.
This tendency reverses when it comes to Medium- and High- skill & technology-intensive manufactures. The indicator values for these two classifications are 1.07 and 1.95. They are both greater than 1 and show an ascending trend along with the skill and technology level. Therefore, China exports proportionally more to the High-income group than to the Low-income group in these two product categories.
(c) Interpretation of the results
Linder put forward the following theory: the more elevated income level per capital of a country is, the more sophisticated the goods consumed by its national consumers are. Here, the High-income group consists of 20 countries with per capita income above $12735 and the Low-income group covers 20 countries with per capita Low-income under $1045. The huge Low-income difference can be the origin of the trade pattern observed above: the High-income group has more demand for more sophisticated products thus importing more Medium- and High- skill & technology intensive manufactures from China. The Low-income group tends to consume less sophisticated goods thus importing more Labour & resource-intensive and Low-skill & technology intensive manufactures. Here the Primary commodities are not included in the analysis, because Linder Theory focus only on the trade of manufactured goods.
27
4.1.2.2. Imports indicator with two groups (a) Results of Formula (3) and (4)
The Figure 8 below shows visually the results of Formula (3) and (4) and allows a straight comparison of them.
Figure 8 - Average imports share of China from the High-income and Low-income groups Source: UNCTAD and the author’s calculation.
(b) Results of the fourth indicator
The last indicator is obtained by dividing Formula (3) by Formula (4). It describes and compares the Chinese imports from the High-income and Low-income groups, divided in five product categories. The indicator results are showed in Table IX below:
Table IX
Second research method – imports indicator with two income groups Product categories Fourth indicator value Primary commodities 0.39
Labour-intensive & resource-intensive manufactures 0.44 Low-skill & technology-intensive manufactures 1.31 Medium-skill & technology-intensive manufactures 63.58
83.29% 7.94% 2.80% 0.39% 4.74% 32.89% 3.50% 3.67% 25.10% 34.77% 0.00% 30.00% 60.00% 90.00% Primary commodities/Total Labour-intensive & resource-intensive manufactures/Total Low-skill & technology-intensive
manufactures/Total
Medium-skill & technology-intensive manufactures/Total High-skill & technology-intensive
manufactures/Total
Average imports share from Hg (Formula (3))
Average imports share from Lg (Formula(4))
28
High-skill & technology-intensive manufactures 7.34 Source: UNCTAD and the author’s calculation.
The indicator values of Primary commodities and Labour-intensive & resource-intensive manufactures are 0.39 and 0.44, meaning that China imports proportionally more products from Low-income countries than from High-income countries in these two categories.
However, the remainder three indicator values are respectively 1.31, 63.57 and 7.34, all greater than 1, which means that China imports proportionally more Low-, Medium- and High-skill & technology-intensive manufactures from the High-income group than from the Low-income group.
With the same logic, the fact that the indicator value for Medium-skill & technology-intensive manufactures (63.57) is so considerable, is related to the minimum denominator value of the fourth indicator - the imports proportion of China from the Low-income group in this category is only 0.39%.
These results show that the major imports of China from the two groups are very different: the imports of China from Low-income countries predominantly focus on primary commodities. Nevertheless, the imports from High-income countries center on Primary commodities, Medium- and High- skill & technology-intensive manufactures.
All these features were already analyzed in the first research method part. So, they won’t be repeated here.
In conclusion, the Linder theory can explain the patterns revealed by the third indicator’s results. And in the imports indicator part, it is detected that the main imports of China from these two groups have very different focus.
4.2
Intra-industry trade results analysis
4.2.1. Intra-industrial trade between China and two income groups
29
China and two income groups are calculated and shown in the following table: Table X
Grubel-Lloyd´s Intra-industrial trade Indicator between China and two income groups High-income Group Low-income Group
GL Index value 0.24 0.01 Source: UNCTAD and the author’s calculation.
For the huge difference of intra-industrial trade results of China and two income groups, I can devise an explanation based on the previous industrial trade results. As the inter-industrial trade results show, the main imports of China from the Low-income group are primary commodities and the main exports from China to Low-income countries are manufactures, which are not overlapped. Thus, the possibility of trading the same product is much lower.
On the other hand, the 20 high-income countries are all industrialized developed countries and their exports of manufactures to China weigh more than 60%. Likewise, the manufacture exports from China to the High-income group are also predominant in its total exports to high-income countries. Therefore, the mutual exports of manufactures make possible the intra-industrial trade of manufactures between them.
4.2.2. Intra-industrial trade by sector between China and two income groups
The intra-industrial trade indicators between China and two income groups in primary commodities and in manufactures are calculated separately. Here are the results:
Table XI
Grubel-Lloyd´s Intra-industrial trade Indicator by sector between China and two income groups Sector High-income group Low-income group Primary commodities 0.16 0.009 Manufactures 0.27 0.011 Source: UNCTAD and the author’s calculation
30
According to the results, whether in trade with the High-income group or with the Low-income group, the intra-industrial trade indicator in manufactures is higher than in primary commodities.
Furthermore, the industrial trade indicators in manufactures are closer to the global intra-industrial trade indicators, showing their greater impact on the global indicator. For example, the GL indicator between China and the High-income group in manufactures is 0.27 and the global GL indicator between China and the High-income group is 0.24.
These results can be explained by Krugman’s intra-industrial trade theory. According to it, the consumers’ preference for variety and the international firms’ dumping behavior play important roles in promoting intra-industrial trade.
Regarding the product attributes, primary commodities are homogeneous while manufactures are heterogeneous. That is, manufactures in the same category can have different peculiarities. For example, iPhone and Huawei are the leading and influential brands in the mobile phones market and have their own client base all over the world. In terms of the product classification, they both belong to telecommunication equipment, therefore, the exchange of them belong to intra-industrial trade. These two brands have own specificities related to appearance, storage space, headphones device, and even brand value, etc. and these features can develop the consumers’ consuming habits and loyalty, attract and maintain clients. At the same time, they are also substitutes, which makes that the clients of Huawei can be attracted by iPhone’s product and vice versa.
By contrast, primary commodities such as agricultural products, livestock and minerals, don`t have so many specificities.
In sum, clients’ preference for variety and the diversification of manufactured goods can support that the main intra-industrial trade happens in manufactured goods.
For companies to be able to dump, they must have the power to set the prices of their products. For example, when iPhone launches its new cellphone models, the domestic prices
31
and prices for other countries of each model are chosen by Apple. By contrast, the international price of primary commodities is essentially determined by the supply-demand relationship that takes place in commodities exchanges. So, the primary commodities producers don´t have power to set their price and therefore are unable to make dumping.
Nevertheless, the difference between primary commodities’ and manufactures’ GL indicators is not so big. The intra-industrial trade in commodities between China and the High-income group is also relevant – 0.16.
Grubel and Lloyd provided some reasons for intra-industrial trade in commodities: first, the seasonal characteristics of agricultural products can explain why one country exports and imports the same agriculture product - because it exports in its harvest seasons and imports in other countries' harvest time; the second reason is related to the transport cost. If one commodity has a high transport cost and a country has a relatively large land, even the south of the country produces this product, the north of this country may import it from its neighboring country other than buying from the south, because the shorter distance could allow a lower trade cost (Grubel and Lloyd, 1975).
From the results above, it is concluded that China has much more intra-industry trade with High-income countries than with Low-income countries and that the intra-industrial trade of manufactured goods is more significant than that of primary commodities regardless of trade partners.
5. Conclusion
This thesis was developed to answer the following question: what is the trade pattern of China with two distinct trade partners - developed & high-income countries and developing &low-income countries?
First, the results show that China has a comparative advantage in labour-intensive manufactures in relation not only to high-income countries, but also in relation to low-income
32
countries.
Second, there is a two-way trade in middle- and high- skill & technology-intensive manufactures between China and the High-income group.
Third, in relation to the trade between China and the Low-income group, there is a clear trend that China exports manufactures to the Low-income group and import commodities from that group.
Fourth, China exports more sophisticated goods to high-income countries and exports less sophisticated goods to low-income countries and this can be explained by Linder theory.
Fifth, China has much more intra-industrial trade with high-income countries than with low-income countries, and has more intra-industrial trade in manufactures than commodities regardless of the trade partners.
In general, during the results analysis process, the international trade theories were able to explain the majority of the trade patterns just numerated. However, some results do not square with the theories, which can be a very interesting study topic in the future. Besides, this paper only focuses on the merchandise trade. In fact, China’s services trade is also a very curious research subject. For instance, in 2017 the Chinese service imports are twice the size of Chinese service exports. The service trade analysis can be a continuous and complementary study to this work.
33
Bibliography
Brander, J. A. and Krugman, P. (1983) ‘A “Reciprocal Dumping” Model of International Trade’, NBER Working Series.
Dennis, A. and Alfred, F. (2001) International economics. 4th edn. Boston, Mass.: McGraw-Hill/Irwin. Available at: https://trove.nla.gov.au/work/8267456?q&versionId=166785898. Group, W. B. (2018) World Bank Country and Lending Groups. Available at:
https://datahelpdesk.worldbank.org/knowledgebase/articles/906519.
Grubel, H. G. and Lloyd, P. J. (1975) ‘Intra-Industry Trade: The Theory and Measurement of International Trade in Differentiated Products.’, The Economic Journal. doi:
10.2307/2230917.
Heckscher, E. (1919) ‘The Effect of Foreign Trade on the Distribution of Income.’,
Ekonomisk Tidskrift.
Krugman, P. R. (1979) ‘Increasing returns, monopolistic competition, and international trade’,
Journal of International Economics. doi: 10.1016/0022-1996(79)90017-5.
Ricardo, D. (1817) ‘Principles of Political Economy and Taxation’, History of Economic
Thought Books. doi: 10.2307/2593726.
‘Standard International Trade Classification Revision 3’ (2010) International Trade by