Caveolin-1–mediated internalization of the
vitamin C transporter SVCT2 in microglia triggers
an inflammatory phenotype
Camila C. Portugal,1*† Renato Socodato,1† Teresa Canedo,1 Cátia M. Silva,1 Tânia Martins,2,3 Vivian S. M. Coreixas,2,4 Erick C. Loiola,2,4 Burkhard Gess,5,6 Dominik Röhr,5 Ana R. Santiago,2,3 Peter Young,5 Richard D. Minshall,7 Roberto Paes-de-Carvalho,4 António F. Ambrósio,2,3 João B. Relvas1*
1Instituto de Investigação e Inovação em Saúde and Instituto de Biologia Moleculare Celular (IBMC), Universidade do Porto, Rua Alfredo Allen, 208 4200-135 Porto, Portugal. 2Institute for Biomedical Imaging and Life Sciences (IBILI), Faculty of Medicine, University of Coimbra, Health Sciences Campus, Azinhaga Santa Comba, 3000-548 Coimbra, Portugal. 3Center for Neuroscience and Cell Biology, Institute for Biomedical Imaging and Life Sciences (CNC.IBILI) Consortium, University of Coimbra, Coimbra, Portugal. 4Department of Neurobiology and Program of Neurosciences, Institute of Biology, Fluminense Federal University, Rua Outeiro São João Batista, 24020-971 Niterói, Rio de Janeiro, Brazil. 5Department of Neurology, University of Muenster, 48149 Muenster, Germany. 6Department of Neurology, RWTH Aachen University, Pauwelstrasse 30, 52074 Aachen, Germany. 7Department of Pharmacology and Center for Lung and Vascular Biology and Department of Anesthesiology, University of Illinois College of Medicine, Chicago, IL 60612, USA.
*Corresponding author. Email: [email protected] (J.B.R.); [email protected] (C.C.P.) †These authors contributed equally to this work.
Originally published in Science Signaling 10, eaal2005, March 28, 2017. DOI: 10.1126/scisignal.aal2005
Vitamin C is essential for the development and function of the central nervous system (CNS). The plasma membrane sodium–vitamin C cotransporter 2 (SVCT2) is the primary mediator of vitamin C uptake in neurons. SVCT2 specifically transports ascorbate, the reduced form of vitamin C, which acts as a reducing agent. We demonstrated that ascorbate uptake through SVCT2 was critical for the homeostasis of microglia, the resident myeloid cells of the CNS that are essential for proper functioning of the nervous tissue. We found that depletion of SVCT2 from the plasma membrane triggered a proinflammatory phenotype in microglia and resulted in microglia activation. Src-mediated phosphorylation of caveolin-1 on Tyr14 in microglia induced the internalization of SVCT2. Ascorbate treatment, SVCT2 overexpression, or blocking SVCT2 internalization prevented the activation of microglia. Overall, our work demonstrates the importance of the ascorbate transport system for microglial homeostasis and hints that dysregulation of ascorbate transport might play a role in neurological disorders.
Introduction
Vitamin C is one of the most important low–molecular weight antioxidants in the body (1). Most mammals can synthesize vitamin C in the liver, but some primates, including humans, have lost this capacity because of the accumulation of random mutations disrupting the gene encoding L-gulono-g-lactone oxidase (Gulo), the enzyme responsible for catalyzing the last step in vitamin C biosynthesis (2). Because of this incapacity, those animals must obtain ascorbate from their diet.
Vitamin C is present in high concentrations in the central nervous system (CNS) and is important for brain homeostasis (3), for the maturation of the glutamatergic system in hippocampal neurons (4), and for GABAergic neurotransmission (5), in addition to acting as an enzymatic cofactor in the conversion of dopamine into norepinephrine (6). Vitamin C is found in two forms in living tissues: the oxidized form, dehydroascorbate (DHA), and the reduced form, ascorbate. Whereas glucose transporters (GLUTs) mediate the facilitated transport of DHA into cells (7–9), sodium–vitamin C cotransporters (SVCTs) transport ascorbate in a sodium-dependent manner (10–12). SVCT2 is highly conserved across vertebrates, with human SVCT2 exhibiting 95 to 98% identity with the homologous proteins from rat, mouse, and rabbit (13). The activity and abundance of this transporter can be regulated by several signaling mechanisms, including direct phosphorylation of SVCT2 by protein kinase A (14) or protein kinase C (11, 15) and transcriptional regulation of the gene encoding SVCT2 (SLC23A2) by nitric oxide (NO)–cyclic guanosine 3′,5′-monophosphate (CMG)–protein kinase G (PKG)–nuclear factor kB (NF-kB) signaling (16, 17). The importance of SVCT2 in the CNS is illustrated by the severe phenotype of homozygous null mice (SVCT2−/−), which show extensive brain hemorrhage, have almost no ascorbate in their brains, and die shortly after birth (18).
In humans, reduced abundance of ascorbate in the brain can lead to neuropsychiatric scurvy (19), which is characterized by depression, alterations in the subcortical basal motor nuclei, and changes in mood, behavior, and motor performance. Changes in the abundance of ascorbate in the brain are also involved in neurodegenerative and neurodevelopmental disorders. For example, heterozygosity for a null allele of Slc23a2 (Slc23a2+/−) reduces the abundance of ascorbate in the CNS and increases the deposition of b-amyloid plaques in a mouse model of Alzheimer’s disease (APP/PSEN1) (20). Ascorbate treatment not only reverses some of the cognitive deficits in APP/PSEN1 or in APP/PSEN1/Gulo−/− Alzheimer’s disease models (21, 22) but also reduces amyloid plaque burden in the brains of 5XFAD/Gulo−/− mice (23). In addition, abnormal ascorbate transport (24, 25) is linked to the motor dysfunction observed in the R6/2 transgenic mouse model of Huntington’s disease (24). As a result, the regulation of ascorbate abundance is considered a potential therapeutic treatment for these neurodegenerative disorders (26).
Microglia, the resident innate immune cells of the CNS, are distinct from peripheral circulating monocytes and other macrophages (27). Surveilling microglia have highly branched cellular processes that are used to probe the CNS parenchyma, monitor the functioning of synapses, and control neuronal connectivity (28). After CNS injuries, the microglia become reactive. They retract their processes, assume an amoeboid cell morphology, become migratory, proliferate, and phagocytose cell debris and damaged neurons (29). Concomitantly, reactive microglia increase the production of various inflammatory factors such as cytokines, chemokines, glutamate, and reactive oxygen species (ROS) (30, 31). Although such changes in the microglia have a clear role in tissue repair, chronic dysregulation of microglia activation can lead to neurodegeneration and is commonly observed in several distinct neuropathologies (32, 33). Understanding the mechanisms that control the phenotype of microglia in health and disease is therefore of paramount importance.
Here, we demonstrated essential functions for SVCT2 and ascorbate in microglial physiology. Reducing the abundance of SVCT2 on the cell surface was necessary and sufficient to initiate proinflammatory microglia activation. We also revealed that proinflammatory stimuli induced SVCT2 internalization in microglia through the assembly of a c-Src–caveolin-1 (Cav-1) signaling complex, followed by internalization and lysosome-dependent proteolysis of SVCT2. In addition, SVCT2 overexpression or blockade of its internalization prevented microglia activation.
Results
SVCT2 is active in the plasma membrane of microglia
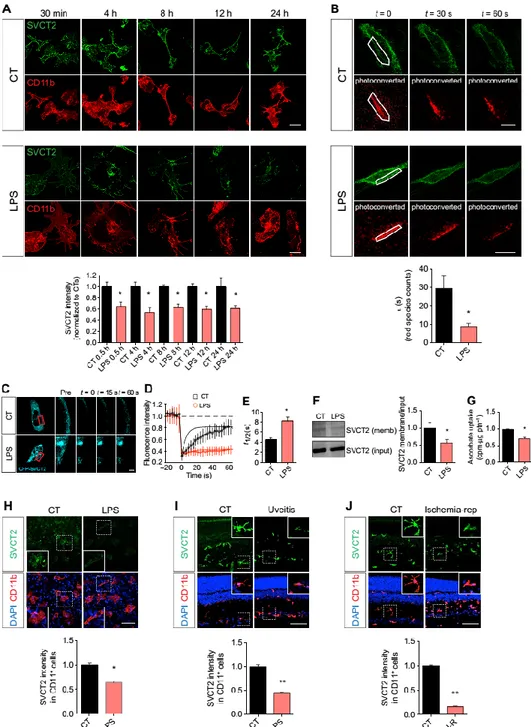
SVCT2 is thought to be the main ascorbate transporter in the CNS (10). Using antibodies that recognize SVCT2 and the microglial cell marker CD11b, we found SVCT2 to be present in rat primary retinal microglia (Fig. 1A), in CD11b+ microglial cells in human retinal organotypic
cultures from postmortem eyes (Fig. 1B), and in CD11b+ microglial cells in sectioned rat retina
(Fig. 1C). We also detected SVCT2 by Western blot analysis of lysates from rat retinas and N9 microglial cells, an immortalized murine cell line (Fig. 1D). After biotinylation of cell surface proteins on mouse retinas and N9 microglia, SVCT2 was present in the biotinylated fraction of cell lysates, demonstrating that SVCT2 localized to the plasma membrane in these cells (Fig. 1E). To characterize the dynamics of SVCT2 in the plasma membrane of microglia, we performed fluorescence recovery after photobleaching (FRAP) assays in the CHME3 microglial cell line expressing cyan fluorescent protein (CFP)–tagged SVCT2 (CFP-SVCT2). FRAP analysis at the plasma membrane of living CHME3 microglia revealed that SVCT2 displayed high mobility with only a minor immobile fraction (Fig. 1F), suggesting that under steady-state conditions, SVCT2 was free to laterally diffuse within the microglial plasma membrane. To determine whether SVCT2 was active in the plasma membrane of microglia, we performed kinetic analysis of ascorbate transport in N9 microglia using the Michaelis-Menten nonlinear regression and the Eadie-Hofstee transformation. We observed a curvilinear plot, indicating the existence of two kinetic components for ascorbate uptake: one component with high affinity and another with low affinity (Fig. 1, G and H). Collectively, these data show that SVCT2 was present and active in the plasma membrane of microglial cells.
Microglia activation induces SVCT2 internalization
Microglia respond to damage to the CNS parenchyma by switching to an activated phenotype with inflammatory properties (34). Such transformation is associated with modification of microglia morphology, phenotype, and function (32) and can also be triggered by exposure to bacterial lipopolysaccharide (LPS). Using an antibody that recognizes the extracellular domain of SVCT2, we detected a substantial and sustained reduction of SVCT2 at the plasma membrane as early as 30 min after treating nonpermeabilized primary rat microglia with LPS (Fig. 2A). We also conjugated the fluorescent highlighter mEos3.2 (35) to the N terminus of SVCT2 and performed photoconversion assays in the plasma membrane of living microglia exposed to LPS. One brief pulse with an ultraviolet laser was sufficient to photoconvert many mEos-SVCT2 molecules into the red species in CHME3 microglia (fig. S1). SVCT2 photoconversion could also be achieved in patches of the plasma membrane both in control and in LPS-exposed CHME3 microglia (Fig. 2B). The red species was more stable over time in the plasma membrane of untreated microglia compared to those exposed to LPS (Fig. 2B). LPS-exposed microglia also exhibited a shorter decay time for the red mEos-SVCT2 species at the plasma membrane compared to control cells (Fig. 2B), indicating that LPS reduced the plasma membrane abundance of SVCT2.
To support the SVCT2 photoconversion data, we performed plasma membrane FRAP analysis with CFP-SVCT2 in living CHME3 microglia exposed to LPS (Fig. 2C). As expected, the photobleaching recovery curve for CFP-SVCT2 (Fig. 2D) and the half-time for CFP-SVCT2 fluorescence recovery (Fig. 2E) were shorter in LPS-treated microglia compared with control cells, suggesting that LPS treatment decreased the amount of SVCT2 that was free to laterally diffuse within the plasma membrane of microglia. Biotinylation of the cell surface proteins of N9 microglia further confirmed that LPS decreased SVCT2 protein abundance at the plasma membrane (Fig. 2F). LPS treatment also reduced the uptake of [14C]ascorbate (the substrate for
SVCT2) by N9 microglia (Fig. 2G). LPS treatment of human retinal organotypic cultures from postmortem donors also decreased SVCT2 content in the microglia (Fig. 2H). Finally, stimulating microglial activation and inflammation in the rat retina in vivo by intravitreous injection of LPS or performing retinal ischemia-reperfusion injury (36–40) reduced SVCT2 abundance in the retina (Fig. 2, I and J). Together, these data show that LPS-induced microglial activation decreased the abundance of SVCT2 on the plasma membrane and reduced ascorbate uptake. Decreasing SVCT2 triggers a proinflammatory phenotype in microglia
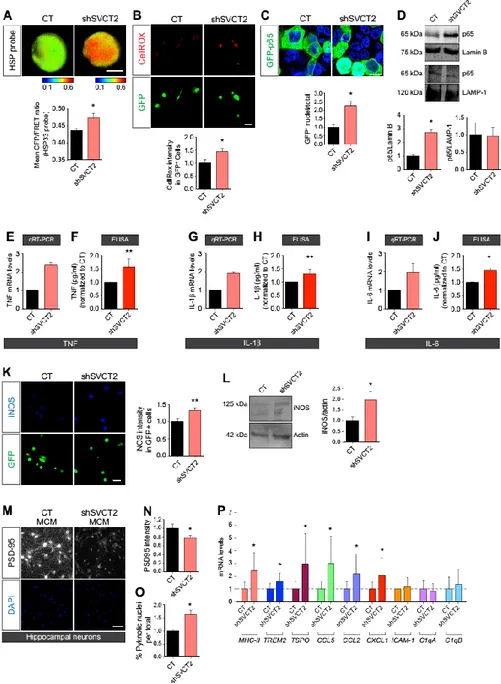
Because the abundance of SVCT2 on the surface of microglia decreased after inflammatory insults, we asked whether this decrease was sufficient to trigger a proinflammatory phenotype in microglia. Using lentiviral delivery of short hairpin RNAs (shRNAs), we knocked down SVCT2 expression in microglial cultures (fig. S2) and then evaluated whether this affected the expression of proinflammatory markers. Knockdown of SVCT2 in primary rat microglia increased both the production and accumulation of ROS compared to controls, as assayed by fluorescence resonance energy transfer (FRET) with a biosensor constructed from the heat shock protein 33 (pFRET–HSP33 cys), which indicates ROS production (41) and an ROS-sensitive fluorescent dye (Fig. 3, A and B).
NF-kB is a master transcriptional regulator of inflammation (42) that can be activated by intracellular ROS (43). We measured the nuclear accumulation of the p65 subunit of NF-kB as a functional indicator of NF-kB activation in SVCT2 knockdown (SVCT2-KD) N9 microglia using a green fluorescent protein (GFP)–tagged p65 construct. We observed an increase in the number of nuclei containing the GFP-tagged p65 in SVCT2-KD N9 microglia compared with controls (Fig. 3C). We also found an enrichment of p65 in nuclear extracts from SVCT2-KD N9 microglia (Fig. 3D) but no change in the abundance of p65 in cytosolic fractions (Fig. 3D).
We then analyzed, by quantitative reverse transcription polymerase chain reaction (qRT-PCR) and enzyme-linked immunosorbent assay (ELISA), the production and release of the proinflammatory cytokines tumor necrosis factor (TNF), interleukin-1b (IL-1b), and IL-6, each of which is transcriptionally regulated by NF-kB. We observed increased transcript abundance and increased release of TNF (Fig. 3, E and F), IL-1b (Fig. 3, G and H), and IL-6 (Fig. 3, I and J) in SVCT2-KD primary rat microglia compared to controls. We also detected an increase in the abundance of inducible nitric oxide synthase (iNOS) in these cells (Fig. 3K) by immunocytochemistry, which was corroborated by Western blotting of cell lysates from N9 microglial cells stably expressing short hairpin SVCT2 (shSVCT2) (Fig. 3L).
Activation and oxidative stress cause microglia to release factors that can damage neurons (33, 36). We therefore evaluated whether conditioned medium from SVCT2-KD primary rat microglia cultures (shSVCT2 MCM) affected the viability of primary rat hippocampal neurons (Fig. 3, M to O). We found that shSVCT2 MCM disrupted the postsynaptic scaffold of the hippocampal neurons, as revealed by a reduction in the postsynaptic density marker PSD-95 (Fig. 3N), and increased the numbers of neurons with pyknotic nuclei (Fig. 3O) compared to the hippocampal neurons incubated with conditioned medium from control cells.
We further characterized the microglial proinflammatory phenotype by studying the expression of selected inflammation-associated molecules in SVCT2-KD rat primary microglia by qRT-PCR. Our data revealed increased abundance of transcripts encoding the class II major histocompatibility complex (MHC-II), the triggering receptor expressed on myeloid cells 2 (TREM2), the translocator protein (TSPO), the C-X-C motif chemokine ligand 1 (CXCL1), the C-C motif chemokine ligand 5 (CCL5), and CCL2 in SVCT2-KD primary rat microglia compared with controls (Fig. 3P). Transcripts encoding intercellular adhesion molecule 1 (ICAM-1) and the complement proteins C1qA and C1qB were not affected in SVCT2-KD rat primary microglia (Fig. 3P). Together, these results indicated that decreasing SVCT2 in microglia induced a proinflammatory phenotype.
SVCT2+/− mice show increased activation of microglia
Having shown that decreasing SVCT2 expression induced proinflammatory microglia activation in culture, we next analyzed the activation state of microglia in the CNS parenchyma of mice with reduced SVCT2 (18). Because homozygosity for a null allele of SVCT2 causes lethality (18), we used SVCT2 heterozygous (SVCT2+/−) mice for our analysis. To assess microglial activation in the CNS parenchyma of SVCT2+/− and wild-type (WT) mice, we evaluated the distribution of the ionized calcium-binding adapter molecule 1 (Iba-1), a Ca2+-binding protein that is produced
by microglial cells and increases in abundance upon microglia activation in vivo (44), the number and morphology of Iba-1+ cells, and the number of MHC-II+ cells. Compared to WT mice,
SVCT2+/− mice displayed an increased number of Iba-1+ cells in the cerebral cortex (Fig. 4A) and
the retina (Fig. 4B). Cortical and retinal microglia from SVCT2+/− mice were also more immunoreactive for Iba-1, less ramified, and highly dystrophic, containing thicker and hypertrophied processes, both in the cortex (Fig. 4C) and in the retina (Fig. 4D) compared to microglia from WT littermates. Further supporting the Iba-1 and microglia morphology data, the brain and retinal parenchyma of SVCT2+/− animals also contained an increased number of MHC-II+ cells (Fig. 4, E and F). We then evaluated the immunoreactivity for Iba-1 and the number of Iba-1+ microglia in organotypic cultures from human postmortem retinas after
knocking down SVCT2 (Fig. 4G). We observed that SVCT2-KD cultures, which also express GFP from the pSicoR lentiviral vector, had increased numbers of microglia and presented augmented Iba-1 immunoreactivity relative to cultures infected with control lentiviruses carrying a scrambled sequence. Collectively, these results show that SVCT2 reduction in vivo also caused microglial activation.
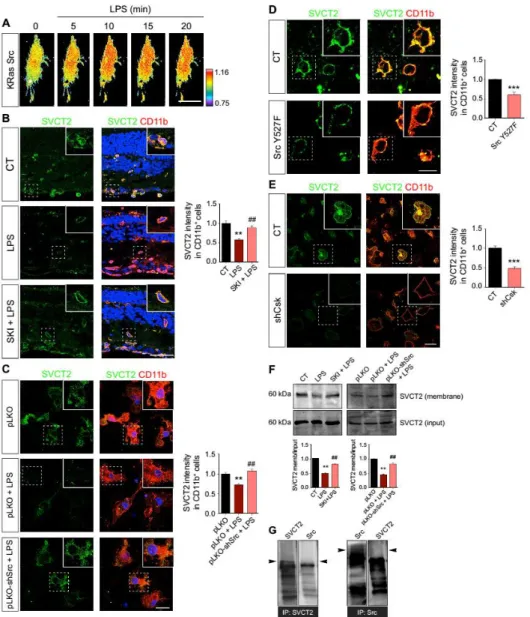
c-Src activation in microglia decreases SVCT2 on the plasma membrane
Src family kinases (SFKs) are cytosolic nonreceptor tyrosine kinases that promote microglia activation triggered by different inflammatory stimuli (45–50). Classical microglial stimulation with LPS increases the activity of SFKs, including the prototypical and founding member c-Src (36, 51). FRET analysis using the KRas Src biosensor demonstrated that LPS specifically activated c-Src in CHME3 microglia (Fig. 5A). Because stimulation of Toll-like receptor 4 (TLR4) can activate cSrc, we treated CHME3 microglia expressing the c-Src FRET biosensor with the TLR4 agonist Kdo2-LipidA (KLA) (52). We observed increased c-Src activation in living CHME3 microglia exposed to KLA (fig. S3), thus confirming the participation of TLR4 in c-Src activation in microglia. To investigate whether c-Src plays a role in the LPS-induced decrease in SVCT2 abundance, we injected the Src inhibitor SKI-1 into the vitreous humor of rats before inducing uveitis with LPS. SKI-1 prevented the LPS-induced SVCT2 decrease in rat retinal microglia in vivo (Fig. 5B). Knocking down c-Src with shRNAs abrogated the LPS-induced decrease in SVCT2 in primary rat microglia (Fig. 5C). To further confirm the role of c-Src in SVCT2 reduction, we
overexpressed a construct encoding a constitutively active form of c-Src (SrcY527F) in N9
microglia. This construct carries a point mutation in the C-terminal Src kinase (Csk) phosphorylation site, which impairs Csk-mediated inhibition of c-Src (53). Overexpressing SrcY527F in N9 microglia promoted a reduction in SVCT2 abundance (Fig. 5D). Knockdown of Csk,
which increases the basal activation of c-Src, also reduced the abundance of SVCT2 (Fig. 5E). To support the role of c-Src in SVCT2 internalization, we performed plasma membrane biotinylation assays in N9 microglia and observed that SKI-1 treatment or knockdown of c-Src prevented the LPS-induced decrease of plasma membrane SVCT2 (Fig. 5F), confirming that SVCT2 internalization required c-Src. To determine whether Src and SVCT2 interacted directly with one another in microglia, we performed coimmunoprecipitation with Src and SVCT2 in N9 microglia. Our results did not support a direct interaction between Src and SVCT2 in microglia (Fig. 5G).
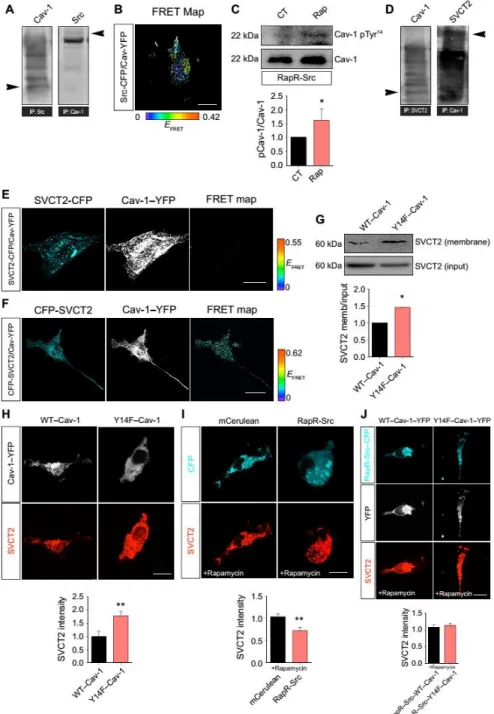
c-Src–mediated phosphorylation of Cav-1 decreases SVCT2 on the plasma membrane To gain mechanistic insight into SVCT2 internalization, we looked for candidate proteins that are involved in transmembrane protein internalization and regulated by c-Src. Cav-1 stood out as a good candidate because it mediates Src-induced internalization and can physically associate with c-Src (54). Coimmunoprecipitation of Src and Cav-1 confirmed the association of these proteins in N9 microglia (Fig. 6A). To give further support to the coimmunoprecipitation data, we used FRET with a rapamycin-inducible c-Src heteromerization chimera (RapR-Src), which is allosterically switched on upon rapamycin binding (55). Thus, cells transfected with this construct express a conformationally inactive c-Src that can be rapidly activated by rapamycin (55). In primary rat microglia, cultures cotransfected with C-terminal CFP-tagged RapR-Src (RapR-Src-CFP) and C-terminal yellow fluorescent protein (YFP)–tagged Cav-1 (Cav-1–YFP), we observed by FRET analysis that c-Src and Cav-1 interacted at a steady state (Fig. 6B). Src phosphorylates Cav-1 on Tyr14 (56), and we observed an increase in Cav-1 phospho-Tyr14 in
cells expressing RapR-Src-CFP treated with rapamycin (Fig. 6C). Together, these data indicate that Cav-1 and c-Src form a signaling complex in microglia.
Using lysates from N9 microglia, we found that SVCT2 interacted with Cav-1 (Fig. 6D). This interaction is most likely mediated through the N-terminal region of SVCT2 because we detected a very weak FRET signal between the C terminus–tagged SVCT2-CFP and Cav-1–YFP (Fig. 6E) as opposed to the robust FRET signal found between the N termini–tagged CFP-SVCT2 and Cav-1–YFP (Fig. 6F).
To investigate whether the c-Src–Cav-1 pathway could be responsible for SVCT2 internalization, we transfected human embryonic kidney (HEK) 293 T cells with WT–Cav-1 or with a mutant form Cav-1 in which Tyr14 was replaced by phenylalanine (Y14F–Cav-1). This point mutation
impairs c-Src–mediated phosphorylation of Tyr14 (57). We performed surface biotinylation
assays in these cells to evaluate the SVCT2 content in the plasma membrane. We observed that cells overexpressing Y14F–Cav-1 displayed higher amounts of SVCT2 in the plasma membrane compared with cells transfected with WT–Cav-1 (Fig. 6G). To validate these data, we transfected primary rat microglia with WT–Cav-1 or Y14F–Cav-1. By immunocytochemistry for SVCT2 in nonpermeabilized microglia, we detected an increase in SVCT2 content in cells overexpressing Y14F–Cav-1 compared to those overexpressing WT–Cav-1 (Fig. 6H). These data suggest that c-Src–dependent phosphorylation of Cav-1 at Tyr14 is required for SVCT2 internalization in
microglia.
To further substantiate these findings, we transfected primary rat microglia with RapR-Src-CFP or an empty control vector (mCerulean). Rapamycin treatment of RapR-Src–expressing microglia reduced SVCT2 surface abundance relative to cells expressing empty vector (Fig. 6I).
Then, by cotransfecting primary rat microglia with RapR-Src and either WT–Cav-1 or Y14F–Cav-1 and treating cells with rapamycin to induce c-Src activation, we found that overexpressing Y14F–Cav-1 prevented the decrease in SVCT2 content when compared with microglia overexpressing WT–Cav-1 (Fig. 6J). In conclusion, these data show that c-Src–dependent Tyr14
phosphorylation of Cav-1 in microglia specifically mediated SVCT2 internalization. SVCT2 is degraded in lysosomes
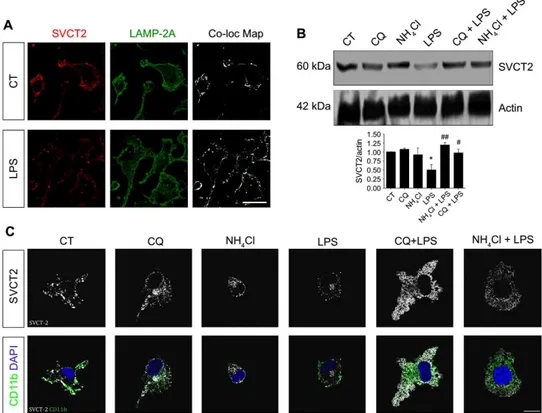
Having demonstrated that proinflammatory stimuli reduce the abundance of SVCT2 at the plasma membrane through c-Src–Cav-1, we next investigated SVCT2 degradation. Because SVCT2 is a transmembrane protein, its degradation is likely to occur in lysosomes. Mander’s colocalization analysis showed that SVCT2 and the lysosome marker LAMP-2A colocalized in primary rat microglia (Fig. 7A, top panels), and this colocalization increased after exposure of the cells to LPS (Fig. 7A, bottom panels). As expected, Western blotting of total cell lysates from N9 microglial cells showed that LPS induced SVCT2 degradation, which was abolished when cells were pretreated with chloroquine or NH4Cl to prevent lysosome-dependent proteolysis
(Fig. 7B) (58, 59). Similar results were obtained by immunocytochemistry in permeabilized primary rat microglia treated with these drugs (Fig. 7C). We concluded that internalized SVCT2 was degraded in lysosomes.
Ascorbate treatment, SVCT2 overexpression, or inhibition of SVCT2 internalization prevents microglia activation
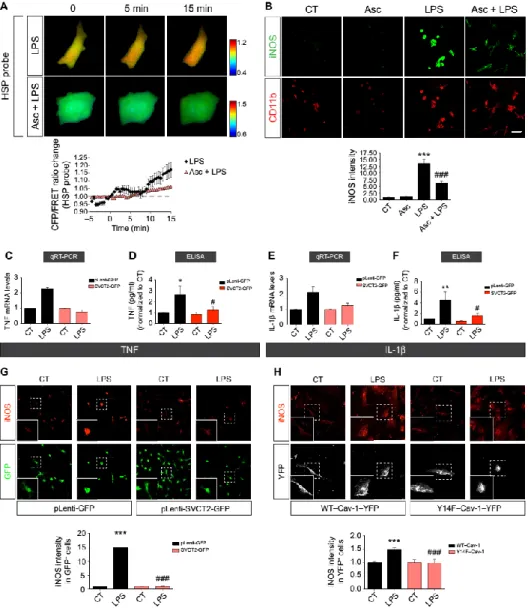
Having shown that reducing SVCT2 expression per se activated microglia (Figs. 3 and 4), we hypothesized that ascorbate treatment or maintaining the plasma membrane SVCT2 content would prevent microglia activation. To test our hypothesis, we first measured ROS production using FRET with the HSP33 cys probe that indicates ROS production in living CHME3 microglia exposed to LPS. LPS exposure elicited robust production of ROS in microglia that were not pretreated with ascorbate, as demonstrated by an increase in the CFP/FRET ratio of the HSP33 cys biosensor (Fig. 8A, black diamonds). However, preincubation with ascorbate attenuated the LPS-induced increase in ROS (Fig. 8A, light red triangles). We also observed a reduction in iNOS immunoreactivity in primary rat microglia pretreated with ascorbate before LPS exposure compared to cells that were not pretreated with ascorbate before LPS (Fig. 8B).
We asked whether the overexpression of SVCT2 would also prevent LPS-induced microglia activation. To overexpress SVCT2, we infected primary rat microglia with lentiviruses carrying an SVCT2-GFP chimera. Microglia infected with this construct had increased SVCT2 mRNA as detected by qRT-PCR (3.25 ± 0.83; n = 3). We then analyzed the expression of genes encoding the proinflammatory cytokines TNF and IL-1β by qRT-PCR and the release of these cytokines by ELISA in primary rat microglia infected with either pLenti-GFP carrying a 200–base pair (bp) nonsense insert (control) or pLenti-SVCT2-GFP and challenged with LPS. In contrast to control cells, exposure of primary rat microglia overexpressing SVCT2-GFP to LPS did not increase proinflammatory cytokine transcripts or release of the corresponding proteins (Fig. 8, C to F). Moreover, LPS exposure increased iNOS immunoreactivity in control primary rat microglia (Fig. 8G, black bars) but not in cells overexpressing SVCT2-GFP (Fig. 8G, light red bars).
Another way of increasing SVCT2 amounts at the plasma membrane is to prevent its internalization. Therefore, we transfected CHME3 microglia with Y14F–Cav-1 to prevent SVCT2 internalization. We observed, as expected, that LPS increased iNOS in WT–Cav-1–YFP CHME3 microglia (Fig. 8H, black bars) but not in CHME3 microglia overexpressing Y14F–Cav-1–YFP
(Fig. 8H, red bars). Collectively, these data show that preventing the decrease of SVCT2 at plasma membrane largely attenuated the proinflammatory activation of microglia.
Discussion
We demonstrated that SVCT2 and ascorbate uptake were important for cortical and retinal microglia homeostasis. Inflammatory insults decreased the amount of SVCT2 on the plasma membrane and consequently reduced ascorbate uptake in microglia. Reducing the abundance of SVCT2 was sufficient to trigger proinflammatory microglia activation in primary cultures, in organotypic cultures from human retinas, and in mice. Treating microglia with ascorbate, overexpressing SVCT2, or blocking SVCT2 internalization prevented microglia activation. We also provide compelling evidence that SVCT2 internalization involved Src activation and c-Src–dependent phosphorylation of Cav-1 and that SVCT2 degradation occurred in the lysosome. Overall, our results support a role for the ascorbate transporter SVCT2 in microglial physiology. Our data also led us to speculate that deregulation of SVCT2 function, and consequently of ascorbate homeostasis, might play a role in neurological conditions associated with microglial activation.
In line with previous work reporting the presence of SVCT2 in microglia of the rat brain (60), we showed that SVCT2 is also present in the microglia of the rat and human retina. We also demonstrated, using FRAP in living microglia, that SVCT2 was highly mobile and could easily diffuse within the microglial plasma membrane. SVCT2 displays high mobility at the plasma membrane of striatal neurons (25), which is consistent with our FRAP analysis in microglia. We revealed the presence of two components of ascorbate uptake in microglia, one with high affinity, in which the Km value is similar to those reported for SVCT2 in neurons from the
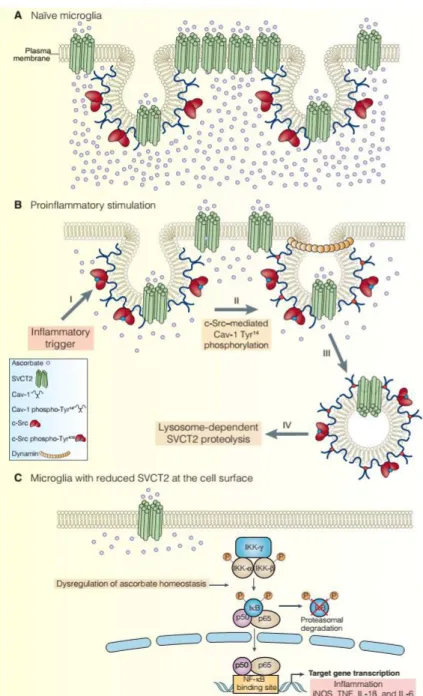
cerebellar cortex (61), HEK293T cells (62), and hypothalamic glial cells (63), and another one with low affinity. This second component, with lesser affinity for ascorbate, can be explained by the direct interaction between truncated (64) and full-length SVCT2, as previously demonstrated (62). The presence of two components for ascorbate uptake strongly suggests that, similarly to neurons, microglia actively concentrate ascorbate and that SVCT2 mediates ascorbate homeostasis (Fig. 9A).
An LPS-induced uveitis-like condition and retinal ischemia-reperfusion injury resulted in a pronounced decrease in the abundance of SVCT2 on microglia. Reduction of SVCT2 mRNA is observed in neurons and astrocytes in the core of brain ischemic lesions (65), which is also accompanied by an intense inflammatory response. Consistent with these data, exposure of cultured microglia to LPS led to SVCT2 internalization and reduced ascorbate uptake. Our results are consistent with other reports showing that LPS decreases intracellular ascorbate content in RAW264.7 macrophages (66) and that exposing human endothelial cells to proinflammatory cytokines reduces ascorbate uptake (67). We also showed that decreasing SVCT2 in microglia triggered a proinflammatory phenotype. SVCT2, however, is not the only plasma membrane transporter capable of inducing microglia activation. In Rett syndrome, an autism spectrum disorder, overexpressing the glutamine transporter SNAT1 (Slc38A1) in microglia impairs glutamine homeostasis and increases glutamate release, resulting in microglia-induced neurotoxicity (68).
Because microglia activation requires c-Src (36), we asked whether this kinase was involved in SVCT2 decrease. Although we observed no direct interaction between c-Src and SVCT2 in microglia, the N-terminal domain of SVCT2 interacted with Cav-1, a component of the endocytic machinery that binds to and is phosphorylated by c-Src (56, 69, 70). Furthermore, SVCT2 internalization depended on c-Src–dependent phosphorylation of Cav-1 at Tyr14. These findings
microglia and confirmed Cav-1 as a key component of the c-Src–dependent SVCT2 internalization. Stimulation of microglia with LPS promoted trafficking of SVCT2 to the lysosome and subsequent protease-dependent degradation of SVCT2 (Fig. 9B).
SVCT2-KD in microglia resulted in nuclear translocation of NF-kB, the release of proinflammatory cytokines, and stimulation of iNOS. NF-kB activation is a key step for microglia proinflammatory polarization (42). This transcription factor is activated not only by receptor-specific ligands but also directly by oxidizing agents (71). In the absence of SVCT2, there is a decrease in ascorbate uptake, which enhances ROS production (72). Increased ROS production might be sufficient to stimulate nuclear translocation of NF-kB because it enhances the proteasome dependent degradation of the inhibitor of NF-kB (IkB) (43). In addition, vitamin C also inhibits IkB phosphorylation and degradation by suppressing the activity of IkB kinase (IKK) (73, 74). Other antioxidants cannot substitute for vitamin C in inhibiting NF-kB activation (74), suggesting a specific role for vitamin C in regulating the NF-kB pathway. Such a specific role is in line with our results in microglia, which demonstrated that other intracellular antioxidant systems did not compensate the oxidative burden trigged by the decrease of ascorbate uptake. Therefore, decreasing ascorbate uptake in microglia can stimulate NF-kB– dependent transcription of TNF, IL-1β, IL-6, and iNOS (Fig. 9C).
We observed microglia activation in the cerebral cortex and retina of SVCT2+/− mice, which exhibit an about 30% decrease in brain ascorbate (18, 20). Vitamin C deficiency in the brain of APP/PSEN1/SVCT2+/− mice (an Alzheimer’s disease model) increases amyloid accumulation and oxidative stress (20). Although previous studies in this model did not address the role of microglia, it is tempting to speculate, in light of our data, that microglia activation influenced these phenotypes. Loading microglial cultures with ascorbate, overexpressing SVCT2, or preventing SVCT2 internalization blocked LPS-induced microglia activation. Our data support the notion that decreasing plasma membrane SVCT2, and consequently the uptake of ascorbate, was necessary for the proinflammatory activation of microglia. Therefore, preventing SVCT2 internalization, directly or through its regulatory pathways, might constitute an interesting therapeutic strategy to attenuate the deregulation of microglial activity in aging and disease.
Materials and Methods
Animals and human subjects
Animal committees from the Portuguese regulatory entity Direcção Geral de Alimentação e Veterinária (DGAV); the Animal Welfare Body (ORBEA) of the Institute for Biomedical Imaging and Life Sciences (IBILI), Faculty of Medicine, University of Coimbra; and the animal ethics committee of IBMC-i3S, Porto, approved all experiments involving animal models or primary cell cultures. Animal facilities and the people directly involved in animal experimentation were also certified by DGAV. All animal experiments took into account the Russell and Burch 3R’s principle and followed the European guidelines for animal welfare (2010/63/EU Directive), and all efforts were made to ensure minimal animal suffering and human end points, when justified, were strictly observed. All studies and procedures using SVCT2-deficient mice were approved by the local governmental authorities (State Office for Nature, Environment, and Consumer Protection, North Rhine-Westphalia, Germany; AZ 8.87-50.10.36.08.297) and were conducted in accordance with the European Convention for Animal Care and Ethical Use of Laboratory Animals. Postmortem human eyes from donors without ocular diseases were obtained after the removal of corneas for transplantation from the Coimbra Hospital and University Centre (Coimbra, Portugal). The ethical committee of the Faculty of Medicine, University of Coimbra, approved experiments with human retinal samples.
SVCT2+/− mice were provided by R. L. Nussbaum (University of California, San Francisco, CA). Because SVCT2−/− mice are not viable (18), 24-day-old SVCT2+/− mice were used in our experiments. Both male and female mice were used with no sex distinction, and mice were genotyped by PCR of tail cuts. Primer sequences for PCR were as follows: WT, 5′-TAATCCTGGCTATCCTCGTG-3′ (forward) and 5′-CATCTGTGCGTGCATAGTAGC-3′ (reverse); knockout, 5′-GATTGCACGCAGGTTCTCC-3′ (forward) and 5′-GCCAACGCTATGTCCTGATA-3′ (reverse). Male Wistar rats were purchased from Charles River Laboratories and were used for ischemia-reperfusion injury or experiments with intravitreal injections of LPS. Animals were maintained in standard laboratory conditions with a 12-hour light/12-hour dark cycle and were given free access to food and water. The number of animals was kept to the minimum needed. Chemical reagents
LPS from Escherichia coli 0111:B4, SKI-1, chloroquine, ammonium chloride (NH4Cl), ascorbate,
and rapamycin from Streptomyces hygroscopicus were purchased from Sigma-Aldrich. CellROX Deep Red reagent was purchased from Thermo Fisher Scientific. KLA (stock, 0.5 mg/ml) was purchased from Santa Cruz Biotechnology.
Plasmids
NF-kB GFP-tagged p65 (plasmid 23255), pLNCX chick Src Y527F (plasmid 13660), pUSE-Src-YF-UniRapR-mCerulean-myc (plasmid 45381), pFRET-HSP33 cys (plasmid 16076), mCerulean (plasmid 27796), psPAX2 (plasmid 12260), pMD2.G (plasmid 12259), pUMVC (plasmid 8449), pMSCV (plasmid 24828), and pSicoR (plasmid 11579) were from Addgene. Human SVCT2 N termini enhanced CFP (ECFP) tag Z1804-M32) and human SVCT2 C termini ECFP tag (EX-Z1804-M33) were from GeneCopoeia. pLenti–cytomegalovirus (CMV) (mouse Slc23a2)– Rsv(GFP-Puro) and pLenti-CMV(200-bp nonsense insert)–Rsv (GFP-Puro) were from AMSBIO. Human SVCT2 N termini mEos3.2 was from VectorBuilder. Src Mission shRNA clone TRCN0000023597, CSK Mission shRNA clone TRCN0000321790, and control pLKO.1 empty vector were from Sigma-Aldrich. KRas Src (WT) YPet FRET probe was supplied by S. Chien (University of California) (75, 76). Activated Src (KRas Src) and ROS (pFRET-HSP33 cys) biosensors have been previously used in microglial cells, giving reliable FRET to donor signals within the probe dynamic range (36). C-terminal YFP tagging of WT or Y14F human Cav-1 was generated and characterized elsewhere (57). All transfections were performed using jetPRIME (Polyplus Transfection) according to the manufacturer’s protocol.
SVCT2 shRNA was cloned into the pSicoR-GFP vector using a previously described protocol (77). Briefly, shRNA oligos (forward, 5′-TACGGCATGGAGTCCTCAATTTCAAGAGAGATTGTAGGA CTCCATGCCGTTTTTTC-3′; reverse, 5′-TCGAGAAAAAAACGGCATGGAGTCCTACAATCTCTC TTGAAATTGTAGGACTCCATGCCGTA-3′) were annealed and cloned into Hpa I–Xho I–digested pSicoR using T4 ligase (Roche). Oligo insertion into the vector was confirmed by sequencing. A
control shRNA with no mammalian target (directed against DsRed2) was used in experiments using the pSicoRGFP vector (78).
Production of lentiviruses and retroviruses
This protocol was performed exactly as described elsewhere (79, 80). Low-passage HEK293T cells were seeded in 100-mm culture dishes. When cultures reached ~80% confluence, cells were cotransfected overnight with virus-producing plasmids using jetPRIME (Polyplus Transfection) according to the manufacturer’s protocol. Transfection ratios were as follows: 6 µg of shRNA plasmids to 3 µg of psPAX2 to 3 µg of pMD2.G (2:1:1) for lentivirus production or 8
µg of pMSCV and Src Y527F construct to 4 µg of pUMVC to 2 µg of pMD2.G (4:2:1) for retrovirus production. The next day, normal growth medium replaced transfection medium, and cells were cultivated for an additional 48 hours. Next, media with viral particles were collected and centrifuged at 906g for 15 min at 4°C, and the supernatant was collected into new tubes and kept at −80°C. An exception was the SVCT2 shRNA lentiviral particles to produce stable shSVCT2 N9 cell subclones that were from Santa Cruz Biotechnology. Cultures were transduced with viral particles exactly as described elsewhere (36).
Primary microglia, retina, and neuron cultures
Retinal primary microglial cell cultures were performed as previously described (36). In brief, Wistar rat pups (5 days old) were sacrificed, and their retinas were dissected in Hanks’ balanced salt solution (HBSS; pH 7.2) (Life Technologies) and digested with 0.07% trypsin (Worthington) for 15 min. Next, cells were gently dissociated using a glass pipette in Dulbecco’s modified Eagle’s medium (DMEM) F12 GlutaMAX-I (Life Technologies) supplemented with 10% fetal bovine serum (FBS) (Life Technologies), 0.1% gentamicin (Life Technologies), and macrophage colony-stimulating factor (2 µg/ml; PeproTech). Cells were plated in poly-D-lysine–coated (Sigma) T-flasks (75 cm2) at 1.5 × 10⁶ cells/cm2. Cultures were kept at 37°C and 95% air/5%
CO2 in a humidified incubator. Culture medium was changed every 3 days for up to 21 days. To obtain purified retinal microglial cell cultures, culture flasks were subjected to orbital shaking at 200 rpm for 2 hours. Next, culture supernatant was collected to Falcon tubes and centrifuged at 453g for 5 min at room temperature (RT). The supernatant was discarded, and the pellet, containing microglia, was resuspended in culture medium. Cells were seeded on poly-D-lysine– coated culture plates at 2.5 × 10⁵ cells/cm2 in supplemented DMEM F12 GlutaMAX-I. Purified
microglia were cultured for 5 days and then treated with LPS (1 µg/ml; 24 hours). Immunolabeling with CD11b showed a purity of 98% for these cultures.
Cortical microglial cell cultures were performed as previously described (36). Briefly, culture flasks containing mixed cortical cultures (cultured for 10 days) obtained from Wistar rat pups (P0 to P2) were subjected to orbital shaking at 200 rpm for 2 hours, and supernatant enriched in microglia were centrifuged at 453g for 5 min at RT. The supernatant was discarded, and the pellet, containing microglia, was resuspended in DMEM F12 GlutaMAX-I (Life Technologies) supplemented with 10% FBS (Life Technologies), penicillin (100 U/ml), and streptomycin (100 mg/ml; Life Technologies) and were maintained at 37°C and 95% air/5% CO2 in a humidified incubator. Cortical microglia were cultured for 5 to 7 days and then treated with LPS (1 µg/ml; 24 hours). Purity was determined with CD11b labeling and reached 99%.
Hippocampi were dissected from embryonic day 18 Wistar rat embryos and dissociated using trypsin (0.25%, v/v). Neurons were plated at a final density of 1 × 10⁴ to 5 × 10⁴ cells per dish
and cultured in the presence of a glial feeder layer. Cells were cultured in Neurobasal medium supplemented with B27 supplement (1:50, v/v), 25 µM glutamate, 0.5 mM glutamine, and gentamicin (0.12 mg/ml). To prevent glial overgrowth, neuronal cultures were treated with 5 µM cytosine arabinoside after 3 days in vitro (DIV) and maintained in a humidified incubator with 5% CO2/95% air at 37°C for up to 2 weeks, feeding the cells once per week by replacing one-third of the medium.
Human retinas were dissected, cut into about 4 × 4–mm pieces and flat-mounted onto 30-mm-diameter culture plate inserts with a 0.4-mm pore size (Millicell, Merck Millipore), with the ganglion cell layer side facing upward. The retinal explants were cultured in Neurobasal-A medium (Life Technologies) containing 2% B27 supplement (Life Technologies), 2% FBS (Life Technologies), 2 mM L-glutamine (Sigma), and 1% antibiotic-antimycotic mixture containing penicillin, streptomycin, and amphotericin B (Life Technologies) and maintained for 3 DIV at
37°C in a humidified environment with 5% CO2. On DIV 2, retinal explants were treated with LPS (5 µg/ml) for 24 hours or left untreated. More information about the human donors is shown in table S1.
Microglial cell lines
The murine microglial cell line N9 (81) was cultured in RPMI 1640 (Life Technologies) supplemented with 5% FBS (Life Technologies), 23.8 mM sodium bicarbonate (Life Technologies), 30 mM D-glucose (Sigma), penicillin (100 U/ml), and streptomycin (100 µg/ml; Life Technologies) and were maintained at 37°C and 95% air/5% CO2 in a humidified incubator. N9 cells were infected with viral particles and allowed to grow for an additional 48 hours. Cells carrying an empty vector (pLKO) or SVCT2 shRNA were treated with puromycin (6 µg/ml; Calbiochem) for 48 hours. Cells were selected with puromycin until control (noninfected) N9 cultures were completely dead. Stable transfected subclones were confirmed by Western blot for SVCT2 as described in fig. S1A. The human microglial cell line CHME3 (82) was cultured in DMEM GlutaMAX-I (Life Technologies) supplemented with 10% FBS (Life Technologies), penicillin (100 U/ml), and streptomycin (100 µg/ml; Life Technologies) and were maintained at 37°C and 95% air/5% CO2 in a humidified incubator.
Intravitreous injections
Male Wistar rats (8 weeks old) were anesthetized using a mix of ketamine (75 mg/kg) and xylazine (10 mg/kg) administered intraperitoneally. SKI-1 (2 µl of a 7 µM stock solution; estimated final concentration is 200 nM in the vitreous) or LPS [3 ml of a stock solution (25 µg/ml); estimated final concentration is 1 µg/ml in the vitreous] was gently injected into the left eye vitreous body as described elsewhere (36). The control eye (right eye) was injected with PBS (3 µl). In experiments requiring multiple injections, SKI-1 was always injected 30 min before LPS, and the control eye was injected with PBS. Twenty-four hours after LPS administration, animals were perfused, and their eyes were enucleated and processed for immunohistochemistry. We used five different animals, and their retinas were grouped as follows: three retinas injected with PBS (control), three injected with LPS, three injected with SKI-1 and LPS, and one injected with SKI-1 only.
Retinal ischemia-reperfusion injury
Male Wistar rats (8 weeks old) were anesthetized by intraperitoneal injection of a mix of ketamine (90 mg/kg) and xylazine (10 mg/kg). The anterior chamber of one eye was cannulated with an infusion needle connected to a saline reservoir to increase the intraocular pressure (IOP) to induce ischemia as described previously (36, 39, 40). The IOP was increased to 80 to 90 mmHg for 90 min through the elevation of the saline reservoir. The IOP was monitored during the course of the experiment using a tonometer (Tonolab, Icare). After 90 min, the needle was withdrawn, the IOP pressure was normalized, and circulation was reestablished (reperfusion). The contralateral eye was the nonischemic control in every experimental condition. Animals were perfused 24 hours after ischemia, and the eyes were processed for immunohistochemistry.
Retina preparation and immunohistochemistry
After animal perfusion, the eyecups were fixed by immersion in 2% paraformaldehyde (PFA) in PBS (pH 7.2) for 1 hour at RT. The tissue was washed with PBS and then cryoprotected using
sucrose gradient in a row (15 and 30%). After 24 hours, retinas and brains were mounted in optimal cutting temperature compound (Thermo Scientific), frozen, and cryosectioned in a CM3050S Cryostat (Leica Biosystems). Sagittal sections from the brain (30-µm thickness between bregma positions 1.0 and −2.0 mm) and sections from the retinas (12-µm thickness from nasal to temporal retina) were collected nonsequentially in Superfrost Ultra Plus Slides (Thermo Scientific) and stored at −20°C. Slides were defrosted for 1 hour and then hydrated in PBS for 15 min. Sections were permeabilized with 0.25% Triton X-100 (except the sections used for SVCT2 immunostaining in which no permeabilization step was performed), washed with PBS for 10 min, and blocked in 5% BSA, 5% FBS, and 0.1% Triton X-100 (except for SVCT2 immunostaining in which no Triton X-100 was added to the blocking solution) for 1 hour at RT before being incubated with primary antibodies in blocking solution overnight at 4°C in a humidified chamber. Next, sections were washed three times for 10 min in PBS and incubated with a secondary antibody for 2 hours in blocking solution at RT. When double-immunostaining was performed, the second primary and secondary antibodies were incubated independently, as described above. After the last secondary antibody, sections were washed three times in PBS for 10 min, incubated for 10 min with DAPI (5 µg/ml) in PBS (Sigma), rinsed twice in PBS, and mounted in DAKO glycergel or Immu-Mount (Thermo Scientific). The sources and concentration of all antibodies used for immunohistochemistry of rat retinas are described in table S2, with the exception of immunohistochemistry in human organotypic retinal cultures that are described below.
For immunostaining of human organotypic retinal cultures, the 4 × 4–mm pieces were fixed in 2% PFA for 15 min at RT. The explants were permeabilized and blocked in 0.1% Triton X-100, 3% BSA, and 10% goat serum in PBS for 60 min at RT. Explants were incubated for 72 hours at 4°C with rabbit anti-SVCT2 (1:250; Novus Biologicals) and rat anti-CD11b (1:1000; AbD Serotec) primary antibodies diluted in 3% BSA and 10% goat serum in PBS. After extensive washing with PBS, explants were incubated overnight at 4°C with Alexa Fluor 488 goat anti-rabbit IgG (1:200), and Alexa Fluor 568 goat anti-rat IgG (1:200) secondary antibodies were diluted in 3% BSA and 10% goat serum in PBS. Nuclei were stained with DAPI (5 µg/ml). Images were acquired in a Zeiss LSM 710 confocal microscope.
Confocal image acquisition, three-dimensional image reconstruction, and cell counting on tissue sections
Images were acquired using a Leica HCX PL APO 63×/1.3 GLYC CORR CS (21°C) in 8-bit sequential mode using standard true confocal scanning (TCS) mode at 400 Hz, and the pinhole was kept at 1 airy unit in the Leica TCS SP5 II confocal microscope. Images were resolved at 1024 × 1024 pixel format illuminated with 2 to 5% HeNe wave laser (543 nm) using a HyD detector in the photon counting mode, and the entire z-series were acquired for brain (usually 25- to 27-µm stack thickness) or retinal (usually 10-µm stack thickness) slices using the optimized z-step size in bidirectional scanner mode.
Stacks were deconvolved with the Huygens Professional using the classic maximum likelihood estimation (CMLE) algorithm together with a determined theoretical point-spread function (PSF) established using a routine-based implementation for the Huygens software. Reconstruction and generation of three-dimensional (3D) volumes of deconvolved images were performed using the ImageJ 3D viewer plug-in using default parameters, and cell counts were performed manually in integral 3D volume-rendered images.
Representative images were generated as 3D projections. In brief, stack rendering was resolved in FIJI using the 3D projection plug-in with the nearest-point projection method. Rotation was set at the y axis with an initial 0° to 270° total rotation angle. Lower transparency was set at 25
and upper transparency at 255 with 0% opacity and 55% interior depth cueing. All other parameters were set for the plug-in default. For Iba-1 and MHC-II staining in the brain, we counted cells in images reconstructed from four nonconsecutive slides (with three brain sections per slide, 240 µm apart) from three different animals. For Iba-1 and MHC-II staining in the retina, we counted cells in images reconstructed from 10 nonconsecutive slides (with three retinal sections per slide, 120 µm apart) from three different animals.
Assessment of microglial morphology
3D images were segmented, and binary masks were generated as described above. The point detection tool in the FIJI software was used for determining the center of the microglia based on the nucleus localization (stained with DAPI). Sholl analysis was recorded from binary images in FIJI using 10- to 50-µm within the shell spread radius with a 1-µm increase in the step size. Primary branches were inferred on the basis of the starting radius, and Sholl profiles were resolved using an unconstrained polynomial fitting with the area of the calibrated image serving as normalizer. The ramification index was retrieved from the Sholl table, exported, and evaluated using the GraphPad software.
Immunocytochemistry
For all immunocytochemistry except SVCT2, cells on coverslips were fixed in 4% PFA, washed three times for 5 min in PBS, permeabilized with 0.1% Triton X-100 for 10 min, washed again, and blocked for 1 hour in 5% BSA in PBS before being incubated with primary antibodies in a humidified chamber for 1 hour at RT. After removal of the primary antibody, coverslips were washed three times for 10 min with PBS and incubated with a secondary antibody for 1 hour in 5% BSA at RT. When double immunostaining was performed, the second primary and secondary antibodies were incubated independently. Coverslips were then washed three times for 10 min with PBS, incubated for 1 min with DAPI (1 µg/ml), and rinsed twice in PBS. Coverslips were mounted in Immu-Mount (Thermo Scientific) and visualized in a Leica DMI6000 B inverted epifluorescence microscope. Images were acquired with 4 × 4 binning using a digital complementary metal-oxide-semiconductor (CMOS) camera (ORCAFlash4.0 V2, Hamamatsu Photonics). All antibody sources and concentrations used for immunocytochemistry are described in table S3.
For SVCT2 immunocytochemistry, the above procedures were modified as follows: Cells on coverslips were fixed with 1% PFA for 12 min and were not permeabilized. Coverslips were mounted in glycergel (DAKO), and cells were visualized under a Leica TCS SP5 II or Zeiss LSM 710 confocal microscope.
Quantification of fluorescence
Images were acquired with a Leica TCS SP5 II, Zeiss LSM 710 confocal, or Leica DMI6000 B inverted microscope using the ORCA-Flash4.0 V2 (Hamamatsu Photonics) CMOS camera. Images were exported as raw 16-bit tiff using the LAS AF software or ZEN 2009 software with the original metadata preserved. Tiffs had their background subtracted in FIJI using the roller ball ramp in between 35 and 50% pixel radius.
The Huygens Professional software deconvolved 2D tiff images using the CMLE algorithm together with a determined theoretical PSF established using a routine-based implementation for the Huygens software, taking into account the microscope setup used (either confocal or wild field). Deconvolved images were segmented in FIJI using an automatic local Otsu threshold algorithm (based solely on the maximum intensity in the distribution histogram) for confocal
images or a modification of the triangle threshold algorithm (around the maximum histogram peak discarding the flattened histogram edges) for cultured cells. Each thresholded microglial cell was delineated using the particle analyze tool in calibrated images and exported to the FIJI region of interest (ROI) manager. Thresholded images were converted to 8-bit binary mask using the dark background function. Binary mask images were multiplied for their respective original channel images using the image calculator plug-in to generate a masked 32-bit float image relative to each channel. The original coordinate vectors were retrieved from the ROI manager, and FIJI returned the mean gray values for every single microglia (CD11b+ or Iba-1+)
using the multimeasure function. Individual mean fluorescence intensity (in gray values) for the pixels in individually segmented microglia was exported to the GraphPad Prism software for statistical evaluation.
To achieve reproducible results and meaningful data, we performed the fluorescence immunostaining in all the experimental groups (cultured cells or slides with tissue sections) together and using the same batch of primary and secondary antibodies and blocking and washing solutions. Furthermore, all images in the samples of a given data set were acquired on the same day, always by the same operator and with identical microscope parameters (for example, same power for the confocal argon laser; same laser line potency; same objective; same photomultiplier tube; same fluorescence exposure times and offset for a given fluorophore; same camera binning, zoom, and ROI magnification; same pinhole aperture; same pixel size; same line averaging; same TCS scanner mode and speed; and same z-stack step size and optical sectioning) for the different samples and replicates. Moreover, to minimize bias, quantification of images was performed in a blinded fashion, and the same researcher never quantified the data set he or she acquired.
Mander’s quantitative colocalization analysis
Images were acquired using an HCX Plan Apo 63×/1.4 to 0.6 numerical aperture (NA) oil immersion objective in 16-bit sequential mode using bidirectional TCS mode at 100 Hz with the pinhole kept at 1 airy unit in the Leica TCS SP5 II confocal microscope. The LAS AF software processed the images using subtracted background (25% offset for both channels) and thresholded foreground (20 to 35% offset for LAMP-2A channel and 10 to 15% offset for SVCT2 channel). Values corresponding to the intensities of SVCT2/LAMP-2A pixel colocalization puncta were developed by the LAS AF software and further processed in the FIJI software. The Coloc2 plug-in in FIJI was used to establish the quantitative colocalization of LAMP-2A/SVCT2 channels based on the Mander’s split coefficient (a value from 0 to 1 representing the pixel intensity in the SVCT2 channel colocalizing with any pixel in LAMP-2A channel above the threshold). The randomized Costes threshold was used to generate the pixel colocalization map for both channels. After the colocalizaton test, the Costes statistical significance was run with 100× repetitions, and images with a P value different than 1 were discarded.
FRAP assay
CHME3 microglia expressing CFP-tagged SVCT2 were incubated with Ca2+/Mg2+-free HBSS or
with Ca2+/Mg2+-free HBSS plus LPS (1 mg/ml for 150 min) at 37°C during time-lapse
acquisitions. FRAP was performed on a Leica TCS SP5 II confocal microscope using an HC PL APO CS 40×/1.10 CORR water objective and controlled by the LAS AF software. CFP-SVCT2 excitation was performed using the 405-nm laser line and collected in a photomultiplier tube. Bidirectional scanner configuration was used at 400-Hz speed to collect images in a 512 × 512 pixel resolution. The pinhole was set to 1 airy unit, and 2 × 2 line average was used. The FRAP Wizard commanded the sequential steps for acquiring images before, during the bleaching, and
after fluorescence recovery of the desired ROI containing CFP-SVCT2 signal at the plasma membrane. Sequences were acquired at 3 s per frame using the minimize function in the FRAP wizard. Fluorescent signals were resolved and quantified in FIJI. Normalization of FRAP data was performed as previously described (83), and a monoexponential association function was used to fit the normalized FRAP data and extract the half-time for fluorescence recovery using the GraphPad prism software.
SVCT2 photoconversion assay
CHME3 microglia expressing mEos-tagged SVCT2 were incubated with HBSS or with HBSS plus LPS (1 mg/ml for 30 min) at 37°C during time-lapse acquisitions. Photoconversion was performed on a Leica TCS SP5 II confocal microscope using an HC PL APO 63×/1.30 Glyc CORR CS2 glycerol immersion objective and controlled by the LAS AF software. mEos-SVCT2 excitation was performed using the 488-nm laser line (for the green species) and the 561-nm laser line (for the red species) and collected in separated photomultiplier tubes. Bidirectional scanner configuration was used at 1200-Hz speed to collect images in a 512 × 512 pixel resolution. The pinhole was set to 1 airy unit, and 2 × 2 line average was used. The scan ROI function in the LAS AF software was used to photoconvert green mEos into red mEos species by scanning a desired ROI (at microglial plasma membrane patches or the entire microglial cell) for 5 to 7 s with the 405-nm laser line at 20% potency. Time lapses were recorded at 700 ms per frame for 60 s. Pixel counts over time for the red mEos species on individual plasma membrane patches in each microglia were fitted using a monoexponential decay function, and values corresponding to the time decay constant were extracted by the LAS AF software and averaged for statistical evaluation.
FRET assays
FRET-based live cell imaging with nanosensors.
CHME3 or primary rat cortical microglia were plated on plastic-bottom culture dishes (µ-Dish 35 mm, iBidi). In some cases, cells were treated with LPS (1 µg/ml), with ascorbate plus LPS (100 µM + 1 µg/ml, respectively), or with KLA (50 ng/ml). Imaging was performed using the Leica DMI6000 B inverted microscope as previously described (36). The excitation light source was a mercury metal halide bulb integrated with the EL6000 light attenuator. High-speed low-vibration external excitation/emission filter wheels (equipped with CFP/YFP excitation and emission filters) were mounted on the microscope (Fast Filter Wheels, Leica Microsystems). A 440- to 520-nm dichroic mirror (CG1, Leica Microsystems) and a Plan Apo 63× 1.3 NA glycerol immersion objective were used for the donor and the acceptor. Images were acquired with 4 × 4 binning using a digital CMOS camera (ORCA-Flash4.0 V2, Hamamatsu Photonics). Shading illumination was online-corrected for CFP and FRET channels using a shading correction routine implemented for the LAS AF software. At each time point, CFP and FRET images were sequentially acquired using different filter combinations (CFP excitation plus CFP emission and CFP excitation plus YFP emission, respectively). Images were exported as 16-bit tiff files and processed in the FIJI software. Background was dynamically subtracted from all slices from both channels, and images were filtered using a Kalman stack filter routine for FIJI. Segmentation was achieved on a pixel-by-pixel basis using a modification of the Phansalkar local threshold algorithm. After background subtraction and thresholding, binary masks were generated for CFP and FRET channels. Original CFP and FRET images were masked, registered, and bleach-corrected. Then, ratio time lapses (CFP/FRET for the c-Src probe and ROS probe) were generated in 32-bit float-point tiff images. Values for the mean gray values were generated using the multicalculation function in FIJI and exported as mentioned above.
Acceptor photobleaching FRET.
Primarymicroglialcellculturesweretransfectedwithspecifiedfluorescenttagged proteins, fixed with 4% PFA, and used for this assay. Samples were observed in a Leica TCS SP8 X confocal microscope for the detection of colocalization puncta. Microglial cells with CFP/YFP colocalization coefficient above 85% were further processed for FRET. We used the acceptor photobleaching FRET method to determine protein interaction in our samples. ECFP (SVCT2) was the donor and EYFP (WT–Cav-1) was the acceptor for FRET detection. Samples were imaged using an HC APO CS2 63×/1.4 NA oil immersion objective. Confocal module was set to standard scanning at 400 Hz using simultaneous acquisition parameters with a 512 × 512 pixel format obtaining a pixel size of 94 nm2 in a 0.89-µm optical section with automatic pinhole
configuration. Donor images were acquired using the 458-beam laser line with the power at 32% and captured using HyD SMD detector at photon counting gated between 4 and 24% (to ablate CFP autofluoresce). Acceptor images were acquired with the 514-beam laser line at 26% laser power using a second parallel HyD SMD detector gated between 12 and 21% (to minimize YFP bleed-through). Photobleaching was performed, increasing the 514-beam laser line excitation power to 100% for 60 to 90 s with completely opened pinhole, whereas the 458-beam laser line was turned off with the donor detector shunt-off. FRET sequence was performed acquiring prebleaching images of both donor and acceptor, followed by the photobleaching stage and a final sequence of donor and acceptor image acquisitions using the same settings from the prebleaching stage. Images in which acceptor photobleaching was inferior to 75% were discarded. Images were processed using the LAS X colocalization algorithm to correct for incomplete acceptor photobleaching and cross-talk bleed-through from the donor to the acceptor channel and from the acceptor to the donor channel during postbleaching using images in which only the donor or only the acceptor was transfected in the microglia. FRET heatmap images were generated using FIJI. FRET efficiency (EFRET) was calculated according to the
formula EFRET =(EDonor pos-B – EDonor pre-B)/EDonor pos-B. At least 15 different ROIs were analyzed per
microglial cell.
Nuclear and cytosolic fractionation
N9 cultures were washed twice with PBS, and cells were scraped off culture dishes with lysis buffer [50 mM tris-HCl, 5 mM EDTA, 100 mM NaCl, 1 mM dithiothreitol (DTT), 100 µM phenylmethylsulfonyl fluoride, 200 µM Na3VO4, 1% Triton X-100, leupeptin (4 µg/ml)]. The
material was transferred to tubes and kept in constant motion for 10 min at 4°C. Lysates were centrifuged (16,000g for 10 min at 4°C), the supernatant (cytosolic fraction) was collected, and the pellet (nuclear fraction) was resuspended. All samples were denatured with sample buffer for 5 min at 95°C and stored at −20°C. Both fractions were subjected to SDS–polyacrylamide gel electrophoresis (SDS-PAGE). To confirm the efficacy of the separation assay, we used LAMP-1 (Enzo Life Sciences) as a cytosolic fraction marker and Lamin B (Millipore) as a nuclear fraction marker. These proteins were also used for total quantification in each fraction.
Pulldown of plasma membrane proteins by biotinylation
Freshly isolated retinas or N9 microglial cells [previously treated with LPS (1 µg/ml) for 24 hours] were washed twice with PBS Ca2+/Mg2+ (137 mM NaCl, 2.7 mM KCl, 1.8 mM KH2PO4,
10mM Na2HPO4·2H2O, 0.9 mM CaCl2, 0.5 mM MgCl2) and incubated with NHS-SS-Biotin (1
mg/ml; Thermo Scientific) for 30 min at 4°C with slight rotation in the dark. Next, cells were washed twice with 100 mM glycine-supplemented PBS Ca2+/Mg2+ and incubated in this same
saline for 45 min at 4°C with slight rotation in the dark. Then, cells were lysed with radio immunoprecipitation assay (RIPA)–DTT buffer, sonicated (six pulses of 1 s at 60 Hz), and
centrifuged (16,000g for 10 min at 4°C). The supernatant was collected into new tubes, and the protein content was determined by the bicinchoninic acid assay (BCA) method. Total amount of protein in each sample was equalized, 50 µl of sample was separated to serve as input, and the remaining sample was incubated with NeutrAvidin (0.2 µl of avidin beads to each microgram of protein in each sample) for 2 hours at 4°C with orbital shaking. Next, avidin-sample complexes were centrifuged (2800g for 3 min), and the supernatant was used as the unbound fraction. The resulting pellet was washed in RIPA-DTT by mild centrifugation, and complexes were eluted using sample buffer and boiled for 5 min for complete denaturation. Avidin beads were centrifuged (16,000g for 2 min), and biotinylated fractions (supernatants) were collected into new tubes and subjected to Western blotting.
Coimmunoprecipitation
Cells were scraped off of culture dishes with 150 µl of immunoprecipitation buffer (20 mM tris, 200 mM NaCl, 4 mM EGTA, 4 mM EDTA, and 2% Triton X-100) supplemented with complete mini protease inhibitor cocktail tablets (Roche), 10 mM NaF, and 1 mM Na3VO4, and sonicated
(six pulses of 1 s at 60 Hz) and centrifuged for 5 min at 16,000g at 4°C. Total protein from supernatant was quantified by the BCA method. Protein concentration was equalized in all samples, and 500 µg of total protein was incubated with specific antibodies [10 µg of SVCT2 (G19, Santa Cruz Biotechnology) or 2 µg of Cav-1 (Abcam) or 1:100 Src (Cell Signaling Technology)] overnight at 4°C on a rotating plate stirrer. Protein A Sepharose beads (GE Healthcare) were added, and the protein sample was incubated for an additional 2 hours at 4°C. Samples were washed three times with immunoprecipitation buffer by centrifugation, and the pellet was denatured in sample buffer for 5 min at 95°C. The samples were centrifuged again, and the supernatant was submitted to Western blotting as previously described (84).
Western blotting
Samples were separated in SDS-PAGE and transferred to polyvinylidene difluoride membranes (Millipore), which were next incubated overnight with primary antibodies at 4°C. Subsequently, membranes were washed in TBS-T buffer (20 mM tris, 200 mM NaCl, 0.1% Tween 20; pH 7.6), incubated with peroxidase-conjugated secondary antibodies, and developed using an ECL chemiluminescence kit (Thermo Scientific) or ECF fluorescence kit (GE Healthcare). Images were acquired in a Typhoon FLA 9000 system or ChemiDoc XRS System (Bio-Rad), exported using Image Lab software (Bio-Rad), and quantified by FIJI software. All antibody sources and concentrations used for Western blotting are described in table S4.
Total RNA extraction, cDNA synthesis, and qRT-PCR
Primary retinal microglia cultures were harvested in 1 ml of TRI Reagent (Sigma). Total RNA was extracted using the Direct-zol RNA MiniPrepkit (Zymo Research) according to the manufacturer’s instructions, and its quality and concentration were determined using the NanoDrop ND-1000 Spectrophotometer (Thermo Scientific). Complemetary DNA (cDNA) synthesis was performed using 500 ng of total RNA (deoxyribonuclease I–treated) with the SuperScript III First-Strand Synthesis SuperMix for qRT-PCR (Life Technologies). qRT-PCR was carried out using the iQ SYBR Green Supermix (Bio-Rad) on an iQ5 multicolor real-time PCR detection system (Bio-Rad). The efficiency was analyzed using a log-based standard curve (with cDNA pooled from all samples) for each gene, as previously described (16). Expression of PCR transcripts in different experimental groups of microglial cell cultures was calculated using the