C
C
C
C
S
S
R
R
O
O
A
A
D
D
M
M
A
A
P
P
F
F
O
O
R
R
P
P
O
O
R
R
T
T
U
U
G
G
A
A
L
L
P
P
H
H
A
A
S
S
E
E
I
I
D
D
e
e
l
l
i
i
v
v
e
e
r
r
a
a
b
b
l
l
e
e
1
1
C
C
O
O
22T
T
R
R
A
A
N
N
S
S
P
P
O
O
R
R
T
T
A
A
N
N
D
D
S
S
T
T
O
O
R
R
A
A
G
G
E
E
O
O
P
P
T
T
I
I
O
O
N
N
S
S
A
A
N
N
D
D
R
R
I
I
S
S
K
K
S
S
September 2014
Co-funded by
PU Public
PP Restricted to other programme participants
RE Restricted to a group specified by the consortium
CO Confidential, only for members of the consortium
Version Submitted by Review Level* Date Submitted Reviewed
Version 2 UÉvora 30 Sept.2014
* WPL, MB, AB
Editors
Name (organization) e-mail
Leading participant Júlio Carneiro (U. Évora) Ferreira Marques (REN)
[email protected] Contributing participants Paulo Mesquita (U. Évora)
Vitor Fernandes (REN) João Toscano (U. Évora)
[email protected] [email protected] [email protected]
Executive Summary
This report constitutes Deliverable 1 of the approved proposal CCS roadmap for Portugal - WORK PLAN, as of 24 November 2013.
Deliverable 1 attempts to clarify the options and risks for CO2 transport and geological storage in Portugal. Previous CCS studies in Portugal, namely the FP7 COMET project and the nationally funded KTEJO project, have conducted site screening for storage locations and defined the most economic pipeline corridors. However, those projects have focused solely on the technical and economic issues. No discussion of the existing alternatives was made and risks associated to those alternatives have not been identified.
This report aims at clarifying the following issues:
Are there geological conditions in Portugal for safe and permanent CO2 storage? What is the location and capacity of potential storage sites? What are the risks and costs involved? What is the best option for CO2 transport in the country? What are the risks and costs
involved? Is there a role for transport by ship?
What activities may have conflicting interests or gain from synergies with the implementation of CO2 storage?
Answer to these questions and this report are provided as a technical background to sub-task 1.1- scenarios of role and need for CCS - sub-task 1.3- economic impact and business opportunities - as well as for task 2 - Communication Process – of the CCS roadmap for Portugal, phase I.
Keywords CO2 transport and storage, transport and storage risk, costs, conflicts and synergies, pipeline networks, transport by ship.
ACKNOWLEDGEMENTS
Authors would like to thank all the institutions that have supplied data for the consecution of these results. In particular, DPEP (the Portuguese Division for Oil Exploration and Production) is gratefully acknowledged for providing access to technical reports and databases. We are grateful to all COMET and KTEJO project partners and to all researchers involved in the storage capacity assessments conducted in those projects: Alexandre Araújo, António Correia, Fátima Cardoso, Carlos Ribeiro, Augusto Costa, Carlos Rosa, Diogo Rosa, Elsa Ramalho, Helena Amaral, João Carvalho, José Borges, José Sampaio, Mourad Bezzeghoud, Nadine Pereira, Pedro Terrinha, Susana Machado, Tiago Cunha, Maria Olho Azul and Pablo Gentil.
i
TABLE OF CONTENTS
FIGURES ... iii TABLES ... vi ACRONYMS ... vii 1. INTRODUCTION ... 12. OPTIONS AND RISKS FOR CO2 STORAGE ... 2
2.1. FUNDAMENTALS ABOUT CO2 STORAGE... 2
2.2. STORAGE SITES AND CAPACITY IN PORTUGAL ... 7
2.2.1. Site screening criteria ... 8
2.2.2. Potential storage areas ... 10
2.2.3. Storage capacity ... 16
2.2.4. Storage clusters ... 18
2.3. STORAGE COSTS ... 20
2.3.1. Storage costs components ... 20
2.3.2. Estimating injection rates and number of wells ... 21
2.3.3. Storage cost per selected area and cluster ... 24
2.3.4. Average onshore and offshore storage costs ... 25
2.4. RISKS AND RANKING OF STORAGE SITES ... 26
2.4.1. Risk assessment methodology ... 26
2.4.2. Implementation of the risk assessment methodology ... 30
2.4.3. Results of the SRF approach ... 30
2.4.4. Seismo -Tectonic hazard ... 36
2.5. OPTIONS FOR CO2 STORAGE IN PORTUGAL ... 42
2.5.1. Methodology – Regions of influence of clusters ... 42
2.5.2. Base case - all clusters considered ... 43
2.5.3. Offshore storage only ... 44
2.5.4. Allowing storage in Spain ... 45
2.5.5. Offshore storage, only sites with best risk ranking ... 45
2.6. Summary of CO2 storage options and risks ... 47
3. OPTIONS AND RISKS FOR CO2 TRANSPORT ... 49
3.1. FUNDAMENTALS ABOUT CO2 TRANSPORT ... 49
3.2. PIPELINE NETWORK ... 55
ii
3.3. TRANSPORT COSTS ... 56
3.3.1. Transport costs components ... 56
3.3.2. Transport cost estimates ... 58
3.4. TRANSPORT RISKS ... 60
3.4.1. CO2 transport risk assessment methodologies ... 60
3.4.2. Identification of main risks along pipeline corridors ... 65
3.5. SHIPS AS AN ALTERNATIVE TO TRANSPORT BY PIPELINE. ... 71
3.5.1. Break-even distance and mass flow for transport by ship ... 72
3.5.2. Possibilities for transport by ship in Portugal ... 72
3.5.3. Possibilities for transport by ship in point-to-point connections ... 74
3.6. Summary of CO2 transport options and risks ... 77
4. CONFLICTS AND SYNERGIES WITH OTHER ACTIVITIES ... 78
4.1. ONSHORE STORAGE ... 78
4.1.1. Underground activities ... 80
4.1.2. Surface activities ... 84
4.2. OFFSHORE STORAGE ... 87
4.3. SUMMARY OF CONFLICTS AND SYNERGIES ... 91
REFERENCES ... 96 APPENDIX A - Database for estimating storage capacity in the selected areas and basin.
APPENDIX B - Complementary data and results from the implementation of the SRF approach. (online version only)
APPENDIX C - Consequences from the pipeline rupture events. (online version only)
APPENDIX D - Comparison of consequences from a CO2 pipeline and a natural gas pipeline releases. (online version only)
iii
FIGURES
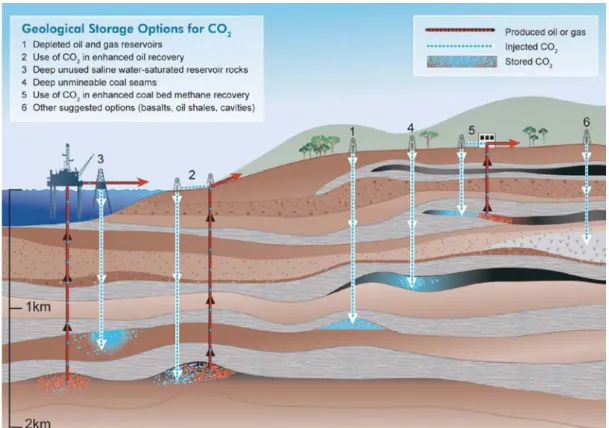
Fig. 1- Options for storage of CO2 in geological formations (Metz et al., 2005). ... 3
Fig. 2 - CO2 phase diagram (Bachu, 2000) ... 3
Fig. 3 - Increasing storage effectiveness for CO2 with depth. Note that above critical depth, CO2 is in gaseous state (balloons); below critical depth it is in liquid-like state (droplets). Volumetric relationship shown by blue numbers (e.g. 100 m3 of CO2 at surface would occupy 0.32 m3 at a depth of 1 km) (CO2CRC, 2008). ... 4
Fig. 4 - Schematic representation of rising CO2 plume. ... 4
Fig. 5 - Physical Trapping of CO2. a) CO2 is trapped under the folded cap-rock, unable to move out of the anticline; b) CO2 is retained when there is a sudden change in the permeability of the rock formations, a discontinuity; c) a fault can align a reservoir with an impermeable formation preventing the migration of CO2 or the fault can be sealed by impermeable material; d) CO2 can be immobilized by a facies variation, in which the reservoir looses permeability (CO2CRC, 2011). ... 5
Fig. 6 – Storage security. Over time, the relevance of the more stable and reliable geochemical trapping increase, while the importance of physical trapping, essentially in the injection phase, decrease (CO2CRC, 2008). ... 5
Fig. 7 - Techno-Economic Resource-Reserve pyramid for CO2 storage capacity (CSLF, 2007) ... 6
Fig. 8 – a) Sedimentary basins in Portugal; b) Oil exploration data available (in 2011) for the site screening in Portugal. Lines – Seismic surveys, yellow circles – offshore boreholes, red circles – onshore boreholes. ... 7
Fig. 9 – a) Stratigraphy of Porto Basin and indication of reservoir and cap-rock pairs. b) Location of selected areas. ... 11
Fig. 10 – a) Stratigraphy of the offshore Lusitanian Basin and indication of reservoir and cap-rock pairs. b) Location of selected areas in the offshore Lusitanian. ... 12
Fig. 11 – a) Stratigraphy of the Sines/Santiago do Cacém sector and indication of reservoir and cap-rock pairs. b) Location of selected areas in the Sines/Santiago do Cacém sector. ... 13
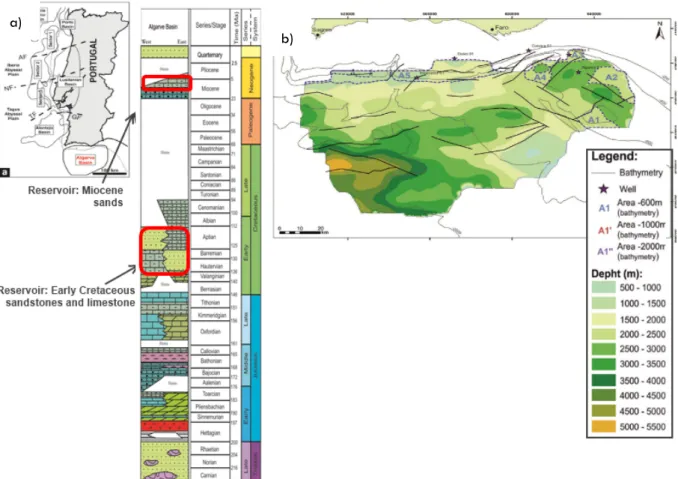
Fig. 12 – a) Stratigraphy of the Algarve basin and indication of reservoir and cap-rock pairs. b) Location of selected areas in the Algarve basin. ... 15
Fig. 13 – a) Stratigraphy of the onshore Lusitanian Basin and indication of reservoir and cap-rock pairs. b) Location of selected areas in the onshore Lusitanian Basin. ... 16
Fig. 14- Criteria for selecting the efficiency factor in open to closed aquifers. After Vangkilde-Pedersen et al. (2009). ... 17
Fig. 15 - Location of storage sites and capacity per cluster (S# refers to cluster number, see section 2.2.4 for explanation). ... 19
Fig. 16 – a) Injection rate; b) number of injection wells per selected area ... 23
Fig. 17 - Storage costs: a) per selected area; b) per cluster. ... 24
Fig. 18 – Schematic representation of risks linked to CO2 storage (Oldenburg, 2008). ... 27
Fig. 19 – SRF calculation process, according to Li et al. (2013). ... 28
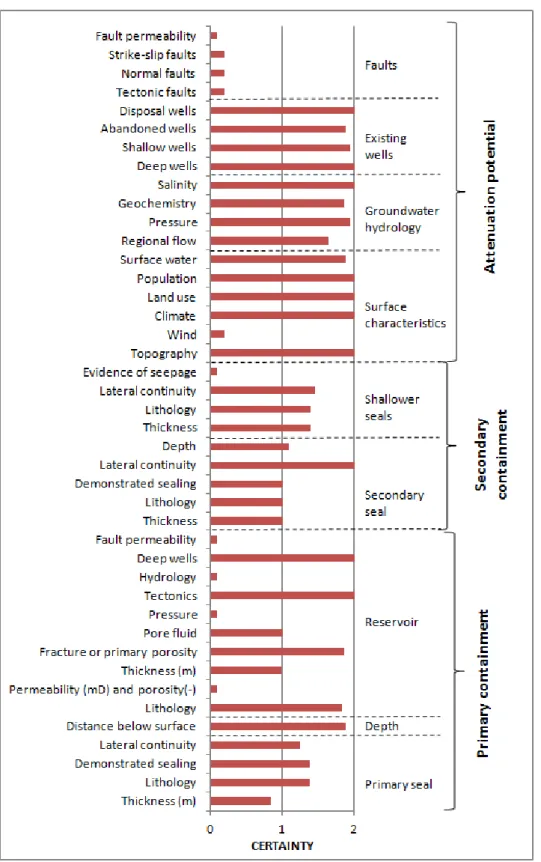
Fig. 20 – Average Certainty factor (Ck,n) for every property in the SRF approach. ... 31
iv
Fig. 22 – Average Attribute Assessment (Sk,n) adopted for every property in the SRF approach. ... 34 Fig. 23 – SRF approach Attribute Assessment (Sk,n) per Characteristic and per storage site. ... 35 Fig. 24 – SRF risk ranking for: a) all storage sites, grouped by cluster, and; b) average for each clusters. ... 36 Fig. 25 – Tectonic framework of mainland Portugal, showing the main active faults, including the accretionary wedge south from the Algarve and the main historical and instrumental earthquakes in Portugal and Atlantic margin (see list in Table 11)... 37 Fig. 26 – a) Location with instrumental earthquakes with M≥3 in Portugal and Atlantic; b) Seismic hazard in Portugal – 5% exceedance probability in 975 years (adapted from Montilla and Casado, 2002); c) Maximum seismic velocities in the cluster S05 area in finite difference simulation of an earthquake equivalent to the 1755 earthquake with epicentre at the Gorringe Bank. Also shown the selected storage basins. ... 40 Fig. 27 – Graphic representation of risk ranking and storage costs per cluster. ... 42 Fig. 28 – a) Integrated cost distance map for transport and storage of 1Mt CO2; b) CCS Regions considering all clusters. Black dots refer to the hypothetic injection site of a given cluster, and grey lines define the limits of CCS regions. Orange dots are the main stationary sources in Portugal. Only two storage clusters would be active, S05 and S42. The region of influence of clusters S01 and S07 do not reach the onshore, and all other clusters are not cost effective even for sources located nearby. ... 44 Fig. 29 - CCS Regions considering only offshore storage. The S# region delimits the area in which it is cost-effective to transport and storage to the # cluster. The black dots represent the hypothetic injection site of each cluster. ... 45 Fig. 30 - CCS Regions allowing storage in Spain. The S# region delimits the area in which it is cost-effective to transport and storage to the # cluster. The black dots represent the hypothetic injection site of each cluster. ... 46 Fig. 31 - CCS Regions for offshore storage, removing the higher risk clusters in the Algarve and Sines, and allowing storage in Spain. The S# region delimits the area in which it is cost-effective to transport and storage to the # cluster. The black dots represent the hypothetic injection site of each cluster. ... 46 Fig. 32 - CO2 Temperature – Pressure Diagram. Adapted from DNV (2010b). ... 49 Fig. 33 – Mass density of pure CO2. Adapted from DNV (2010b). ... 51 Fig.34 – Effect of selected chemical components on phase envelope. Comparison with natural gas. Adapted from DNV (2010b). ... 52 Fig. 35 – Solubility of water in pure CO2. Adapted from DNV (2010b). ... 53 Fig. 36 – All viable transport corridors according to the COMET scenarios. Some of the corridors represent alternative connections between the same locations. ... 55 Fig. 37 – Transports costs variation per pipeline, according to the several COMET scenarios. The blue lines show the range of variation in the COMET scenarios (varying CO2 flow rate) and black square shows the mean value. ... 59 Fig. 38 –QRA Quantitative Risk Analysis. Risk estimation, analysis and evaluation. Adapted from NORSOK (2001) ... 60 Fig. 39 – CO2 dose-fatality relationship. Adapted from Energy Institute (2010). ... 62
v
Fig. 40 – Risk Matrix. Adapted from CO2EUROPIPE (2011). ... 63 Fig. 41 - a) SLOD equivalents, 32 barg release; b) SLOD equivalents, 15 barg release; c) SLOT equivalents, 32 barg release; d) SLOD equivalents, 32 barg release. Adapted from HSE (2009). ... 70 Fig. 42 – Schematic configuration of CO2 transport by ship. After DNV (2011) ... 71 Fig. 43 – Comparison of vessel and pipeline transport; Distance-mass flow combinations with a cost advantage for vessel transport (blue shaded area) and for offshore pipeline (red area); iso-cost curves [€/t] (dashed). Source: Geske and Berghout (2012). ... 72 Fig. 44 – Possible connections to ports and ship routes studied in the COMET project for the Portuguese case study. Adapted from Geske and Berghout (2012). ... 73 Fig. 45 – Point-to-point analysis of transport by ship. Maximum capacities for cost-effective ship transport from each of the studied ports to the offshore storage clusters ... 75 Fig. 46 – Ratios between transport cost by ship and transport cost by pipeline for connection between ports and storage clusters. Values below 1 indicate cost-effective connections by ship values above indicate cost-effective transport by pipeline. ... 76 Fig. 47 –Administrative boundaries of municipalities in the offshore cluster S05... 78 Fig. 48 – Characteristics and existing activities in the onshore cluster S05: Hydrocarbon exploration concessions, mineral groundwater resources, mines and quarries. ... 81 Fig. 49 – Schematic representation of structural geology impact due to halokynetic movements. Adapted from Kullberg (2000)... 82 Fig. 50 – Characteristics and existing activities in the onshore cluster S05: Population density. ... 84 Fig. 51 – Characteristics and existing activities in the onshore cluster S05: Land use (COS 2010) ... 85 Fig. 52 – Characteristics and existing activities in the onshore cluster S05: Environmental protected areas, tourism and heritage sites. ... 86 Fig. 53 – Map with existing offshore activities (according to POEM (2012). ... 92
vi
TABLES
Table 1 – Criteria for screening sedimentary basins. Adapted from CO2CRC (2008). ... 9
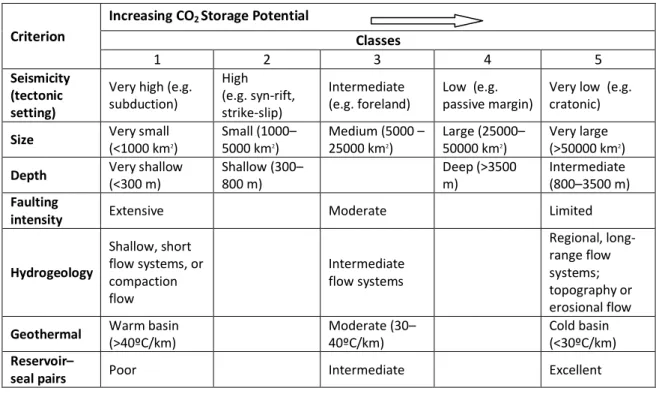
Table 2 – Screening criteria applied in the COMET project. Compiled after Martínez et al. (2010)... 9
Table 3 – Parameters used in the storage capacity calculation and sources of data. ... 18
Table 4 – Main features of storage clusters. ... 19
Table 5 – Storage costs components and basic costs. ... 20
Table 6 - Parameters and sources of data. ... 22
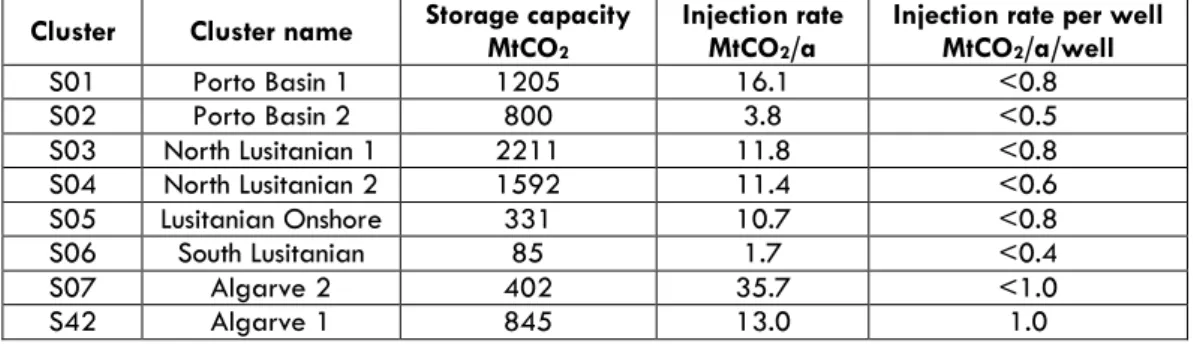
Table 7 – Injection rates and storage costs per cluster. ... 23
Table 8 – Storage costs per cluster. ... 24
Table 9 – Indicators, attributes, properties and weights of SRF approach. ... 29
Table 10 – SRF results per cluster, considering the average results for the storage sites in each cluster. The boundary between FAIR and GOOD is given by Tn=3. ... 35
Table 11 – Main historical and instrumental seismic events in mainland Portugal and its Atlantic margin (compiled from Bezzeghoud et al. 2012 and Instituto Português do Mar e da Atmosfera, Lisbon, Portugal). ... 38
Table 12 – Risk ranking (higher Tn indicates increased security) and storage costs per cluster. .. 42
Table 13 - Summary of CO2 storage prospects per cluster ... 48
Table 14 – CO2 Properties. Adapted from DNV (2010b). ... 50
Table 15 – Indicative compositions of CO2 streams /IEA GHG/. Unit % by volume. Adapted from (DNV, 2010b). ... 52
Table 16 – List of viable pipeline corridors and characteristics. Some of the corridors represent alternative connections between the same locations. ... 56
Table 17 – Terrain factors and pipeline basic costs. ... 57
Table 18 – Average transport costs to onshore and offshore storage sites. ... 58
Table 19 – Exposure reactions to carbon dioxide. Adapted from Energy Institute (2010). ... 62
Table 20 – SLOT and SLOD values for carbon dioxide. Adapted from Energy Institute (2010). 62 Table 21 – Derived probability of fatality for carbon dioxide. Adapted from Energy Institute (2010)... 62
Table 22– Summary of hazard and risk analysis ... 64
Table 23 - Identification of main risks along corridors threads and hazards. Adapted from DNV (2010b). ... 66
Table 24 – Matrix of distances between ports and storage clusters. ... 74
Table 25 –Average captured CO2 at the emission cluster closer to ports. ... 76
Table 26 – List of characteristics and activities with potential synergies and/or conflicts in cluster S05 ... 79
vii
ACRONYMS
CCS (CO2 Capture and Storage), 1 COF (consequence of failure), 64
DPEP (Divisão para a Pesquisa e Exploração de Petróleo), 8 DTL (dangerous toxic load), 62
ECBM (Enhanced Coal Bed Methane), 2 EOR (Enhanced Oil Recovery), 2
GCCSI (Global CCS Institute), 1
HSE (health, safety, and environmental), 26
OMM (Operating, Maintenance, and Monitoring), 20 POF (probability of failure), 64
QRA (Quantitative Risk Analysis), 62 RAC (Risk acceptance criteria), 64 SLOD (significant likelihood of death), 62 SLOT (specific level of toxicity), 62
SRF (Screening and Ranking Framework), 27 WIM (West Iberia Margin), 10
1
1. INTRODUCTION
This report attempts to clarify the risks, advantages and disadvantages of the CO2 transport and storage opportunities in Portugal. Previous CCS (CO2 Capture and Storage) studies in Portugal,
namely the FP7 COMET project (Boavida et al., 2013) and the nationally funded KTEJO project (Pereira et al., 2011), were responsible the first regional-scale assessments of CO2 storage opportunities in the country and defined the cost-effective pipeline corridors. Those projects have focused on the geological requirements for safe CO2 storage and on the economic costs for defining CO2 transport corridors. No discussion of the existing alternatives (e.g., onshore vs. offshore storage, preferential storage sites, conflicts and synergies for different storage, etc.) was made and risks associated to those alternatives have not been identified.
Building on the results of those projects and complemented by the research now undertaken in terms of risks, conflicts and synergies, this report aims at clarifying the following issues:
• Are there geological conditions in Portugal for safe and permanent CO2 storage? What is the location and capacity of potential storage sites? What are the risks and costs involved?
• What is the best option for CO2 transport in the country? What are the risks and costs involved? Is there a role for transport by ship?
• What activities may have conflicting interests or gain from synergies with CO2 storage? This report is provided as a technical background to the CCS Roadmap for Portugal – Phase I, a project co-funded by the GCCSI (Global CCS Institute) and undertaken by a consortium comprising the Universidade Nova de Lisboa, Universidade de Évora, Laboratório Nacional de Energia de Geologia, REN - Redes Energéticas Nacionais (the transmission system operator in Portugal), and the Bellona Foundation. The report is the main deliverable from sub-task 1.2 -
Risks and options in storage and transport – and was coordinated by the Universidade de Évora,
with REN being responsible for the sections related to CO2 pipeline by transport, benefiting from the company vast know-how in natural gas transport .
The report is organised as follows:
• Chapter 2 addresses the options and risks for CO2 storage in Portugal, identifying the existing storage capacity (section 2.2), costs estimated (section 2.3), risks and ranking of storage sites (section 2.4) and what options may be realistically pursued in the country (section 2.5);
• Chapter 3 focuses on the transport component of the CCS chain, including an analysis of the pipeline network under certain scenarios (section 3.2), their costs (section 3.2) and risks (3.4). Section 3.5 discusses the possibility of CO2 transport by ship;
• Chapter 4 addresses the synergies and constraints with other activities identified for CO2 storage onshore (section 4.1) and offshore (4.2).
Sections 2.1 and 3.1 describe the fundamental technical issues about CO2 storage and transport, respectively, and provide enough background for the analysis of the Portuguese case, but they are not intended to present a state-of-the-art review on the CCS technology. The interested reader is directed to the several authoritative references mentioned in those sections.
2
2. OPTIONS AND RISKS FOR CO
2STORAGE
2.1. FUNDAMENTALS ABOUT CO
2STORAGE
Rocks are the largest reservoir of carbon on the planet, holding it in the form of coal, hydrocarbons and carbonated rocks. Storage of carbon is a natural process in the upper crust of the earth, acting on scale of hundreds of millions of years.
Geological storage of carbon dioxide aims to mimic that natural process, trapping CO2 from anthropogenic sources into deep geological formations for long periods of time, on the order of hundreds to thousands of years, preventing it from being released to the atmosphere and mitigating its greenhouse gas effect.
The operational aspects of storage of CO2 in geological formations are based on the mechanisms and technologies developed by the oil and gas industry, where injection of CO2 in geological formations is a common practice since 1972. CO2 is injected to maintain pressure in the reservoirs, increase mobility and facilitate the extraction of hydrocarbons, a process designated as EOR (Enhanced Oil Recovery). Thus, the concept of CO2 injection in deep geological formations is not new, and storage of CO2 as a methodology for climate change mitigation is based on the successful experience in the oil sector.
There are several options for geological storage of CO2 (Fig. 1): 1. Depleted oil and natural gas reservoirs;
2. Use of CO2 in EOR; 3. Deep saline aquifers;
4. Use of CO2 in ECBM (Enhanced Coal Bed Methane); 5. Unminable coal seams;
6. Other geologic environments (basalts, CO2 hydrates, mineral carbonation, etc.).
Saline aquifers, depleted hydrocarbon reservoirs and the use of CO2 in EOR are indicated as the main options for CO2 storage, in all cases requiring permeable rocks (sandstones, limestones, ...) found in the extensive sedimentary basins existing in many parts of the world. All other possibilities (items 4 to 6 above) are in a less advanced stage of research.
Deep saline aquifers are considered to have the largest potential capacity for CO2 storage due to the distribution of sedimentary basins in the world. Deep saline aquifers are porous and permeable sedimentary formations, capped by an impermeable layer (the cap-rock or seal) that allows the storage of fluids at pressures above the atmospheric pressure. For CO2 storage, aquifers must be at great depths, typically greater than 700-800 m, and saturated with high salinity groundwater unsuitable for drinking, agricultural or industrial uses (CO2CRC, 2008). However, knowledge about the distribution and characteristics of deep saline aquifers is reduced, when compared to the existing data about hydrocarbon reservoirs, and assessing their potential for CO2 storage involves large uncertainty due to limited data. Moreover, the data usually available to characterize the cap-rock is even scarcer, since it is usually not tested during hydrocarbons exploration (CO2CRC, 2008).
3
CO2 storage in oil and natural gas fields can be made during the production stage, when used in EOR, or in depleted reservoirs that are no longer in production. The EOR technology is used by the oil and gas industry for several decades. However, there are disadvantages in the use of depleted hydrocarbon fields since the physical size of the trap can be a stratigraphic or structural constraint, limiting the storage potential. It should also not be neglected the possibility that hydrocarbon production may have led to the collapse of the pores and substantially reduce the storage capacity. The existence of old wells that are potential leak points is a further concern.
The CO2 storage operation involves the injection of the fluid, through injection wells, preferably in supercritical phase, at pressures and temperatures above the critical point, T=31.1 °C and P=7.38 MPa (Bachu, 2003) (Fig. 2). Both temperature and pressure increase with depth but have opposite effects on the density of CO2. Density increases rapidly with rising pressure, but it tends to stabilize or decrease with increasing temperature, depending on the local geothermal gradient. Based on the global average geothermal gradient and hydrostatic pressure, supercritical CO2 should be reached at about 800m depth. Hence, the reservoir selection should focus on depths greater than this threshold.
Fig. 3 illustrates the behaviour of CO2 with depth, increasing the density and reducing the reservoir volume required for storage. Although injected in the supercritical state, CO2 will remain less
Fig. 2 - CO2 phase diagram (Bachu, 2000)
4
dense (<800 kg/m3) than the typical existing brine in sedimentary basins. It will therefore tend to migrate by buoyancy to the top of the reservoir (Fig. 4). The storage of CO2 in porous and permeable formations is only possible with the existence or formation of a sealing cap-rock, physically trapping the CO2 in the reservoir.
However, this is not the only trapping mechanism. Trapping of CO2 in the reservoir occurs by various processes:
Physical trapping - the free phase CO2 is physically trapped in structural or stratigraphic trap originated by the geometric arrangement of the reservoir and the cap-rock units (Fig. 5);
Residual trapping - CO2 is trapped in the pores without connectivity, by capillary pressures, and/or is adsorbed on the surface of some minerals, becoming immobile; Dissolution trapping - CO2 is dissolved in the pore water, eventually leading to an increased density of the brine, which will then sink to the bottom of the reservoir, removing the risk of leakages to the surface;
Hydrodynamic trapping - the dissolved and free-phase CO2 moves according to very small regional/basin scale hydraulic gradients, with very low flow velocities (leading to geological scale residence times) increasing the contact of the CO2 plume with the formation water and promoting residual and dissolution trapping;
Fig. 3 - Increasing storage effectiveness for CO2 with depth. Note that above critical depth, CO2 is in
gaseous state (balloons); below critical depth it is in liquid-like state (droplets). Volumetric relationship shown by blue numbers (e.g. 100 m3 of CO2 at surface would occupy 0.32 m3 at a depth of 1 km)
(CO2CRC, 2008).
5
Mineral trapping or mineral carbonation - CO2 reacts with water and minerals from the reservoir and precipitates, forming new carbonate minerals and becoming permanently stored in the solid phase.
Trapping of CO2 is not achieved by just one type of mechanism. Throughout the storage period, the relevancy of different trapping mechanisms will vary over time, contributing for increased security storage along time (Fig. 6). Selection of sites for storing significant volumes of CO2 involves progressively more detailed geological assessments (CSLF, 2007):
• Country-scale assessment - high level of assessment performed for a contiguous geographic area defined by national jurisdiction (country) and usually encompasses several sedimentary basins;
• Basin-scale assessment - level of assessment focusing on a particular sedimentary basin to evaluate and quantify its storage potential and to identify the best (or more prospective) regions and/or sites for CO2 storage and their type;
• Regional-scale assessment - increasing level of detail for a large, geographically-contiguous portion of a sedimentary basin, usually defined by the presence of large CO2 sources and/or by its known large potential for CO2;
• Local-scale or (Prospect-Level) Assessment - usually performed at a preengineering level when one or several candidate sites for CO2 storage are examined to determine site capacity, injectivity and containment prior to site-selection decisions
Fig. 5 - Physical Trapping of CO2. a) CO2 is trapped under the folded cap-rock, unable to move out of the
anticline; b) CO2 is retained when there is a sudden change in the permeability of the rock formations, a
discontinuity; c) a fault can align a reservoir with an impermeable formation preventing the migration of CO2
or the fault can be sealed by impermeable material; d) CO2 can be immobilized by a facies variation, in which
the reservoir looses permeability (CO2CRC, 2011).
Fig. 6 – Storage security. Over time, the relevance of the more stable and reliable geochemical trapping increase, while the importance of physical trapping, essentially in the injection phase, decrease (CO2CRC, 2008).
6
• Site-scale Assessment - performed for the specific storage unit (hydrocarbon reservoir, deep saline aquifer or coal bed), usually to model the behaviour of the injected CO2 (it is equivalent to the reservoir scale in petroleum engineering).
The storage capacity calculations are often framed in terms of the Techno-Economic Resource-Reserve Pyramid (CSLF, 2007), shown in Fig. 7 which considers three levels of storage capacity estimate:
• Theoretical Storage Capacity - the physical limit of what the geological system can accept;
• Effective Storage Capacity - obtained by applying a range of technical (geological and engineering) cut-off limits to a storage capacity assessment, including consideration of that part of theoretical storage capacity that can be physically accessed;
• Practical (or Viable) Storage Capacity - obtained by considering technical, legal and regulatory, infrastructure and general economic barriers to CO2 geological storage; • Matched Storage Capacity - detailed matching of large stationary CO2 sources with
geological storage sites that are adequate in terms of capacity, injectivity and supply rate.
Depending on the scale of the study, different criteria are evaluated, but the increased level of selection involves a greater amount of information, and study time, with a corresponding increase in costs. The progressive increase in detail in the identification and characterization of storage locations reduces inaccuracies but, usually, also reduces the previously estimated storage capacity.
7
2.2. STORAGE SITES AND CAPACITY IN PORTUGAL
This section provides the essential information about the storage capacity assessment conducted within the scope of the projects COMET and KTEJO. A detailed description can be found in Report D3.4 of the project COMET (Martínez, 2013). The assessment was conducted at regional-scale, although a basin-scale assessment was first performed, in order to discard areas clearly unsuitable for CO2 storage.
Despite the ongoing exploration efforts, exploitable hydrocarbon fields are yet to be identified in Portugal. There are well studied coal seams in the Palaeozoic Douro coal basin, mined until 1994, but the basin is highly faulted and folded. Although studies are being conducted to assess its storage capacity (Lemos de Sousa et al., 2007), it does not seem an immediately valid CO2 storage option. Less common options for geological storage of CO2, such as mafic rocks, CO2 hydrates and mineral carbonation, are not addressed in this report, although there may be some potential for their application in Portugal (Bernardes et al., 2013). Thus, the storage capacity assessment focused on saline aquifers in sedimentary basins1
More than two thirds of Portugal is underlain by basement (Variscan) igneous and metamorphic rocks from the Palaeozoic and, occasionally, from the Proterozoic, where geological storage of CO2 is not feasible. Along the margins of these basement rocks, the following sedimentary basins were formed (
.
Fig. 8a):
1 To avoid ambiguity with the traditional use in Portugal of the term ‘aquifer’, referring to permeable rocks saturated with potable
groundwater or groundwater with some economic value, throughout this report we will prefer the term ‘Reservoir’ to refer to deep saline aquifers, since these are by definition saturated with groundwater that is not potable and is not being used for any other purpose.
a) b)
Fig. 8 – a) Sedimentary basins in Portugal; b) Oil exploration data available (in 2011) for the site screening in Portugal. Lines – Seismic surveys, yellow circles – offshore boreholes, red circles – onshore boreholes.
8
• the Meso-cenozoic Basins on the Western Iberian Margin, including the Lusitanian Basin and the Porto Basin. For the purposes of this report, the southern sector of the Lusitanian Basin is hereafter designated as the Sines/Santiago do Cacém sector.
• the Meso-cenozoic Algarve Basin, along the south margin of the Portuguese territory; • the Cenozoic Tagus/Sado Basin, a sedimentary basin developed entirely onshore. The Lusitanian and Algarve Basins extend from onshore to the shallow offshore (defined by a water depth <200m). Together with the entirely offshore Porto Basin, the Lusitanian and the Algarve basins compose most of the continental shelf, with a volume of sedimentary rocks larger than the onshore volume. Hence, offshore CO2 storage is necessarily a possibility worth considering in Portugal.
The sedimentary sequence in the Tagus/Sado Basin is thinner than in the other basins, although in some areas its base can reach 1000 m depth. This basin includes some of the most productive freshwater aquifers in Portugal (Almeida et al., 2000; 2006), being recharged by rainfall or by drainage from overlying water table aquifers. Basin-scale assessment indicated that it does not meet the basic requirements for CO2 storage and it is not further addressed in this report.
The Information about deep sedimentary geology (i.e., at more than 800 m depths) of continental Portugal is scarce and almost entirely restricted to the boreholes and 2-D seismic surveys conducted for oil exploration purposes (Fig. 8b). The CO2 site screening assessment in
Portugal was conducted resorting to the DPEP (Divisão para a Pesquisa e Exploração de Petróleo) database, the most reliable source about geology of the sedimentary basins in the country, which comprised, at the time, 110 onshore boreholes deeper than 100 m, of which around 50 were deeper than 500 m. The number of offshore boreholes is smaller, totalling some 30 boreholes, although generally deeper than the onshore boreholes. Both the onshore and offshore sectors are well covered by 2-D seismic lines. The DPEP database is maintained updated and it is an invaluable source of information for any future studies about CO2 storage in Portugal.
In the last few years the oil exploration activities in the country have increased, with new geophysical surveys (2-D seismic, 3-D seismic and aeromagnetic surveys) being conducted, as well as new boreholes being drilled onshore. Results of these recent surveys and boreholes are not yet publicly available and were not used in the site screening process, but it is intended to update the site screening once that information becomes public.
2.2.1. Site screening criteria
CO2CRC (2008), based on Bachu (2003), indicates sixteen criteria for basin-scale site screening, related to the containment security, the volume of storage capacity and the economic or technological feasibility. Several of the criteria do not apply to the sedimentary basins in Portugal (for instance there are no mature hydrocarbon fields) or do not allow distinguishing between different areas of the basin (e.g., hydrocarbons exploration is ongoing in the entire basin, climate is moderate, accessibility is easy, and infrastructures for CO2 storage are inexistent). A first basin-scale assessment in Portugal applied the criteria in Table 1, adapted from the CO2CRC (2008) extended list, and led to discarding the Tagus/Sado basin and the onshore south sector of the Lusitanian basin.
The regional-scale assessment followed a set of criteria defined in the COMET project and described in its deliverable D3.1 (Martínez et al., 2010), but is in essence very similar to the criteria recommended by Chadwick et al. (2008), and are represented in Table 2.
9
Table 1 – Criteria for screening sedimentary basins. Adapted from CO2CRC (2008).
Table 2 – Screening criteria applied in the COMET project. Compiled after Martínez et al. (2010). Criterion
Increasing CO2 Storage Potential
Classes
1 2 3 4 5
Seismicity (tectonic setting)
Very high (e.g. subduction)
High (e.g. syn-rift, strike-slip)
Intermediate
(e.g. foreland) Low (e.g. passive margin) Very low (e.g. cratonic)
Size Very small (<1000 km2)
Small (1000– 5000 km2) Medium (5000 – 25000 km2) Large (25000– 50000 km2) Very large (>50000 km2)
Depth Very shallow (<300 m) Shallow (300–800 m) Deep (>3500 m) Intermediate (800–3500 m) Faulting
intensity Extensive Moderate Limited
Hydrogeology Shallow, short flow systems, or compaction flow Intermediate flow systems Regional, long-range flow systems; topography or erosional flow
Geothermal Warm basin (>40ºC/km) Moderate (30– 40ºC/km) Cold basin (<30ºC/km) Reservoir–
seal pairs Poor Intermediate Excellent
Storage capacity
Porosity 6 to 15% porosity, storages will be taken in account depending on other parameters.
More than 15% porosity, storages will be considered. Trap type Aquifer traps and regional aquifers.
Effective Pore volume Discard capacities lower than 3Mt, to ensure minimum storage of 30 years at injection rate 0.1Mt/a.
Depth of reservoir Structures and formations whose top is placed at 800 metres or higher depths to ensure supercritical conditions. Depths smaller than 2,500 metres due to decrease of effective porosity with depth
Injectivity
Trap type Open traps / open aquifers to be favoured over closed traps/closed aquifers to ensure les pressure build up.
Permeability Permeability preferably above 200 mD for a specific reservoir to provide sufficient injectivity. Lower permeability considered depending on other parameters.
Rock mechanics, diffusivity, evolution of piezometry.
Maximum pressure increases related to the geo-mechanical characteristics of the aquifer, and its propagation into the aquifer governed by diffusivity. Geo-mechanical and diffusivity parameters should be taken into account whenever information is available.
Integrity of seal
Permeability Permeability of sealing rocks low enough to prevent CO2 from flowing from the
storage. Maximum permeability of 10-2 mD Seal thickness Sealing rock thicker than 50 metres. Faulting and tectonic
activity Less faulted formations favoured. The regional tectonic activity to be considered from seismo-tectonic maps and recent seismic records. Discard formations/traps crossed by active faults.
Homogeneity of seal
10 2.2.2. Potential storage areas Porto Basin
The Porto Basin is located in the northern WIM (West Iberia Margin), which evolved through a sequence of rift episodes, between the Late Triassic and Early Cretaceous, with the structure of the WIM marginal basins, including the Porto Basin, being strongly controlled by prominent faults and folds originated during the late Palaeozoic (Pinheiro et al., 1996; Ribeiro et al., 1996). The basin is a relatively narrow (∼50km wide), extending between the coast and the outer continental shelf and slope, so fully offshore without connection to sedimentary sequences onshore. The basin is located in the northward extension of the Lusitanian Basin (Fig. 8, page 7), delimited to the east by the Porto-Tomar Fault, a major late Variscan lineament which has been active throughout most of the basin evolution. A horst block on its western side separates the Porto Basin from the Galicia Interior Basin (Alves et al., 2003; Pinheiro et al., 1996).
There are five oil exploration boreholes in the basin and the geophysical logs in those boreholes were analysed to distinguish between potential reservoirs and cap-rocks. From the simplified porosity-depth profiles, two formations were selected as potential reservoirs for CO2 storage:
• The sandstone layers in the Torres Vedras Formation, with porosities ranging between 20% and 40% and thickness varying from 160 m to almost 1000 m. The Torres Vedras Formation is sealed by interlayered clay layers in the Formation itself and by the marls in the Cacém Formation, generally less than 100 m thick, with porosities in the order of 10%.
• The sandstones and conglomerates in the Silves Formation, which exhibit porosities of up to 20% and thickness above 800 m, sealed by low porosity evaporites of the Dagorda Formation.
Supercritical conditions are estimated, based on hydrostatic pressure and geothermal gradient maps, to exist in a bulk volume of 2790 km3 for the Torres Vedras Formation, and of 380 km3 for the Silves potential reservoir, but for the latter only along a narrow band sub-parallel to the coast, since a maximum depth of 2500 m was imposed as economical for CO2 storage (see Table 2).
The reservoirs are heavily compartmentalised by faults, particularly the Silves Formation, but there is insufficient information about the hydraulic behaviour of the faults. For the purpose of assuming a storage efficient factor (Seff), a conservative approach was adopted, and the main
faults were assumed impermeable, dividing the reservoirs in several laterally closed storage areas for the Torres Vedras Formation (sites A1 to A8 in Fig. 9), while only one area was defined in the Silves Formation (B1 in Fig. 9).
11 Lusitanian Basin – Central and North Sectors
Also situated along the WIM and trending NNE-SSW, the Lusitanian Basin covers approximately 20.000 km2 in the west-central part of mainland Portugal and the adjacent continental shelf. It formed over a sequence of rift pulses, between the Late Triassic and Early Cretaceous, and subsequent opening of the North Atlantic Ocean (Alves et al., 2009; Pinheiro et al., 1996; Rasmussen et al., 1998; Wilson, 1988).
The Lusitanian Basin (Fig. 8a, page 7) is defined as the area between the coastal town of Aveiro, in the north, and the coast south of the Arrábida Chain. To the west, the basin is bounded by the “slope fault system” and, in places, by prominent horsts (e.g. the Berlengas Horst), and to the east by the Porto-Tomar fault, that delimits the Hercynian Massif.
Twelve boreholes were drilled in previous oil exploration campaigns in the Lusitanian Basin (Ca-1, Do-1C, 13E-1, Mo-1, 13C-1, 14A-1, 14A-2, 14C-1A, Fa-1, 16A-1, 17C-1, 20B-1). Most of the available seismic data has also been acquired during oil exploration surveys between the 1970’s and 80’s, associated with those drilling campaigns.
Similarly to the Porto Basin case, an analysis of the borehole geophysical logs was conducted to select the potential reservoirs and cap-rocks:
Fig. 9 – a) Stratigraphy of Porto Basin and indication of reservoir and cap-rock pairs. b) Location of selected areas.
12
• The sandstones in the Torres Vedras Formation, with porosities ranging between 15% and 40%. The Torres Vedras Formation is topped by the Cacém Formation, with values of porosities on the order of 15%.
• The sandstones and conglomerates in the Silves Formation, which exhibits porosities of up to 15-25% and sealed by low porosity evaporites of the Dagorda Formation. Although usually very deep, the Silves formation is in several areas shallower than 2500, which is considered within the admissible limit for CO2 storage.
Within the required temperature and pressure to ensure supercritical conditions, the bulk reservoir volume of the Torres Vedras Formation was estimated at 1454 km3, while for the Silves Formation, the bulk reservoir volume was estimated at 398 km3.
The same conservative approach used in the Porto Basin was adopted in the Lusitanian basin, assuming all potential storage sites as laterally closed structures, compartmentalised by impermeable faults. Eight closed storage areas were defined for the Torres Vedras Formation (sites A1 to A8 in Fig. 10), and 5 potential areas were defined for the Silves Formation (sites B1 to B5 in Fig. 10).
a)
b)
Fig. 10 – a) Stratigraphy of the offshore Lusitanian Basin and indication of reservoir and cap-rock pairs. b) Location of selected areas in the offshore Lusitanian.
13
Sines /Santiago do Cacém Sector of the Lusitanian Basin
The Sines/ Santiago do Cacém sector of the Lusitanian Basin is located in the west offshore Portuguese rift margin between the Lower Tagus valley fault and Sines/Santiago do Cacém, with a western limit defined by the 200m bathymetric. The area encompasses the southernmost Lusitanian Basin, also referred to by some authors as the Santiago do Cacém sub-basin (onshore) and the continuation of the Alentejo Basin to the north (offshore).
This sub-basin is the least explored in the offshore, with only two oil explorations boreholes (Golfinho-1 and Pescada-1) having been drilled and with lower quality seismic surveys.
From the simplified porosity-depth profiles for the two boreholes, again the Silves Formation strikes as possibly interesting for CO2 storage, with porosities ranging from 15% to 25% and sealed by the low porosity evaporites of the Dagorda Formation (Fig. 11). The top of the Silves formation is in extensive areas between the 800 and 2500m depth; i.e. within the ideal pressure interval for CO2 storage (Vangkilde-Pedersen et al., 2009). The Silves Formation reservoir allows for supercritical CO2 conditions in a bulk volume of 9.4 km3.
The southern sector of the Lusitanian Basin was subdivided into four sub-areas (designated A1 to A4), assumed laterally closed along the main structural features (which may act as natural
Fig. 11 – a) Stratigraphy of the Sines/Santiago do Cacém sector and indication of reservoir and cap-rock pairs. b) Location of selected areas in the Sines/Santiago do Cacém sector.
a)
14
barriers for liquid/gas migration) and the physiography of the basin (Fig. 11). Those areas are the most favourable locations for CO2 storage in the Sines/Santiago do Cacém sub-basin, with expected clastic sections in the Silves Formation, probably present in fair to good reservoir characteristics, and laterally varying thickness. Due to its thickness and reology, the thin evaporite coverage of the Dagorda units can act as effective seal. Nevertheless, argillaceous sections in these and other areas to the North can also act as good seals for the Silves formation reservoirs, if proper porosity and permeability conditions are in place.
Algarve Basin
The offshore Algarve Basin (Fig. 8a, page 7) is located on the south-western margin of the Iberian Peninsula, just north of the Azores-Gibraltar Fracture Zone, which marks the present day boundary between the Nubia and Eurasia tectonic plates (Lopes et al., 2006; Terrinha et al., 2006). The structure of the sedimentary basins of southern Portugal is mainly controlled by late Variscan lineaments, striking approximately ENE-WSW. These lineaments have been reactivated both during Mesozoic rifting and Late Cretaceous-to-Recent compressing events (Terrinha et al., 2006; Zitellini et al., 2001).
The adopted stratigraphy of the Algarve Basin is based on five oil exploration boreholes: Imperador-1, Ruivo-1, Corvina-1, Algarve-1 and Algarve-2, and in the extensive 2-D seismic surveys conducted in the 1970’s and 80’s.
The simplified porosity-depth profiles interpreted from the geophysical logs revealed as possible reservoirs the Early Cretaceous sequence, in boreholes Imperador-1 and Corvina-1, and the base Late Cretaceous in borehole Ruivo-1, with porosities ranging between 15% and 30%. However, these sequences do not exhibit great lateral continuity. Moreover, the Cretaceous sequences are topped by Palaeogene limestones, marls, clays and sands with highly variable porosity.
The Miocene sand layers are also possible reservoirs, with porosities from 20% to 33% (Matias, 2007), with extensive shale deposition from the Plio-Miocene providing an effective sealing. Five oil exploration boreholes have intercepted the Miocene sands at depths ranging from 550 m to 950 m, with thickness varying from 250 m to 400 m. Since the depth required for CO2 storage is usually above 700 m, the Miocene Sands could act as reservoirs only at the places with greater depths.
Within the recommended depth range for storage, i.e. between 800 and 2500m of sediment coverage, the bulk reservoir volume for the Early Cretaceous sequence is 663 km3, while the Miocene sands have a bulk volume of 592 km3.
As for the other zones, several laterally closed storage areas were selected with limits imposed by the main faults and structures. Five storage areas (A1 to A5 in Fig. 12) were selected in the Cretaceous reservoir and one site (B1 in Fig. 12) for the Miocene reservoir.
15
Onshore Lusitanian Basin
The Lusitanian basin has an extensive onshore area along the western coastal region of Portugal, in which the Mesozoic sedimentary formations outcrop. The stratigraphic sequence in the sedimentary basin shows no major differences from the offshore sequence, where the potential reservoirs are the Lower Cretaceous Torres Vedras Formation and the Upper Triassic Silves Formation.
However, in most of the onshore sector the Torres Vedras Formation has been eroded, outcrops or is too shallow for CO2 storage, frequently being a good freshwater aquifer. Hence, onshore the only possible reservoir is composed by the sandstones and conglomerates from the Upper Triassic Silves Formation. Along most of the onshore Lusitanian basin the Silves Formation is too deep for considering CO2 storage (often more than 3500 m deep). Only in a region in the Leiria District, it occurs within the depth interval considered in the site screening, although always deeper than 1600 m.
Four areas were defined as selected for CO2 storage (Fig. 13): i) S. Mamede; ii) Alcobaça; iii) S. Pedro de Moel and iv) Alvorninha.
Fig. 12 – a) Stratigraphy of the Algarve basin and indication of reservoir and cap-rock pairs. b) Location of selected areas in the Algarve basin.
a)
16
The reservoir is highly compartmentalized, being crossed by many faults, but there are no indications about the hydraulic behaviour of those faults. Porosity of the reservoir, temperature and salinity of the formation water were assessed using geophysical logs of borehole Aljubarrota-2, in the Alcobaça site (Pereira et al., 2014). Sonic porosity is low, ranging from 3% to 9%, salinity varies from 6 ppm to 35 ppm and maximum temperature is 81◦C.
The reservoir is capped by an excellent seal, the salt, clay and marls of the Lower Jurassic Dagorda Formation, with thickness usually above 400 m and reaching values higher than 1500 m in the S. Mamede and Alcobaça areas. Only in the Alvorninha is the thickness lower than 200 m.
2.2.3. Storage capacity
The screening criteria applied in the sedimentary basin in Portugal considered several geological constraints, including the occurrence of supercritical conditions, geometry of the reservoirs (defined within a Geographic Information System), permeability and porosity of the reservoir, salinity of the formation water, thickness and continuity of the cap-rock, and existence of known active faults. Nevertheless, no legal, infrastructure, or economic barriers were considered (other than discarding potential areas deeper than 2500 m due to being considered uneconomical). Therefore, the storage capacity here indicated is classified under the Techno-Economic Resource-Reserve Pyramid (Fig. 7, page 6) as an Effective Storage Capacity.
The storage capacity of the identified potential injection sites was estimated resorting to the volumetric equation given by Vangkilde-Pedersen, et al. (2009), where the regional storage capacity, MCO2, is given by:
2 2
CO CO r eff
M = ⋅ ⋅A h NG⋅ ⋅φ ρ ⋅S (1)
Fig. 13 – a) Stratigraphy of the onshore Lusitanian Basin and indication of reservoir and cap-rock pairs. b) Location of selected areas in the onshore Lusitanian Basin.
17
where A, h, NG and φ are, respectively, area of trap or regional aquifer, average thickness, average net-to-gross ratio and average porosity of the reservoir. ρCO2 is the CO2 density at reservoir conditions and Seff is the storage efficiency factor.
Equation (1) is a simplification of the methodology proposed by the CSLF (2007) for effective storage capacity in basin- and regional-scale assessments, and was applied in the GEOCAPACITY project (Vangkilde-Pedersen et al., 2009). Since the assessment conducted in Portugal classifies as a regional-scale assessment, with subdivision into multiple potential storage areas, equation (1) is applied using the same criteria as in the GEOCAPACITY project.
Table 3 identifies the source of data for each parameter in equation (1). The efficiency factor (Seff) is the main source of uncertainty, since it is site specific and needs to be determined through
numerical simulations (CSLF, 2007). To overcome that difficulty, the GEOCAPACITY project provides guidance for adopting trap-specific efficiency factors for open- and closed-aquifer systems (Vangkilde-Pedersen et al., 2009). For open-aquifers Vangkilde-Pedersen et al. (2009) suggest Seff values between 20% and 40% for high quality reservoirs, between 10% and 20%
for low quality reservoirs, while for fully closed-aquifers, the suggested Seff values range from 3%
to 5% for high quality reservoirs, and less than 3% for low quality (Fig. 14) . In the assessment here reported a uniform efficiency factor Seff=2% was adopted for all the selected potential
storage areas1
The efficiency factor is site specific ( .
CSLF, 2007) and should be estimated from numerical simulations (or at least from the rock and fluid compressibility’s and admissible pressure increase (Goodman et al., 2011)). However, since there is not enough data to make separate estimates of
Seff for each selected area or even each basin, and it is more realistic to assume a uniform
conservative value.
1The US DOE (U.S. Department of Energy) indicates efficiency factors varying from 0.5% to 5.4% in clastics aquifers, for the P
10 and
P90 percent probability range, respectively. The 50% (P50) probability range is precisely 2% (Goodman et al., 2011). However, that
approach is applicable to the bulk volume of a regional aquifer and the efficiency factor includes, amongst other, the effect of a net-to-total area and of net-to-gross (NG). These are considered separately from Seff in equation (1), which is meant to be applied
to traps or localised areas in a regional aquifer. Therefore, the Seff=2% applied in this report is equivalent to a much smaller US
DOE efficiency factor. Sincethe NG in the assessed sites varies from 18% to 94%, and the area used is only a fraction of the aquifer area, the equivalent US DOE efficiency factor would range from less than 0.36% (for NG=18%) to less than 1.9% (for NG=94%). Thus, the adopted Seff of 2% is regarded as a conservative value in accordance with both GEOCAPACITY and US DOE approaches.
Fig. 14- Criteria for selecting the efficiency factor in open to closed aquifers. After Vangkilde-Pedersen et al. (2009).
18
The total storage capacity amounts to 7.56 Gt CO2 in the 36 potential storage areas, for an efficiency factor Seff= 2%. Fig. 15 provides an overview of the locations of the potential storage
areas and estimated capacity. The linear dependence of the capacity with Seff shows the
importance of this parameter. For instance, an even more conservative value of Seff =1% applied
uniformly to the 36 evaluated areas would reduce the storage capacity to 3.8. Gt CO2.
Appendix 1 summarizes the database used to compute the storage capacity in each site for each storage site and the distribution of storage capacity in the several basins.
2.2.4. Storage clusters
Storage clusters were defined aggregating multiple potential injection sites, thus simplifying the definition of CO2 transport networks. Three criteria were used to define the clusters:
• Continuity of geological basin/structure - when multiple potential storage areas are part of the same sedimentary basin, and there is the possibility that the injected CO2 may spread across contiguous areas, those potential storage areas are included in the same cluster;
• Distance between selected areas – distance between potential injection sites is considered when building the clusters, although no constant distance is imposed. For each selected area, the potential injection site is defined as the location of an existing borehole or, in the absence of boreholes, as the centroid of the polygon limiting the selected are. Thus, when following criterion 1, several clusters may still result in the same basin if the injection sites are too distant from each other;
• Onshore /offshore setting – onshore and offshore storage potential storage areas are always included in distinct clusters, even if there is geological continuity between them. This criterion is imposed due to the different costs involved in onshore and offshore storage.
Table 3 – Parameters used in the storage capacity calculation and sources of data. Parameter Description Source of data
A Area of reservoir
Evaluated with GIS for each individual area, considering existence of supercritical conditions. GIS layers including: depth maps of top and bottom of reservoir, built from
interpretation of 2-D seismic (see Fig. 8b); hydrostatic pressure maps; geothermal gradient; surface and seabed temperature maps.
h Thickness of aquifer
Evaluated with GIS for each individual area, by difference between top and bottom depth maps of the reservoir. In equation (1) it was used the thickness at the location of an existing borehole or, in the absence of boreholes, at the centroid of the polygon delimiting the area. See Fig. 9 to Fig. 13 for location of existing boreholes.
NG Average net-to-gross ratio Evaluated from lithology records of the boreholes existing, or nearest, to each individual area. See Fig. 9 to Fig. 13 for location of existing boreholes.
φ Average reservoir porosity Evaluated from geophysical logs in boreholes existing, or nearest, to each individual area. See Fig. 9 to Fig. 13 for location of existing boreholes.
ρCO2r COconditions 2 density at reservoir ECO2N data (CO2TAB) of COpressure (hydrostatic) and temperature estimated with GIS. 2 properties, for reservoir Seff Efficiency factor Uniformly set to 2%, based on the GEOCAPACITY project
19
In total 8 clusters were defined S01 to S07 and S42, the main characteristics of which are given in Table 4. Fig. 15illustrates the spatial distribution and storage capacity of the clusters.
Table 4 – Main features of storage clusters. Cluster
name Sedimentary basin Setting
Number of selected
areas Selected areas*
Cluster storage capacity (Mt
CO2)
S01 Porto Offshore 5 P_A1; P_A2; P_A3; P_A4; P_A5 1230 S02 Porto Offshore 4 P_A6; P_A7; P_A8; P_B1 870 S03 Lusitanian (north) Offshore 5 NL_A1; NL_A2; NL_A3; NL_A6; NL_B1 2200 S04 Lusitanian (north) Offshore 8 NL_A4; NL_A5; NL_A7; NL_A8; NL_B2; NL_B3; NL_B4; NL_B5 1590 S05 Lusitanian (north and central) Onshore 4 S. Mamede; Alcobaça; S. Pedro de Moel; Alvorninha 340 S06 Santiago Cacém) Lusitanian (Sines- Offshore 4 SL_A1; SL_A2; SL_A3; SL_A4 80 S07 Algarve Offshore 6 A_A1; A_A2; A_A31; A_A4 410
S42 Algarve Offshore 2 A_A5; A_B1 840
*see table 4 for details on selected areas
Fig. 15 - Location of storage sites and capacity per cluster (S# refers to cluster number, see section 2.2.4 for explanation).
20
2.3. STORAGE COSTS
2.3.1. Storage costs components
The costs for exploration, implementation and operation of the CO2 storage sites vary strongly depending on the type of reservoir (saline aquifers, hydrocarbon fields), location (onshore, offshore), surface area that needs to be characterised/monitored or the previous existence of wells and/or facilities. In this report, the development costs (i.e., exploration and implementation of facilities) were considered an investment that depends on the volume of the potential storage complex and its injection rate.
The investment costs for each specific storage site were estimated according to van den Broek et al. (2010):
(
d w)
sf sdI W C H C= + +C +C (2) where: I - Investment costs (€).
W - Number of wells per sink. The number of wells depends on the storage potential of the sink and the injection rate per well for the sink;
Cd - Drilling costs (€ per metre). Cd = 0 if old wells can be re-used. This is never the case in Portugal;
H - The drilling depth (in metres), being the depth of the reservoir starting at the bottom of the sea (for offshore sites) or the ground surface (for onshore sites) plus the thickness of the reservoir (in meter);
Cw - Fixed costs per well (in €). In case of re-use of existing wells, these are the costs for the workovers of those wells (i.e. to make the well suitable for CO2 storage);
Csf - Investment costs for the surface facilities on the injection site and investments for
monitoring (e.g. purchase and emplacement of permanent monitoring equipment) (in €): Csd - Investment costs for the site development costs, e.g. site investigation costs, costs for preparation of the drilling site and costs for environmental impact assessment study. It also includes monitoring investment costs in pre-operational phase (in €).
Costs of CO2 storage were differentiated for storing CO2 in onshore fields or offshore aquifers. Given that depths to the seabed in Portuguese continental shelf can reach hundreds of metres at relatively short distances (as low as 20 km) from the coast, the costs components distinguish between storage with water column thickness below 60 m, from 60 to 100 m and above 100 m. For large injection sites many injections wells may be admissible and multiple facilities surface facilities may be required. It was assumed that a surface facility should be considered for each 10 injection wells.
The OMM (Operating, Maintenance, and Monitoring) costs were always based on a fixed percentage (5%) of the Investment costs (I) for development of the CO2 storage site from scratch. Table 5 lists the value assigned to each CO2 storage cost component in equation (2), with the exception of the number of wells, which depends on the injection rate per well and the admissible annual injection rate for each particular site. These were estimated taking into account the hydraulic, petrophysic and geomechanic parameters of each storage site.