Research and Development Costs in Retail Trade
Radojko LUKIC1 Srdjan LALIC2
Dragana VOJTESKI KLJENAK3
APSTRACT
Research and development expenses are crucial business performance factors for all enterprises, including trading companies. The size and structure of these expenses depend
largely on the nature of a company’s activities. Due to such importance and specificity, the
research focus of this article is on R&D expenses in trading companies with particular emphasis on retail companies. Their share in the sales revenue of trading companies is increasingly important and determined by many factors, such as innovation, size, location, product categories, and others. Due to varying intensity of influence of these and other factors, research and development expenses in commercial companies differ among countries, trade types (wholesale, retail, wholesale and retail), retail formats (store types) and product categories. Understanding the factors of these differences is important for efficient management of research and development costs in trade, particularly retail companies. They are the focus of research in this work.
KEY WORDS: significance andstrategy; innovation, brand and knowledge; intangibles and capitalization; online retailing and information technology; control.
JEL CLASIFICATION: L810, M420, Q320.
1. INTRODUCTION
The attention to more efficient research and development (R&D) cost management has been paid lately, both in theory and in practice in all companies, including retail trading companies. It is understandable considering their importance and impact on the performance of retail companies. The subject of this work are characteristics, specifics and factors that influence the size and structure of the research and development expenses in trading, in particular retail companies. The purpose of the work is an extensive empirical survey of research and development expenses in retail trading companies, observed countries and product categories. This should provide a suitable basis for more efficient management of research and development expenses to management structure (managers) in retail companies in order to make the desired profit as well as to maximize satisfaction of its consumer needs.
This paper focuses on the analysis of research and development expenses in the retail of countries with developed market economy, with special emphasis on Serbia, in what we find a reflection of scientific contribution to the treated issue.
1 Faculty of Economics, Belgrade, University of Belgrade, Serbia, [email protected] Corresponding author: [email protected]
171
Extensive literature is devoted to the analysis of research and development expenses and their impact on the performance of companies (Martinez-Torres, 2010). This issue is, due to its significance, surveyed in numerous studies. However, a very few works are dedicated to the comprehensive analysis of the issue of expenses research and development in the retail trading companies (Codrescu, 2011). Having that in mind, in this article we will try to explore the issue theoretically, methodologically and empirically.
Research and development expenses are the most significant factors for business success of retailers. Consequently, the basic hypothesis is that the effective research and development expense management can greatly affect the performance of retail companies. This hypothesis is confirmed by the findings of previous studies, as well as by the results of this research.
In line with the objective, purpose and defined research hypothesis, applied research methodology is based on a comparative analysis of available empirical data on the research and development expenses by countries, companies and retail product categories, which were difficult to obtain given the fact that many retailers do not publish their data on research and development expenses in the financial statements.
The paper also applied methodology of case studies of countries with developed market economy (John Lewis, Snaige, LVS Las Vegas Sands Corp., Apple and Tesco), with special overview on Serbia (Delhaize Serbia, Mercator-S and IDEA). Understanding the size and structure of research and development expenses of retail companies in individual countries and product categories is a prerequisite for their efficient management in order to reach the target profit.
Applied research methodology is only possible due to the availability of data on the research and development costs in retail. The main methodological problem of R&D cost research in retail companies is that there is no uniform system of their disclosure in the financial statements: some retail companies publish R&D costs as a separate balance sheet position and others do not – regarding this, retail companies that do not publish R&D costs in that way in their financial statements prevail, which is understandable when its economic significance is taken into account. Similarly, its accounting treatment is different in individual retail companies: some companies treat these costs as operating expenses or capitalize them as intangible assets. This, however, makes the analysis on the influence of the R&D costs on the performance of retail companies difficult. Regarding its importance, our opinion is that, regardless of the accounting treatment, a unique system of compulsory disclosure of R&D costs ought to be organized as a separate item in the financial statements of retailers.
Since there is no unified system of compulsory disclosure of research and development costs in the financial statements of retail companies, it is a major problem to gather relevant empirical data on that category of expenses, as well as their comparability. R&D cost data for the purpose of this research were collected from a variety of comparable sources: literature, studies, OECD, Euro stat, the statistical yearbooks, annual reports of retail companies, financial statements of the Agency for Business Registers of Serbia etc. They are methodologically processed in such manner that they are more comparable so as to gain a better idea about the extent of R&D costs in modern retail companies.
172
modern retail. The main problem is the lack of data on the research and development costs in retail. Due to this, it is necessary to develop standards on disclosure of information on the research and development costs in the financial statements of retailers,their size and structure. This will allow complex analysis by applying econometric model on research and development costs and their impact on the performance of retail companies.
2. RESEARCH AND DEVELOPMENT COSTS - SIGNIFICANCE AND STRATEGY
Research and development costs are very considerable expenditure in all companies. This increasing tendency will certainly have an improving impact on their overall performance (Kokko, 2015; Tunali, 2016). So, for instance, in 2015 $ 480 billion was spent on research and development globally. Individual world regions participated as follows: Asia 35% ($ 166), South America 33% ($ 157), Europe 28% ($ 133) and the rest of the globe 5% ($ 25) (http://www.strategyand.pwc.com/reports/2015-global-innovation-1000-media-report) (July 18, 2016). That is why each company, including trading, should define its R&D strategy, primarily in accordance with their cost and profit goals, as well as with the consumer demand. By its nature, the R&D strategy is very complex, as it can be seen in Figure 1.
Figure 1. R&D strategy elements Source: Pisano (2012)
Key elements of a R&D strategy are: architecture, processes, people and portfolio. In relation to the defined R&D strategy the following questions should be answered: where, how, when and what (Pisano, 2012) – in our analysis – concerning the specificity of the business in retail companies.
Regarding their character, research and development expenses occur in the process of introducing new or improving existing products and services and while improving production processes (Greuning, 2010).
Architecture
Centralisation vs. Decentralisation Size and focus of Units Outsourcing vs. Internal
Processes
Development processes Deciding making processes
Governance Metrics
People
„Draft Strategв“
Specialist vs. Generalist Ideal characteristics
How do we intend to win
Portfolio
Characteristics of ideal projects Mix and balance
Criteria for selection/termination
Where
How Who
173
According to the Generally Accepted Accounting Principles - GAAP research and development expenses are treated as costs. Only in exceptional circumstances they can be capitalized and treated as intangible assets (for instance, the buyer's warranty for products bought in consideration that they can be covered by the expected future benefits from that buyer). According to the Financial Accounting Standards Board - FASB they can be treated as intangible assets (with expected future benefits) or costs (excluding expected future benefits). The companies are free to make a decision on it and they mostly treat them as costs.
According to the International Standards for Financial Reporting – intangible assets (IAS 38), development expenditure previously recognized as an expense cannot be subsequently capitalized and treated as (intangible) asset. Research expenditure is recognized as an expense when incurred (Greuning, 2011).
There are different accounting practices for the treatment of R&D costs in many countries. For example, in the US, R&D costs are treated as expenses when incurred, in Germany as expenses when incurred, in Japan they may be capitalized and amortized in a period of 5 years, in the United Kingdom as expenses when incurred (some development costs can be capitalized).
Accounting standards require that R&D costs should be treated as operating expenses calculated to generate future growth. It is believed, however, that it is more logical to treat them as capital expenditures and to make them capitalized (Thi, 2011; Park, 2014; Oswald, 2016). In this respect, there are variety of practices in retail companies for treating the R&D costs as critical factors for success and growth. Some companies record them as operating costs (for instance, Tesco), and the others as capital expenditures or intangible assets (for example, Wal-Mart). Due to its specific nature, many retailers do not record them directly as a separate item in the financial statements. This complicates an analysis of R&D costs.
Generally speaking, R&D expenses are significant factor in the performance of all companies, including retail, regardless of their accounting treatment (Lome, 2016). Therefore, they ought to be under special attention of strategic control in order to optimize and achieve profit targets, with the maximum satisfaction of consumer needs.
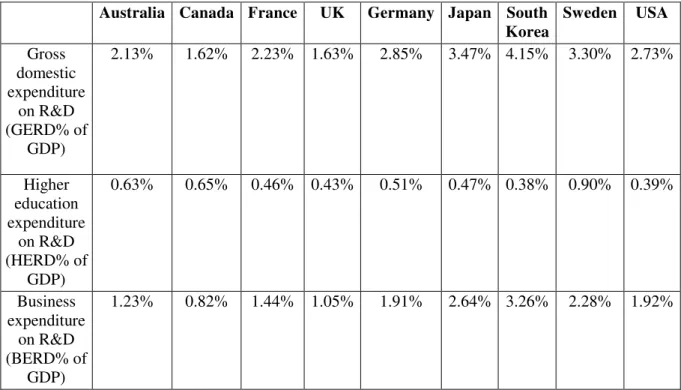
As it is known, in all countries with developed market economy, because of its exceptional importance, a special attention has been paid to innovative activities, which include research and development. For these purposes significant funds of these companies have been allocated. It is quite understandable when one remembers that research and development are critical factors of business success (performance) of all companies. Table 1 contains the data for the R&D costs in selected countries for 2013.
174
Table 1. R&D costs in Australia and the leading OECD countries in 2013 (% of GDP)
Australia Canada France UK Germany Japan South
Korea
Sweden USA
Gross domestic expenditure
on R&D (GERD% of
GDP)
2.13% 1.62% 2.23% 1.63% 2.85% 3.47% 4.15% 3.30% 2.73%
Higher education expenditure
on R&D (HERD% of
GDP)
0.63% 0.65% 0.46% 0.43% 0.51% 0.47% 0.38% 0.90% 0.39%
Business expenditure
on R&D (BERD% of
GDP)
1.23% 0.82% 1.44% 1.05% 1.91% 2.64% 3.26% 2.28% 1.92%
Source: Australian Government/Australian Trade Commission, Australia Unlimited, Why Australia, Benchmark Report 2016,
(http://www.austrade.gov.au/news/economic-analysis/2016-benchmark-report-released) (July 17, 2016)
As far as Serbia is concerned, generally speaking, R&D costs are significantly lower than in other EU countries, the USA and Japan. So, for instance, in 2014 these costs - as a percentage of gross domestic product (GDP) were as follows: Germany - 2.84%, France - 2.26%, Croatia - 0.79%, Italy - 1.29%, Slovenia - 2.39% United Kingdom - 1.72%, Switzerland - 2.96%, Serbia - 0.78%, China - 2.08%, Japan - 3.47%, Russia - 1.19%, the United States 2.81% (http://ec.europa.eu/eurostat/tgm/table.do?tab=table&init=1&language=en&pcode=t2020_20 &plugin=1) (July 18, 2016). They were also lower compared to other countries in the region (Croatia and Slovenia in particular). It had (negative) impact on the performance of (total) economy of Serbia.
Research and development expenses are different in individual economic sectors. It is quite understandable when different nature of business, and the need for innovation as a critical factor for business success is taken into account. In 2015 corporate cash expenditures for R&D costs (in US billions) in individual sectors amounted to: computers and electronics 166.4, healthcare 144.9, auto industry 109.3, software and internet 76.1, industry 75.3, chemicals and energy 42.0, aerospace and defence 22.4, consumers (sector for servicing consumers) 20.5, telecommunications 12.3 and others 10.3 (http://www.strategyand.pwc.com/ media/file/2015-Global-Innovation-1000-Fact-Pack.pdf.) (July 16, 2016).
175
7, 2016). Regarding the size of R&D expenses size there are three major sectors .These are: computers and electronics, healthcare and auto industry. In comparison to other sectors, R&D costs were significantly lower in consumer serving sector. This is in accordance with the nature of its business.
Research and development expenses were significantly high in those pharmaceutical companies that have distribution i.e. retail network – due to specificity of the nature of their business. In 2015 in the observed pharmaceutical companies R&D expenses as a percentage of sales were as follows: Johnson & Johnson (US) 12.90%, F. Hoffmann-La Roche AG (Switzerland) 19.89%, Pfizer Inc. (US) 15.74 %, Novartis AG (Switzerland) 18.08%, Bayer AG (US) 9.24%, Merck & Co. Inc. (US) 16.94%, GlaxoSmithKline plc (UK) 15.29%, Sanofi (France) 14.71%, Gilead Sciences, Inc. (US) 9.23%, and AstraZeneca Plc (UK) 25.36% (Calculation made by the author based on: https://igeahub.com/2016/05/06/top-10-pharmaceutical-companies-2016/) (July 12, 2016). Participation of R&D expenses is therefore in the range from 9.23% (Gilead Sciences, Inc. (U.S.) to 25.23% (AstraZeneca plc (U.K.).
In the European Union significant resources are allocated into research and development in food and beverage industry, both in wholesale and retail. So, for instance, in 2012 R&D investment as share of food and beverage output was: Japan 0.73%, US 0,57%, Norway 0.53%, Korea 0,36% and EU 0.27% (http://www.fooddrinkeurope.eu/uploads/ publications_documents/Data_and_Trends_2014-20151.pdf. (July 18, 2016)
These data shows that the R&D costs in food and beverage industry were significantly higher in Japan than in the US and the European Union. There are very significant R&D costs in food industry in India (Sujit, 2016).
In each country, therefore, not only in those observed in this research, R&D costs in food and beverage industry were crucial and show an increasing tendency. That makes a positive impact on their performance.
When observed by individual sectors of an economy, research and development costs were significantly lower in the service companies, including trading, or retail, in comparison to communication, information and technology companies, as well as in healthcare institutions (Kuusisto, 2008). That is clearly evident in available empirical data presented here as well as in other studies. Knowing the size and the difference is very important for the efficient R&D cost management in individual industry sectors and in individual companies according to the nature of their business.
Many companies, especially those in the sector of information and communication technologies, cars and health have allocated significant funds for research and development costs in order to increase their profits. So, for instance, in 2015 R&D expenses (as a percentage of sales) in the following companies amounted to: Volkswagen 5,7%, Samsung 7,2%, Intel 20,6%, Microsoft 13,1%, Roche 20,8%, Google 14,9%, Amazon 10,4%, Toyota 3,7%, Novartis 17,3% Johnson & Johnson 11,4%, Pfizer 16,9%, Daimler 4,4%, General Motors 4,7%, Merck 17,0%, Ford 4,8%, Sanofi 14,1%,Cisco 13,4%, Apple 3,3%, GlaxoSmithKline 15,0%, AstraZeneca 21,4% (http://www.strategyand.pwc.com/ media/file/2015-Global-Innovation-1000-Fact-Pack.pdf.) (July 7, 2016).
176
Samsung, Amazon, 3M, General Electric, Microsoft, IBM, and Toyota (http: / /www.strategyand.pwc.com/media/file/2015-Global-Innovation-1000-Fact-Pack.pdf.) (July 7, 2016). They are mainly from the information and communication sector.
R&D costs are very significant in the company Teradata. In 2015, they were as follows: percentage of revenues 7.86%, total operating expenses 21.94%, total operating income (profit) 48.65% and net income (profit) 98.51% (Calculation performed by the Author based on: www.teradata.com/WorkArea/DownloadAsset.aspx?id=3274) (July 7, 2016).
3. R&D EXPENSES IN TRADE
Research and development expenses were lower in trade than in other highly capitalized sectors. Among others, a very low share of the cost of amortization of intangible assets in Russia's trade in 2014 points to such a conclusion: motor vehicles trade 0.1%, wholesale trade 0.1%, retail trade 0.5% and restaurants 0.4% (Ф ь я
Р ч - 2015 .).
R&D costs in trade vary in different countries. Table 2 presents the research and development costs in trade as a percentage of gross domestic product by different countries for the period 2009-2013.
Table 2. R&D expenses in the trade of selected countries, 2009-2013 (% of GDP)
2009 2010 2011 2012 2013
France 0.316% 0.378% 0.449% 0.460% 0.489%
Germany 0.054% 0.060% 0.067% 0.071% 0.063%
Italy 0.100% 0.104% 0.085% 0.093% 0.110%
Japan 0.039% 0.035% 0.029% 0.052% 0.053%
Slovenia 0.094% 0.079% 0.093% 0.080% 0.111%
UK 0.240% 0.295% 0.296% 0.263% 0.248%
US 0.087% 0.089% 0.111% 0.128% 0.074%
Note: Calculation made by the author
Source: OECD
The data in Table 2 show that the R&D costs in observed countries had an increasing tendency in the analyzed period. This had a beneficial effect on the performance and growth of trade.
R&D expenses in trade differ not only among countries, but also by the type of trade (wholesale, retail, wholesale and retail), individual companies, and product categories. Regarding that fact, in further research we will particularly explore R&D costs in retail.
177
development costs in retail differs among countries. In Serbia, the development of private brands is at very low level compared to countries with developed market economy.
4. R&D COSTS IN RETAIL TRADE
R&D costs are a significant factor for a business success in retail companies (Martinez-Torres, 2010; Almeida, 2015). Success is influenced by many factors, especially by innovation and application of information and communication technologies in business.
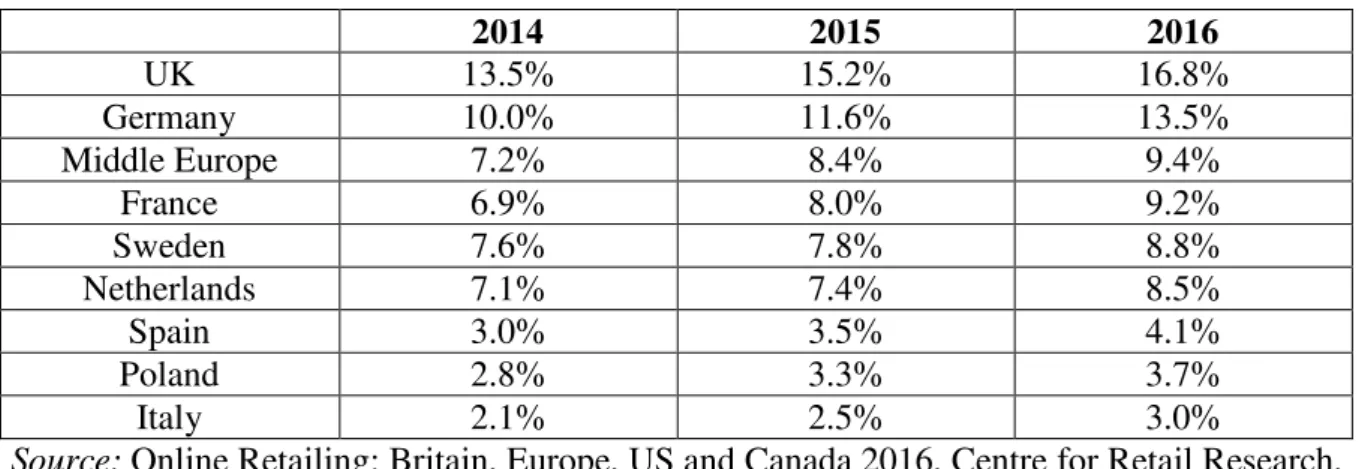
In modern retail trade, a considerable attention is paid to the development of online sales as one of the forms of business process innovations. Significant funds are allocated for these purposes. For instance, in the United States in 2015 online shopping amounted to $ 349.20 billion (£ 215.38 billion) and according to relevant estimations it is expected to reach $ 399.48 billion (£ 246.39 billion) in 2016, аhich is an increase of 14.4% (Online Retailing: Britain, Europe, US and Canada in 2016, Centre for Retail Research, http://www.retailresearch.org/onlineretailing.php) (July 16, 2016). Generally speaking, in most countries there is a higher share of online sales in total sales in retail trade (Table 3). We also find significant participation in food sales.
Table 3. Share of online sales in total sales in retail, 2014-2016 (estimation) (%)
2014 2015 2016
UK 13.5% 15.2% 16.8%
Germany 10.0% 11.6% 13.5%
Middle Europe 7.2% 8.4% 9.4%
France 6.9% 8.0% 9.2%
Sweden 7.6% 7.8% 8.8%
Netherlands 7.1% 7.4% 8.5%
Spain 3.0% 3.5% 4.1%
Poland 2.8% 3.3% 3.7%
Italy 2.1% 2.5% 3.0%
Source: Online Retailing: Britain, Europe, US and Canada 2016, Centre for Retail Research, (http://www.retailresearch.org/onlineretailing.php) (July 16, 2016)
In recent years considerable attention is paid to innovation in business, such as the development of private brands. For instance, in 2015 the company Fast Retailing is classified among most significant innovative companies (https://media-publications.bcg.com/MIC /BCG-Most-Innovative-Companies-2015-Nov-2015.pdf.) (July 17, 2016). This is certainly the case with almost all global retailers. Considerable funds were invested for that purpose.
The participation of private brands in sales differs in individual countries, companies, types of stores and product categories, for example: the participation of hygiene product private brands in the following countries is as follows: Russia 3.8%, Indonesia 6.5%, Argentina 2.8%, India 8.1%, Poland 25.9%, Mexico 9 3% South Africa 2.0%, Spain 44.2%, Thailand 2.6%, Germany 31.3%, Italy 13.1%, France 26, 6% and the United Kingdom 22.2% (http://www.nielsen.com/content/dam/nielsenglobal/de/docs/Nielsen%20Global%20Home%2 0Care%20Report_2016.pdf. ) (July 11, 2016).
178
the share of private brands in individual types of stores in 2015 was as follows: supermarkets – 22.9% unit market share while dollar share was measured at 19.2%. Unit share in drug chains was 17.2% as dollar share increased to 16.7%. Unit share for all outlets grew to 21.1% combined and dollar share was 17.7% (http://plma.com/share/press/resources/ PLMA2016YB_COMB_RPT.pdf.) (July 11, 2016).
In Serbia, likewise in other countries, more money was invested into development of private brands in recent years. But the level is still significantly lower compared to the countries with developed market economy and neighbouring countries (Croatia and Slovenia). For example, in 2013 the participation of private labels in the sales of food products in the countries of the region was the following: Slovenia 34%, Croatia 16%, Serbia 6% and Bosnia-Herzegovina 2% (http://infoarena.hr/ file / 2015/09 / InfoArena4.pdf.) (July 11, 2016). According to our estimates, the share of private labels in sales in Serbia ranges from 7 to 11%, with an increasing tendency (Lukic, 2011).
Research and development expenses are different in individual retail companies. So, for instance, in the company John Lewis in 2013 they amounted to 1% as a percentage of sales (http: //iri.jrc.ec.europa.eu/scoreboard15.html) (July 8, 2016). In the company Snaige they were in 2014 at the level of 0.72% as a percentage of net sales (calculation performed by the author based on: http://iri.jrc.ec.europa.eu / scoreboard15.html) (July 8, 2016).
The research costs for LVS Las Vegas Sands Corp. for the period 2013-2015 are presented in Table 4.
Table 4. Research costs for LVS Las Vegas Sands Corp., 2013–2015
2015 2014 2013
Total revenues (in USD 000)
11,688,461 14,583,849 13,769,885
Research costs (in 000 USD)
10,372 14,325 15,809
Research costs as a percentage of total
revenues*
0.09% 0.10% 0.11%
Note: *Calculation performed by the author
Source: http://finance.yahoo.com/quote/LVS/financials (July 11, 2016)
In the observed company, research costs amounted to approximately 0.10% of total revenues.
179
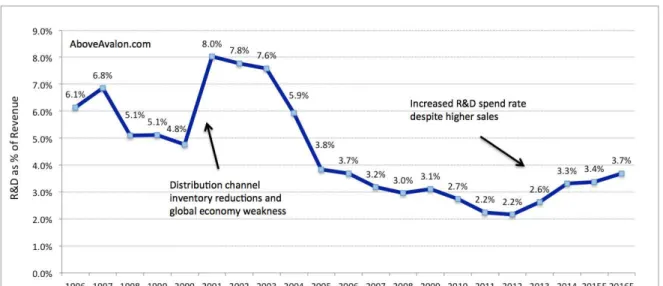
Figure 2. Annual R&D costs in Apple for the period 1996-2016 (as a percentage of revenue)
Source: http://www.aboveavalon.com/notes/2015/5/3/significant-rd-increase-suggests-apple-is-working-on-something-big (July 11, 2016)
As it can be seen, the R&D costs are at a significant level in Apple. In 2015, according to the estimates, they amounted to 3.4% of total revenues.
In the Tesco Corporation R&D costs are also very significant. Table 5 shows R&D costs for the period 2013-2015.
Table 5. Development costs Tesco, 2013-2015
2013 2014 2015
Total revenues (in thousands $)
524,865 542,991 279,738
Development research costs (in thousands $)
8,578 9,574 9,198
Development research costs as a percentage of total
revenues*
1.63% 1.76% 3.28%
Note: *Calculation performed by the author
Source: http://finance.yahoo.com/quote/TESO/financials (July 16, 2016)
Development and research costs in Tesco Corporation show an increasing tendency. In 2015 they were at the level of 3.28% of total revenues – significantly higher than in comparable global retailers. This investment in research and development had a positive impact on its overall performance.
180
5. R&D COSTS IN RETAIL COMPANIES IN SERBIA
In order to define the character of R&D costs in retail companies in Serbia we will present the share of R&D costs in total income for the three largest retail companies in 2012 and 2013 (Table 6).
Table 6. R&D costs in three largest retail companies in Serbia, 2012 and 2013 (% of total operating revenues)
2012 2013
Delhaize 4.815% 4.910%
Mercator-S 0.936% 0,894%
IDEA 0.451% 0.483%
Note: *Calculation performed by the author
Source: Agency for Business Registers
According to the data presented in the table, we can make a conclusion that the R&D costs in the company Delhaize were higher, and in the companies Mercator-S and IDEA lower in comparison to similar retailers in countries with developed market economy. Research and development expenses in the retail companies in Serbia as a whole, according to our estimates, were at a significantly lower level than in the foreign multinational companies, especially in countries with developed market economy. It is necessary to invest more in research and development in the future so as to improve the performance of retail companies in Serbia.
6. CONCLUSION
Research and development expenses are crucial factor of business success in retail companies. Thus, it is necessary to understand the size and structure from different aspects in order to efficiently manage these costs in modern retail companies. In the terms of size they vary in different countries, types of stores, i.e. product categories. R&D costs in retail companies are much lower in comparison to the IT (information technology) and pharmaceutical companies. They are lower in developing, than in countries with developed market economy, also in small than in large retail companies, in food and drinks retails than in other retailers etc.
As part of research and development in global retail companies, considerable attention was paid to the development of private brands, as well as the implementation of new information and communication technologies. This has a positive impact on the quality of servicing customers and business performance.
181
REFERENCES
Almedia, J.J.A. (2015). Measuring risk-taking incentives in the U.S. retailing industry.
Dissertation, Catolica Lisbon, Lancaster University, 1-47, available at:
http://repositorio.ucp.pt/bitstream/10400.14/19991/1/Jose%20Almeida%20-%20Dissertation%20Catolica.LUMS.pdf. (July 18, 2016)
Australian Government/Australian Trade Commission, Australia Unlimited, Why Australia, Benchmark Report 2016, 1-61, available at:
http://www.austrade.gov.au/news/economic-analysis/2016-benchmark-report-released. (July 17, 2016)
Data & Trends: European Food and Drink Industry, 2014 – 2015, Food drink, Europe, 1-26, available at: http://www.fooddrinkeurope.eu/uploads/publications_documents /Data_and_Trends_2014-20151.pdf .(July 18, 2016)
Euro stat – Gross domestic expenditure on R&D (GERD), % of GDP, available at: http://ec.europa.eu/eurostat/tgm/table.do?tab=table&init=1&language=en&pcode=t2020_ 20&plugin=1. (July 18, 2016)
Greuning, H. V., Scott, D. and Terblanche, S., (2011). International Financial Reporting Standards, A Practical Guide. Sixth Edition, The Washington, D.C.
Hirschey, Mark, Skiba, Hilla, &BabajideWintoki, M. (2012). The size, concentration and evolution of corporate R&D spending in U.S. firms from 1976 to 2010: Evidence and implications. Journal of Corporate Finance, 18, 496–518.
Kokko, Ari, PatrikGustavssonTingvall, and JosefinVidenord (2015). The Growth Effects of R&D Spending in the EU: A Meta-Analysis. Economics Discussion Papers, No 2015-29, Kiel Institute for the World Economy, available at: http://www.economics-ejournal.org/economics/discussionpapers/2015-29. (July 18, 2016)
Kuusisto, J. (2008). R&D in services-review and case studies, European Touch, DG ResearchEuropean Commission, 1-55.
Lome, O., Heggeseth, A. G. and Moen, Ø. (2016). The effect of R&D on performance: Do R&D-intensive firms handle a financial crisis better? Journal of High Technology Management Research, 27, 65-77.
Lukic, R. (2011). Estimates of economic performance of organic food retail trade. Economic research, 24(3), 157-169.
Martinez-Torres, M.R. and Toral, S.L. (2010), International comparison of R&D investment by European, US and Japanese companies. Int. J. Technology Management, 49 (1/2/3), 107-122.
Oswald, Dennis R. and Simpson, Ana Vidolovska and Zarowin, Paul. (February 2016). Capitalization vs Expensing and the Behaviour of R&D Expenditures. SSRN, available at: http://ssrn.com/abstract=2733808. (July 10, 2016)
Park, C. K., Chung, S. G. and Kim, J. W. (2014). Accounting for R&D Expenditure: To Capitalize or Not to Capitalize? Life Science Journal, 11(7s):107-111, (ISSN:1097-8135), available at: http://www.lifesciencesite.com.19. (July 18, 2016)
Pisano, G. P. (April 24, 2012). Creating an R&D Strategy. Working Paper, Harvard BusinessSchool, No 12-095.
Plma’s 2016 Private Label Yearbook, A Statistical Guide to Today’s Store Brands, available at: http://plma.com/share/press/resources/PLMA2016YB_COMB_RPT.pdf. (July 11, 2016)
Sujit, K. S. and Rajesh, B. K. (2016). Determinants of Discretionary Investments: EvidenceFrom Indian Food Industry. SAGE, 1-16.
182
Nielsen, available at: http://www.nielsen.com/content/dam/nielsenglobal/de/docs/Nielsen% 20Global%20Home%20Care%20Report_2016.pdf. (July 11, 2016).
The 2015 Global Innovation 1000, Strategy&, PwC, October 2015, available at:
http://www.strategyand.pwc.com/media/file/2015-Global-Innovation-1000-Fact-Pack.pdf. (July 7, 2016)
The Global innovation 1000, Innovation’s New World Order, October 27, 2015,PWC/Strategy&, available at: http://www.strategyand.pwc.com/reports/2015-global-innovation-1000-media-report. (July 18, 2016)
The 2015 EU Industrial R&D Investment Scoreboard, European Commission, JRC/DG RTD,available at: http://iri.jrc.ec.europa.eu/scoreboard15.html. (July 8, 2016)
The Most Innovative Companies 2015, Four Factors That Differentiate Leaders, The Boston Consulting Group– BCG, available at: https://media-publications.bcg.com/MIC/BCG-Most-Innovative-Companies-2015-Nov-2015.pdf. (July 17, 2016)
Sorescu, A., Frambach, R.T., Singh, J., Rangaswamy, A. and Bridges, C. (2011). Innovations in Retail Business Models. Journal of Retailing, 87, Supplement 1, S3-S16.
Thi T. D, Shultze W. (2011). Capitalizing research and development (R&D) expenditures – Do the perceived benefits materialize in practical application? Working paper, University of New South Wales.
Tunali, к. B. (2016). The Effect of Research and Development Spending on Economic Growth in OECD Countries. YönetimBilimleriDergisi / Journal of Administrative Sciences Cilt / Volume: 14, Saвı / N: 27, ss. / pp.: 59-79.