UNIVERSIDADE DE ÉVORA
DEPARTAMENTO DE ECONOMIA
DOCUMENTO DE TRABALHO Nº 2011/01
Janeiro
Forest property insurance: an application to mediterranean woodlands
António Pinheiro
Universidade de Évora, Departamento de Economia
Nuno Ribeiro
Universidade de Évora, Departamento de Fitotecnia
UNIVERSIDADE DE ÉVORA DEPARTAMENTO DE ECONOMIA
Largo dos Colegiais, 2 – 7000-803 Évora – Portugal Tel.: +351 266 740 894 Fax: +351 266 742 494 www.decon.uevora.pt wp.economia@uevora.pt
1
Abstract/Resumo:
Fire is the biggest forest enemy in many countries, especially in those that have dry and hot climates. Fire destroys biomass and makes forest production a very risky business. Forest insurance could decrease fire risk and would contribute to make forest activities more profitable. Nowadays, in many countries, it is not easy to find companies that want to insure forests stands. The most important reasons to explain this fact are the followings. First, in many countries, forest insurance is not mandatory; so many farmers don‟t make it. This increases the risk premium that insurance companies ask for those that were willing to make the insurance contract. Second, insurance companies need to have models based on desegregated and reliable data that allow them estimating the probability of fire occurrences. Finally, it is very difficult for insurer to estimate the real value of the stands (forests) because their values vary from species to species and for the same species with the age and market prices. So, it is difficult for insurer to practice fair and reasonable insurance premiums. The main objective of this paper is to present simple models that help to estimate “fair” insurance risk premiums, contributing in this way to make forest business more appealing and sustainable.
Keywords/ Palavras-chave : forest fire, insurance, risk premium, forest property insurance.
2
1. Introduction
Every year, millions of hectares of forest are burned and many forest owners who relied on incomes from their forests go bankruptcy. Even when they receive government subsidies they are very small to face their losses. To avoid this situation it was expected that farmers took forest risk insurance!
Unlike the risk of many others disasters, that are the business of insurance companies, forest risk insurance against fire is still little frequent in many European countries, manly in the Mediterranean area. In Portugal it is extremely difficult to make forest fire insurance contracts. Some insurance companies just do not accept this type of risk insurance; others only accept this type of contracts to their former clients, ask lots of question (including the insurance value of the forest property and say that for risk premium computation, only consider 70% of the declared value). These companies, very often, after consulting their technical support services, end up just saying “we cannot accept this type of risk”. Finally, some other companies only ask the name of stand species, the area, and location of the property. They ascribe a very low value to the forest property. The premium rates are computed as same thing like 3% of that value. Under these circumstances only a minority of private owners makes insurance contracts.
The director of Australian Forest Growers, Cummine (2000) wrote: “it can be difficult for an individual grower to obtain forestry insurance cover. Forestry insurance is very specialized, and cover is provided by only a small number of underwriters. Even if an individual grower succeeded in taking out insurance, the premium rates could be very high.”.
In France, De Saint –Vincent (2000) estimates that out of 15 million hectares of forest, only about 800.000 hectares are insured. Forest risk insurance in Germany is at very beginning (Holecy and Hanewinkel, 2004).
It is long since that the luck insurance in forest has been recognized. In 1935, Shepard referred that the risk to private capital in forestry in comparison with probable returns generally remains so great that insurance would aid in interesting the investor in the forest business (Shepard, 1935).
The question is: why insurance companies are not as competitive in forest fire insurance contracts as they are in others branch of activities, like car accidents or health care? There are several reasons, but we believe that the most important are: (1) the lack of deep empirical forest knowledge to estimate the expected value of forest stands; and (2) and the lack of empirical investigation to quantify forest fire
3 hazards for specific species and sites.
The objective of this paper is to present a simple methodology that can help insurance companies and farmers to find out the fair insurance premium for forest fire , contributing, in this way, to lower the insurance premiums and, consequently, to increase the number of forestry farmers that will use them.
2. The Mediterranean forest – the case study 2.1 Mediterranean climate
The Mediterranean climate has very dry and very hot summers (two or three months without any rain), cold and rainy winters. As it can be seen from Figure 1 there is a long period of water stress coincident with summer. During summer season the temperatures are very high and the relative humidity very low. These are the ideal conditions for fire.
Figure 1. Mediterranean Climate
Ombrothermic diagram
Évora (Mitra), Portugal: 200 m ; 15.5ºC ; 664.6 mm Average values for the period : 1951-1980
0 10 20 30 40 50 60 July August t (º C ) 0 20 40 60 80 100 120 P ( mm ) 41.6 31.3 3.8 -7.1
Table 1 presents the number of fire events and the burned areas for the period of 2001-2009. If we have in mind that the Portuguese forest area is around 3 million hectares, so, every year, the fire destroys about 3.5% of it. In economic terms it represent a big loss not only because of the value of the trees that are burned but also because of the amount of resources (human and material) that are needed to fight the fire.
4
Table 1. Number of fire events and burned areas for period 2001-2009
Year Number of fire events
Burned area (hectares) Total burned area
Burned area Probability (%)
Forest stand Brushwood Forest stand Brushwood
2001 26723 45160 66206 111366 2.58 3.05 2002 26358 64720 58539 123259 2.43 2.85 2003 26135 286181 138889 425070 9.68 6.65 2004 21849 93571 71871 165442 2.63 3.05 2005 35548 211915 125168 337083 10.59 7.46 2006 19596 35816 38742 74558 1.59 2.48 2007 18912 9285 30939 40224 0.38 2.33 2008 13588 5079 16532 21611 0.25 1.05 2009 23903 22624 83895 106519 1.10 4.19
Source of the data: Autoridade Florestal Nacional, AFN
The average burned area for the considered period was 3. 47% for forest stand area and 3.68% for brushwood area, or 7.15% of the total forest area.
During the period of 1991-2001, there were 261,424 fires that burned 1,158,278 (3.35%) hectares of forest stands (United Nations, 2002). This value is almost identical to the one we estimated above, for the period 2001- 2009.
2.2 Specificities of “montado” woodlands
The agro-silvopastoral system “montado” dominates the landscape of the south-western Iberian Peninsula, occupies approximately 3.1 million hectares of woodland in Spain (Díaz et al., 1997) and 1.2 million hectares in Portugal (DGF-IFN, 2001). The forest system “montado” is mostly dominated by Mediterranean evergreen oaks such as cork oak (Quercus suber L.) and holm oak (Quercus rotundifolia). The “montado” production system management aims the maintenance of a balanced sustainable land use to cope with the Mediterranean climate variability. The “montado” stands are managed in agro-silvo-pasture systems of which sustainability depends on balanced relations between their components: (1) forest component managed for continuous crown cover to sustainably produce cork, acorn, wood, fire-wood and support productions of natural pasture, mushrooms, honey, natural habitat for hunting species, and many more.; (2) pasture component based on an extensive livestock, with the animals feeding directly on leaves, acorns and grass (from natural/artificial, temporary/permanent pasture systems) and complemented with stored
5 cereal culture products that, in some areas, is grown in long rotations (Campos et al., 2001, Ribeiro et al., 2004 and 2006).
The agro-silvopastoral system “montado” ownership is characterized in Portugal by large private estates and multifunctional production of commercial and non-commercial goods and services. In addition to these traditional commercial uses, the “montado” there are other benefits that are of growing interest to the society such as wildlife habitat, private amenities, public recreation opportunities, carbon storage, and quality water production (Campos and Caparro´s, 2006). “Montado” forest landscapes represent one of the best Mediterranean examples of the development of the multi-functional role of forests, maintained over thousands of years. In these landscapes high conservation value forest areas alternate with multipurpose farmland systems1.
In Portugal cork oak forest occupies approximately 700.000 hectares of land, which makes Portugal the most important cork producer of the world (DGF-IFN, 2001). Although cork oak fruits can be used to feed animals and some wood can be sold, the main source of income of this forest is cork. There are varying degrees of quality and the cork undergoes a strict quality selection process that determines its final use. The best quality cork is selected for bottle stoppers (Pinheiro et al., 2008).
There are several threats to this forest production system, manly economic and environmental. On the one hand the shrub system control that guarantees “montado” sustainability is more expensive than other mostly used by farmers and reduces the income from animal rising. On the other hand fire is also a great environmental threat.
2.3. Database for fire probability estimation
Fire is mainly caused by man voluntary or involuntary actions. Only a very small percentage of fire events have origin in natural hazards. As it was said before, in Mediterranean regions during summer there are very favorable conditions for fire, so any human negligence can cause a fire. Therefore, human education to change human hazardous habits can play an important role in decreasing the number of fire events.
1 Mediterranean Cork Oak Forest Programme,
6 Like many other events, fire is the kind of hazard almost impossible to foresee. However, if everything remains constant, past experience is the best information one can use to estimate the probability of another similar even to happen (even if we believe that human habits are changing, they change very slowly).
So, to estimate the probability that a fire happens in a given region (for example, in a municipality), with A hectares of area, we use a temporal series and estimate the empirical probability of fire in that municipality by:
Pf,i=ni/N
Pf,i is theannual probability offire in municipality i, ni is number of years with registered fire occurrences and
N is the number of years with recorded events, the length of the time series.
The annual average burned area can be estimated by:
N X BA N j i j i
, (1)Where BAi is the annual average burned area in region i, and Xj,i is the burned area in year j and region i.
So, the expected burned area in region i, EBAi, will be estimated by:
EBAi= Pf,i .BAi (2)
The empirical probability of fire for different class areas can also be estimated. Suppose we have five forest class areas and for each class the frequency of fire events area during the last N years have been registered. Table 2 represents these hypothetical data.
Table 2. Forest class areas and number of fire events
Forest class area Number of fire events
a1 n1 a2 n2 a3 n3 a4 n4 a5 n5 If n= n1+ n2+...+ n5
7 If a fire happens, the relative frequency of burning ak
n n a RF v k v k
5, and a1<a2<a3<a4<a5
So, the probability of specific farm of ak hectares of forest being burned in region I, with A hectares, can be
estimated by:
Pf,ak = Pf,i . RF,aK . ak / A
where ak/A represents de number of forest farms of area ak in the region of area A.
3. Valuation of the forest property for insurance 3.1 Some concepts and definitions
Before presenting the methodology to estimate the value of the forest property, some definitions are presented to make the text more understandable. So, similarly to (Holecy and Hanewinkel, 2004), we define,
Expected Physical Loss (EPL) - is equal to the number of hectares of the forest multiplied by the probability
of fire.
Financial Risk (FR) - is an expected loss expressed in money terms, it is equal to the value of the property
multiplied by the probability of fire occurrence.
Insurance Premium (IP) - is an expression of a financial risk in terms of money to compensate an
entrepreneurial individual financial risk. The insurance premium can be dived into the financial risk of a
forest owner which is equal to the net insurance premium and the financial risk of an insurer that we call risk premium.
Gross Insurance Premium (GIP) - is equal to the sum of the net insurance premium and risk premium
8 Given that forests are subject to disasters, i.e., it runs the hazard of being burned, the social role of insurance companies is to divide the loss of one or several forest owners among all insured forest farmers. So, the object to be insured (the insurance value) is the loss that a forest owners will have in case of fire.
3.2 The forest stand expected value
To estimate the loss of a forest farmer it is necessary to determine the following three different parameters (Holecy and Hanewinkel, ob. cit.):
a) The forest stand expectation value, FSEV(t), at forest age t, and the related soil expectation value, SEV(T), at the end of the rotation T.
b) The salvage value, SV(t), of forest stand in case of fire. c) The risk-free soil expectation value, RFSEV(T).
The loss that a forest property suffers and the insurance value of a forest property, IVFP(t), can be estimated by:
IVFP(t)=FSEV(t)-SV(t)+SEV(T)-RFSEV(T) (3) Or
IVFP(t)=FSEV(t)-SV(t)+RPSEV(T) (4)
In expression (4), RPSEV(T) represents the risk premium on the SEV(T).
To estimate the forest stand expectation value at age t, FSEV(t), we can use Faustmann formula as follows: ) ( ) 1 ( ) ( ) 1 )( ( ) ( SEV T r T SEV r C R t FSEV T t T t j j T j j
(5)9 period of j. SEV(T) is the soil expectation value of the investment calculated based on the net present value, NPV(T), on time T and r is the rate of discount.
4. Insurance Premiums
Insurance premiums provide both the forest owner and the insurer with the information about the risk of fire during an average year. But the risk is not the same for both.
Assuming that fire insurance is compulsory far all forestry farms in region i, with area A, the expected damage caused by a fire for an insure company is not the same for a farmer. The financial risk of an insurer , per hectare, FRI(t), can be estimated by:
FRI(t)= EBAi. FSEV(t)/A (6)
For the owner of a forest of area ak hectares, the fire can be small a one, burning only a1 hectares, or any
other area between a1and ak, or an area grater then ak. So, the expected risk depends upon the frequency
of fire for his class‟s are. The insurance premium that a owner, IPO(t) of a forest of class are k, is willing to pay varies from a maximum of
IPO(t)=Pf,a1.FSEV(t) (7)
to a minimum of
IPO(t)=Pf,ak.FSEV(t) (8)
To make this explanation more understandable, let‟s consider an easy hypothetical example. Assume that we have data, for the last 100 years, about fires of one forest homogeneous region of 4.000 hectares. Columns 1 and 2 of Table 3 presents the primary data, class areas and number of fires occurred in the last 100 years. Column 3 is the averaged burned area per class area (the estimations were made considering the middle point of the class area). Column 4 is the relative frequency of fires burning a area equal or smaller then ak(RF, ak). Column 5 shows the probability of burning an area as large as ak. Assuming that
10
Table 3. Example with hypothetical data
Class area
Number of fire events
Average burned
area (ha) RF,ak Pf,ak
Farm expected loss /ha <20 16 160 0,480 0,00120 6,00 20-40 10 300 0,320 0,00240 12,00 40-60 6 300 0,220 0,00275 13,75 60-80 4 280 0,160 0,00280 14,00 80-100 10 900 0,120 0,00270 13,50 >100 2 220 0,020 0,00055 2,75 Total = 48 Total = 2160
As we can see from the last column of Table 3, the expected loss, per hectare, for the farmer, varies considerably according to farmer‟s class area.
Let‟s estimate the financial risk of insurer, assuming that insurance is compulsory for the entire region of 4.000 hectares. From (6)
FRI(t)= EBAi. FSEV(t)/A
EBAi=(48/100)*2160/48=21.6ha
FRI(t)=(21.6*5000€)/4000=27,00€/ha
As it is expected the insurance premium of the company is much higher than the expected private farmer loss. However, a farmer must think that if has no insurance and a fire occurs in is forest he will have a loss of 5000 € per hectare!
5. Application to “montado” woodlands
The cash flow of common management cork oak production can be summarized on Table 4. The only sources of revenue considered are cork and cattle production. On the cost side only infesting control and cork stripping off costs are taken into account.
11
Table 4 .Summary of the assumptions used for cork oak investment
Year(s) Activity cost/benefit (€ ha-1)
0
3-108 (every third year) Planting cost Infesting control by shrub cutting -1500 -90 3-108 (every third year) Cattle revenue 45 27
36- 100 (every ninth year)
Cork production, approximately 1000 kg Cork production, approximately 1600 kg
1500 a) 4000 27
36- 108 (every ninth year) Stripping off cost (0.23 €/kg) Stripping off cost (0.23 €/kg) -230 -368
a) The revenue from cork selling depend of it quality. It is assumed that the price rages from 1.33 € per kilogram to 4.00 € per kilogram. In this study we consider price of 1,5 € per kg for the first stripping and 2,5 € per kg for the following ones.
It is assumed that after 108 years new cork trees are planted. Following the methodology above explained and considering interest rate of 3% per year (r=0, 03), we estimate the values that are summarized in tables 5 and 6.
Table 5 - Estimation of the insurance forest value, per hectare, for different ages of cork oak trees.
Age (t) Value, SEV (t) Soil Expected Forest stand expectation value, FSEV(t) Salvage value, SV(t), Risk-free Soil Expectation Value, RFSEV(T) Insurance Value of Forest Property at Age t, IVFP(t) 0 - - - 3.267,86 3.267,86 12 - 5.508,40 3.846,18 70,00 3.267,86 7.044,04 24 - 3.437,67 7.255,43 190,00 3.267,86 10.333,29 36 - 10,76 10.459,14 310,00 3.267,86 13.417,00 48 1.210,40 7.536,79 430,00 3.267,86 10.374,65 60 1.949,39 8.180,56 550,00 3.267,86 10.898,41 72 2.940,51 8.696,28 670,00 3.267,86 11.294,14 84 3.169,20 5.023,36 790,00 3.267,86 7.501,22 96 3.342,19 4.597,01 910,00 3.267,86 6.954,87 108 3.630,95 3.587,00 1.030,00 3.267,86 5.824,86
Table 5 shows that the forest stand expectation value, FSEV(t), and, consequently, all values derived from it, vary not only with the age of cork oak trees but also with the year of striping off the cork. The FSEV(t) increases up to the first cork stripping off, after that it remains almost constant between the ages of 24 and 72 years. After that it decreases sharply.
Based on fire occurrences and burned areas of table 3, the cork oak data of table 4 and considering an area (A) of 4,000 ha we estimate the values of table 6.
12
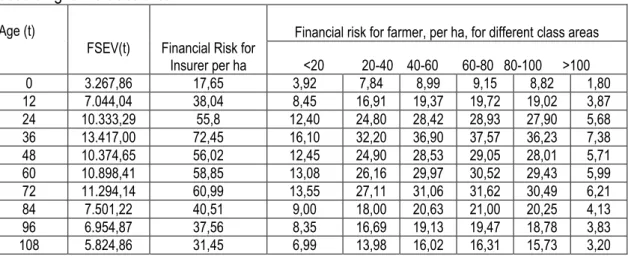
Table 6- Estimation of the average loss, per hectare, for the insurance company and for the farmer
according to his class area.
Age (t)
FSEV(t) Financial Risk for Insurer per ha
Financial risk for farmer, per ha, for different class areas <20 20-40 40-60 60-80 80-100 >100 0 3.267,86 17,65 3,92 7,84 8,99 9,15 8,82 1,80 12 7.044,04 38,04 8,45 16,91 19,37 19,72 19,02 3,87 24 10.333,29 55,8 12,40 24,80 28,42 28,93 27,90 5,68 36 13.417,00 72,45 16,10 32,20 36,90 37,57 36,23 7,38 48 10.374,65 56,02 12,45 24,90 28,53 29,05 28,01 5,71 60 10.898,41 58,85 13,08 26,16 29,97 30,52 29,43 5,99 72 11.294,14 60,99 13,55 27,11 31,06 31,62 30,49 6,21 84 7.501,22 40,51 9,00 18,00 20,63 21,00 20,25 4,13 96 6.954,87 37,56 8,35 16,69 19,13 19,47 18,78 3,83 108 5.824,86 31,45 6,99 13,98 16,02 16,31 15,73 3,20
Table 6 shows that the insurer financial risk is much bigger than individual farmer‟s one. This proves what above has been said, that if forest insurance was mandatory, the insurance company could dilute (to share) the fire risk among a large farm group, demanding from each one a insurance premium much smaller, which incentives the implementation of a system of risk insurance against fire. The financial risk for insurer, per hectare, depend upon the area (A) considered. As larger as that area is the smaller the financial risk will be.
6. Conclusions
This study allows us to take the following conclusions. On the one hand, if there exits historical disaggregated data of fire events, for a region (municipality or other territorial unit) and for different sort of trees, it is possible to build simple and precise models that allow estimating the probability of fire occurrences. The model accuracy will increase with the desegregation degree and with introduction of variables that take into account: weather conditions, orography, and management conditions of forest systems.
On the other hand, the forest stands expectation value for insurance purposes, for each species, can be obtained from governmental services, universities and research centers.
Finally, if forest fire insurance is compulsory, the insurance companies can divide the loss caused by fire events amongst a large number of farmers. Also, one way for governments promoting forest investments
13 can be paying part of farmer‟s forest insurance premiums.
Therefore, it does not seem difficult to chance the present conditions that make very difficult to find an insurance company that be willing to make a forest farm insurance. If this situation changes, a forest farmer, like any others entrepreneur, would share the risk fire paying fair insurance premiums. This will make forest investment less risky and so, more attractive
In short, this wok shows that a single forest famer with a small forest will not be able to pay a reasonable insurance premium unless a large forest area is insured that enables an insurer to cover his particular risk.
For this state of affairs to change the governments have to make forest fire insurance compulsory and research has to be done to find simple models to estimate, as accurate as possible, fire events probabilities and to calculate forest stand expectation value at different ages.
References.
Campos P, Y. Rodríguez, and A. Caparrós (2001). Towards the dehesa total income accounting: theory and operative Monfragüe study cases In P. Campos Palacin, ed. Special issue - Investigación
Agraria: Sistemas y Recorsos Forestales - Towards the New Forestlands Commercial and Environmental Benefits Accounting: Theories and Applications. 1(2001):43-67.
Campos, P., Caparrós, A. (2006). Social and private total Hicksian incomes of multiple use forests in Spain.
Ecological Economics 57: 545-557.
Cipra, T. (1994) Actuals Mathemetics in Practice, HZ Publishing Company, Prague.
Cummine, Alan (2000), Plantation Insurance: an introduction. National Policy Director, Australian Forest Growers;: Vic DNRE Seminar series, Financing Farm Forestry, May 2000, email: lalan.cummine@afg.asn.au
De Saint –Vincent (2000), R. De Saint- Vincent, Assurances des biens forestiers et gestion financière des risqués aux forêts in: S. Drouineau et. al., Editors. Expertise collective sur les tempêtes, la sensibilité
des forestset sur leur reconstitution. Dossiers de l’environment de l’INRA 20, forêts et tempête, INRA,
Paris ,pp. 229-237.
14 Nacional (1995-2000). Divisão de Inventário e Estatísticas Florestais. Direcção Geral das Florestas. Lisboa.
Díaz, M., Campos, P. and Pulido, F.J. (1997) „The Spanish dehesas: a diversity in land-use andwildlife‟, in D.J. Pain and M.W. Pienkowski (Eds), Farming and Birds in Europe. The Common Agricultural Policy
and its Implications for Bird Conservation. London, UK:Academic Press, pp.178–209.
Holecy, J. and M. Hanewinkel ( 2004), “A forest management risk insurance model and its application to coniferous stands in southwest Germany”, Forest Policy and Economics, Vol. 8. Issue 2, March 2006, pp. 161-174.
Pinheiro, A.C.,Ribeiro, N.A., Surový, P. and Ferreira, A.G. (2008) „Economic implications of different cork oak forest management systems‟, Int. J. Sustainable Society, Vol. I, No. 2, pp.149–157.
Ribeiro, N.A., Surovy, P. and Oliveira, A.C. (2006) „Modeling cork oak production in Portugal‟,in H. Hasenauer (Ed.), Sustainable Forest Management Growth Models for Europe. Berlin ,Heidelberg: Springer-Verlag, pp.285–313.
Ribeiro, N.A., Dias, S., Surový, P., Gonçalves, A.C., Ferreira, A.G. and Oliveira, A.C. (2004) „The importance of crown cover on the sustainability of cork oak stands. A simulation approach‟, in A.G. Ferreira and S. Schnabel (Ed.), Advances in Geoecology, Vol. 37, pp.275–286.
Shepard, H. B. (1935) “Forest Fire Insurance in the Pacific Coast States” Journal of Forestry, Volume 33, Number 2, 1 February 1935 , pp. 111-116(6)