www.scielo.br/aabc
Spatial resolution influence on the identification of
land cover classes in the Amazon environment
FLÁVIO J. PONZONI*, LÊNIO S. GALVÃO and JOSÉ C.N. EPIPHANIO
Instituto Nacional de Pesquisas Espaciais – INPE, Divisão de Sensoriamento Remoto Caixa Postal 515, 12201-970 São José dos Campos, SP, Brasil
Manuscript received on November 19, 2001; accepted for publication on August 5, 2002; presented byDiogenes A. Campos
ABSTRACT
To evaluate the role played by the spatial resolution in distinguishing land cover classes in the Amazon region, different levels of spatial resolution (60, 100, 120, 200 and 250 meters) were simulated from a Landsat 5 Thematic Mapper (TM) image. Thematic maps were produced by visual interpretation from the original (30×30 meters) and simulated set of images. The map legend included primary forest, old and young woody secondary succession, and non-forest. The results indicated that for the discrimination between primary forest and non-forest, spatial resolution did not have great influence for pixel size equal or lower than 200 meters. The contrary was verified for the identification of old and young woody secondary vegetation due to their occurrence in small polygons. To avoid significant changes in the calculated area of these land cover types, a spatial resolution better than 100 meters is required. This result is an indication that the use of the future Brazilian remote sensing satellite (SSR-1) for secondary succession identification may be unreliable, especially for latitudes between S10oand S15owhere critical areas of deforestation are located and pixel size is expected to vary within the same scene from 100 meters (S10o) to 200 meters (S15o).
Key words:spatial resolution, remote sensing, Amazon region, thematic maps, tropical rain forest.
1. INTRODUCTION
Concerns about deforestation estimates in the Amazon region have increased since the first data were published in 1978 from visual interpretation of Landsat Multispectral Scanner (MSS) images by the National Institute for Space Research (INPE – Brazil). The relative success of this first initiative motivated the improvement of the methodology used for deforestation quantification in the Amazon re-gion (INPE 2000). Since 1998, visual interpreta-tion has been performed on the computer screen at 1:100,000 scale using color composite images of the
Correspondence to: Flávio J. Ponzoni E-mail: [email protected]
Landsat 5 TM sensor. Alternative procedures, such as the use of images derived from the linear spec-tral mixture models (Shimabukuro et al. 1999) or from the segmentation technique (Rodriguez-Yi et al. 2000), followed by visual interpretation, have been considered recently. Other computer super-vised and/or unsupersuper-vised digital classification tech-niques were used by several researchers to map land cover classes in small portions of the Amazon region (e.g., Nelson and Holben 1986, Irons et al. 1985, Townshend and Justice 1988, Cihlar 2000).
res-olution. Townshend and Justice (1988) evaluated the influence of the spatial resolution on the global monitoring of land transformations, including land-scapes in the Amazon region. They concluded that a sensor with a resolution of 500 meters would be rec-ommended to provide the best compromise between land cover change characterization and the size of the resultant data volume. However, this conclusion was based on a global approach that is different from the regional one used in Brazil, in which clear cut-ting, secondary succession and selective logging are considered as deforestation categories. The identifi-cation of secondary succession stages of vegetation in the Amazon region is an important subject in the studies of the CO2atmospheric emission (Schimel et al. 1995, 1996), the ecosystem equilibrium (Mausel et al. 1993, Moran et al. 2000), and of the rain for-est ecosystem preservation (Alves and Skole 1996, Alves et al. 1997, McNeill et al. 1994).
A short review on the estimates of tropical for-est areas from data with different spatial resolution was presented by Mayaux and Lambin (1995). Ac-cording to Mayaux and Lambin (1995), deforesta-tion estimates by visual or digital analysis of high spatial resolution data require a good knowledge of the ecology and land use patterns of the area under investigation, which is difficult to achieve at very broad scales. A coarse spatial resolution leads to a loss of spatial detail at a rate that depends on the spa-tial structure of the landscape, thus affecting the esti-mate of the land cover area, the validation of results and the assessment of product accuracy. Moody and Woodcock (1994) mentioned the effect of spatial ag-gregation on the representation of cover-types pro-portions, which can be significant at broad scales. These effects are due to the necessity of correcting proportional errors, caused by the coarse spatial res-olution, to extract quantitative information on forest cover from broad scale maps and to compare such maps with finer scale observations. According to Achard et al. (2001), the legend maps and the sta-tistical data derived from coarse spatial resolution satellite sensors can be misleading without accuracy assessment and a correction procedure.
The objective of this work is to evaluate the influence of the spatial resolution on the identifica-tion of land cover classes in the Brazilian Amazon region. For this purpose, different levels of spatial resolution (60, 100, 120, 200 and 250 meters) were simulated from a Landsat 5 Thematic Mapper (TM) image (30×30 meters). The investigation is im-portant for the design of the future Brazilian remote sensing satellite (SSR-1) planned for the near fu-ture. The SSR 1 will operate in an equatorial orbit and carry on board three cameras with a large field of view. The cameras will collect images from N5oto S15oof latitude with an extremely short revisit time of less than two hours, thus improving the chances of acquiring cloud-free data (Carvalho et al. 1997). Because of the optical design of the camera mod-ules, pixel size should vary within the same scene from 50 meters (nadir), 100 meters (S10o), to 200 meters (15oS).
2. MATERIALS AND METHODS
The study area is located between the longitudes W66o59’ and W67o25’ and latitudes S09o53’ and S09o57’, in the State of Acre, Brazil. The area was selected due to the presence of typical Amazonian land cover types and the existence of previous re-search activities and resulting ground-based infor-mation. The landscape is characterized by the prin-cipal road and the secondary ones, locally called "feeder roads", which are perpendicular to the prin-cipal road. Along the road network, farmers have developed different types of commercial agriculture and pasture. Abandoned areas are also common and are characterized by different stages of secondary succession of vegetation.
scene produced by the future SSR 1 cameras, from nadir to extreme viewing. The algorithm is based on the assumption that most of the imagery systems for Earth remote sensing can be represented as linear filters having separable and gaussian Point Spread Functions. The procedure consists in enchaining elementary filters which have a small, finite Point Spread Function support. Details on the method, including equations and examples of applications, can be found in Banon (1990).
The current methodology adopted by INPE to calculate deforestation estimates in the Amazon re-gion is based on the use of a linear mixing model, followed by the segmentation of the shadow fraction image, in which unsupervised digital classification is performed. Refinements of these classification results are made through visual interpretation on the computer screen of color composites (TM3(blue), TM4(red) and TM5(green)). In the study area, the production of the thematic maps from both the orig-inal and the simulated images was performed essen-tially from visual interpretation on computer screen of color composites and from the availability of ground-based information. The legend adopted to produce the maps included the following land cover types: primary forest (preserved tropical rain for-est), old and young woody secondary succession vegetation stages (woody biomass that grows af-ter land abandonment), and non-forest (soil, pas-ture and crops). The area of these land cover types in each of the six thematic maps (original plus five simulated images) was calculated by an algorithm.
The map generated from the original TM/Land-sat image (30×30 meters) was considered as refer-ence in order to compare the results achieved with the other levels of spatial resolution. This compar-ison was performed by using the contingency ta-ble to calculate the Kappa coefficient of agreement, an index frequently derived to express classification accuracy (Foody 2002). The Kappa coefficient to express the map category accuracy is described by Congalton (1991) through the equation:
Kappai =
nxi+x+i nxi+−xi+x+i
where:
– Kappaiis the Kappa coefficient for the map
cat-egory i;
– nis the total number of observations;
– xi+andx+i are the marginal raw and column
to-tals, respectively.
The global mapping accuracy (all map cate-gories together) of each thematic map was based on the equation described by Bishop et al. (1975):
Kappat ot al = n
l i=1
xi− l i=1
(xi+x+i)
n2−
l i=1
(xi+x+i)
where:
– Kappat ot al is the Kappa coefficient considering
all the map categories;
– nis the total number of observations;
– xi+andx+i are the marginal raw and column
to-tals, respectively;
The significance of the Kappa coefficients was not calculated since these coefficients were deter-mined rather than estimated for the entire study area or for each map category.
3. RESULTS AND DISCUSSION
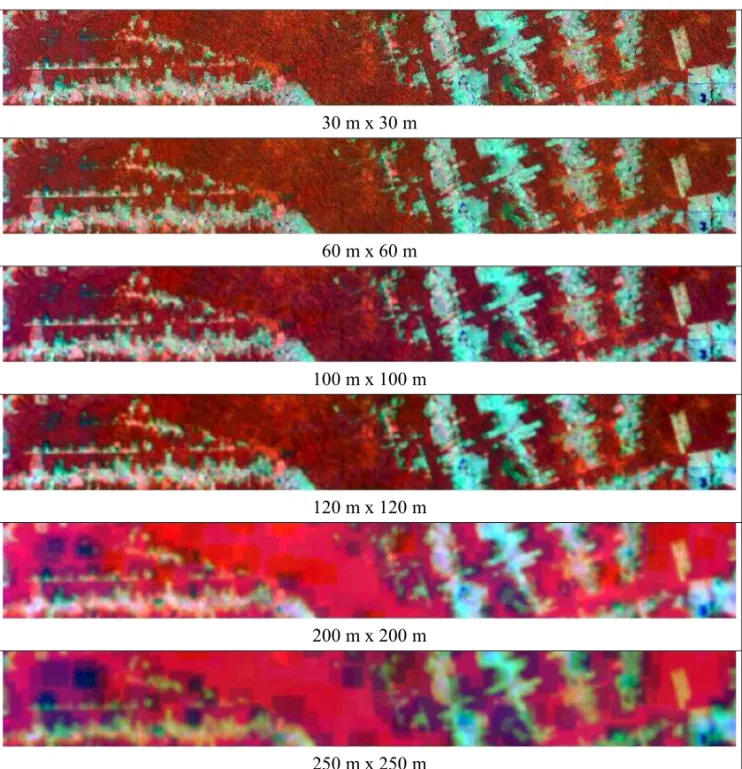
Figure 1 shows the color composites of the origi-nal and simulated Landsat 5/TM images used in the visual interpretation. The images were enhanced by linear contrast stretch. In Figure 1, primary for-est and old/young woody secondary vegetation are represented by reddish shades, whereas non-forest surface components (e.g., soil, emerging and green pasture, crops) appear in bluish and yellowish col-ors.
30 m x 30 m
60 m x 60 m
100 m x 100 m
120 m x 120 m
200 m x 200 m
250 m x 250 m
Fig. 1 – Landsat 5/TM images at different simulated levels of spatial resolution. The bands 3, 4 and 5 are depicted in blue, red and green colors, respectively.
the smoothing of polygon boundaries that charac-terize the transition between forest and other surface components. Furthermore, by coarsening the spatial resolution, small polygons of old and young woody secondary vegetation disappear or are incorporated into the other land cover types.
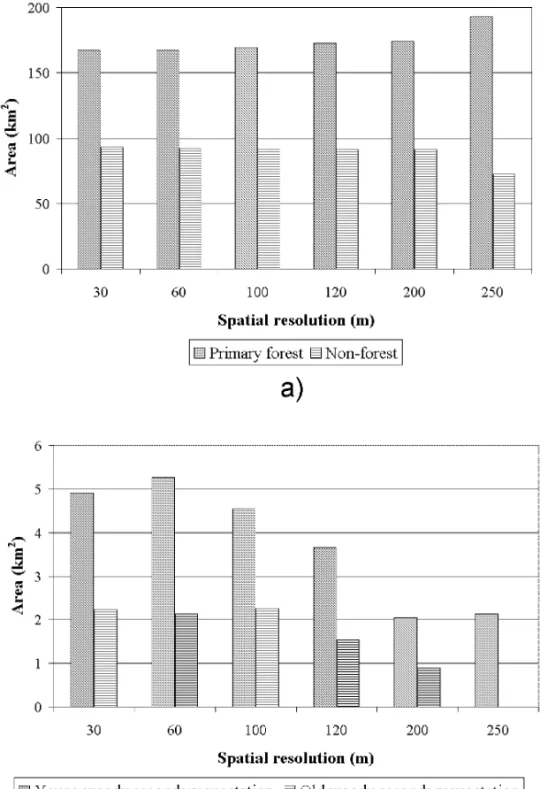
Figure 3 illustrates changes in area of each land cover type as a function of the spatial resolution.
30 m x 30 m
60 m x 60 m
100 m x 100 m
120 m x 120 m
200 m x 200 m
250 m x 250 m
Forest
Legend: Non-forest
Young woody secondary vegetation
Old woody
secondary vegetation
Fig. 2 – Thematic maps resulting from visual interpretation of the Landsat 5/TM images of Figure 1 with different simulated levels of spatial resolution.
for simulations with pixel size higher than 100 me-ters due to the small size of their polygons that tend to disappear with pixel size increase (Figure 3b). These results are in agreement with those achieved by Pax-Lenney and Woodcock (1997) who studied the effects of spatial resolution on the agricultural monitoring. According to Pax-Lenney and
Fig. 3 – Area estimates for forest and non-forest in (a) and for old and young woody secondary vegetation in (b), as a function of the simulated spatial resolution values.
the best compromise between land change detection and data volume, would affect the accuracy of the identification of the woody secondary vegetation in the Amazon region.
Variations in Kappa coefficient, that represent
most sensitive land cover types to changes in spa-tial resolution due to their occurrence in small size polygons in the study area. Significant changes in accuracy values for these surface components are observed for simulations from 100 to 250 meters. From 30 to 250 meters, the old woody secondary vegetation was almost completely incorporated into the primary forest class because of the spectral sim-ilarity of these arboreal covers. In Figure 3b, the area of this land cover decreases from 2.24 km2(30 meters spatial resolution) to 0.12 km2(250 meters). On the other hand, the area of occurrence of the young woody secondary vegetation decreases from 4.95 km2to 2.13 km2with pixel size increase, and the remaining difference (error of visual interpre-tation) is interpreted mainly as primary forest and non-forest. Because land cover types are incorpo-rated into the primary forest class in some extent with coarsening spatial resolution, there is a rela-tive increase in the area of this class with pixel size increase, as shown in Figure 3a.
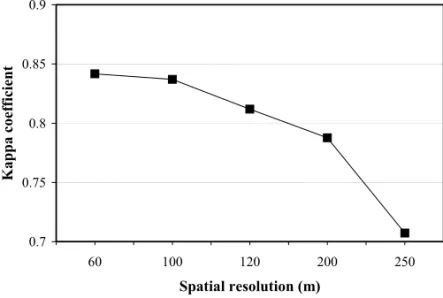
In Figure 5, when all land cover classes are considered, results from determination of the total Kappa coefficient show that the map accuracy tends to decrease for spatial resolution coarser than 100 meters.
4. CONCLUSIONS
The results indicated that the spatial resolution had a strong impact on the identification of old and young woody secondary vegetation in the Amazon envi-ronment due to the interaction of the size of these land cover types with the image spatial resolutions examined. The optimal value of spatial resolution for the identification of these land cover types was 100 meters due to the landscape characteristics of the woody vegetation regrowth in small average size abandoned areas. For spatial resolution coarser than 100 meters, significant changes in the calculated area of the woody secondary vegetation were ob-served in the study area. On the other hand, the optimal value for a simple discrimination between forest and non-forest areas was 200 meters. Spatial
resolution coarser than 200 meters produces an in-crease in area of forest due to pixel incorporation of other land cover types (e.g., old woody secondary vegetation).
This result has important implications for the planned Brazilian equatorial orbit satellite SSR 1. Because of the optical design of the camera mod-ules, pixel size should vary within the same scene according to the latitude of data acquisition (50 me-ters at nadir; 100 meme-ters at S10o; and 200 meter at S15o). Since most of the critical areas of defor-estation are located between S10oand S15o, the use of SSR 1 for identification of the woody secondary vegetation classes and deforestation estimates will be unreliable due to pixel size values higher than 100 meters at these latitudes.
This study is also important for global scale investigations by providing specific information on the relationships between the regional identification of Amazonian land cover types and the spatial reso-lution.
5. ACKNOWLEDGMENTS
The authors are grateful to theCoordenação Geral de Engenharia e Tecnologia Espacial(ETE/INPE)
for providing essential information related to the planned SSR 1.
RESUMO
0 0.2 0.4 0.6 0.8 1
60 100 120 200 250
Spatial resolution (m)
Kappa coefficient
Forest
Non-forest
Young Secondary Vegetation Old Secondary Vegetation
Fig. 4 – Kappa coefficients, calculated in relation to the mapping of the original Landsat 5/TM image (30×30 meters), for different land cover types and spatial resolution.
0.7 0.75 0.8 0.85 0.9
60 100 120 200 250
Spatial resolution (m)
Kappa coefficient
Fig. 5 –Total Kappa coefficients calculated from all land cover types.
das áreas das formações florestais secundárias, uma vez que elas ocorrem sob forma de pequenos polígonos. Para evitar mudanças significativas no cálculo de área dessas formações, uma resolução espacial melhor que 100 me-tros é necessária. Esse resultado é uma indicação de que o uso do futuro satélite brasileiro de sensoriamento remoto (SSR-1) para a identificação de vegetação secundária em paisagens semelhantes a essa da área de estudo pode ser di-ficultado, especialmente para latitudes entre S10oe S15o.
Entre estas latitudes, estão localizadas áreas críticas de desflorestamento e o tamanho do pixel deverá variar em
uma mesma tomada de cena entre 100 metros (S10o) e 200 metros (S15o).
Palavras-chave: resolução espacial, sensoriamento re-moto, Amazônia, mapas temáticos, floresta tropical.
REFERENCES
Alves DS and Skole DL.1996. Characterizing land cover dynamics using multitemporal imagery. Int J Remote Sens 17: 835-839.
Alves DS, Soares JV, Amaral S, Mello EK, Almeida SAS, Silva OF and Silveira AM.1997. Biomass of primary and secondary vegetation in Rondônia, Western Brazilian Amazon. Glob Change Biol 3: 451-461.
Banon GJF.1990. Simulação de imagens de baixa reso-lução. Rev Soc Bras Autom 2: 180-192.
Bishop YMM, Fienberg SE and Holland PW.1975. Discrete multivariate analysis: theory and practice. Cambridge: The MIT press, 1975. 557p.
Carvalho H, Santana C and Kono J.1997. A Brazil-ian satellite to observe and monitor the Amazon re-gion. Nouv Rev Aeronaut Astronaut 6: 56-60.
Cihlar J.2000. Land cover mapping of large areas from satellite: status and research priorities. Int J Remote Sens 21: 1093-1114.
Congalton RG.1991. A review of assessing the accu-racy of classifications of remotely sensed data. Re-mote Sens Environ 37: 35-46.
Foody GM. 2002. Status of land cover classification accuracy assessment. Remote Sens Environ 80: 185-201.
Instituto Nacional de Pesquisas Espaciais (INPE). 2000. Monitoring of the Brazilian Amazonian forest by satellite:1998-1999. Instituto Nacional de Pesqui-sas Espaciais, São José dos Campos, Brazil, 2000, 22p.
Irons JR, Markham BL, Nelson RF, Toll DL, Willians DF, Latty RS and Stauffer ML.1985. The effects of spatial resolution on the classification of Thematic Mapper data. Int J Remote Sens 6: 1385-1404.
Mausel P, Wu Y, Moran EF and Brondízio ES.1993. Spectral identification of successional stages follow-ing deforestation in the Amazon. Geocarto Int 8: 61-71.
Mayaux P and Lambin EF.1995. Estimation of tropical forest area from coarse spatial resolution data: a two-step correction function for proportional errors due to spatial aggregation. Remote Sens Environ 53: 1-15.
McNeill J, Alves D, Arizpe L, Bykova O, Galvin K, Kelmelis J, Migot-Adholla S, Morrisette P,
Moss R, Richards J, Riebsame W, Sadowski F, Sanderson S, Skole D, Tarr J, Williams M, Yadav S and Young S.1994. Toward a typol-ogy and regionalization of land-cover and land use change. In: Meyer WB and Turner BL(Eds.), Changes in land use and land cover: a global per-spective, Cambridge: Cambridge University Press, p. 55-72.
Moody A and Woodcock CE.1994. Scale-dependent errors in the estimation of land-cover proportions-implications for global land-cover datasets. Pho-togramm Eng Remote Sens 60: 585-594.
Moran EF, Brondízio ES, Tucker JM, Forsberg-Sil-va MC, McCraken S and Falesi I.2000. Effects of soil fertility and land-use on forest successional in Amazônia. Forest Ecol Manag 139: 93-108.
Nelson R and Holben B.1986. Identifying deforesta-tion in Brazil using multiresoludeforesta-tion satellite data. Int J Remote Sens 7: 429-448.
Pax-Lenney M and Woodcock CE.1997. The effect of spatial resolution on the ability to monitor the status of agricultural lands. Remote Sens Environ 61: 210-220.
Rodriguez-Yi JL, Shimabukuro YE and Rudorff BFT.2000. Image segmentation for classification of vegetation using NOAA-AVHRR data. Int J Remote Sens 21: 167-172.
Schimel D, Enting IG, Heimann M, Wigley TML, Raynaud D, Alves D and Siegenthaler U.1995. CO2 and the carbon cycle. In: Houghton JT et al.(Eds.), Climate change 1994, Cambridge: Cam-bridge University Press, p. 35-71.
Schimel D, Alves D, Enting I, Heimann M, Joos F, Raynaud D and Wigley T.1996. Radiative forcing of climate change. In:Houghton JT et al.(Eds.), Climate change 1995, Cambridge: Cambridge Uni-versity Press, p. 66-131.
Shimabukuro YE, Duarte V, Mello EMK and Mo-reira JC.1999. RGB shade fraction images derived from multitemporal Landsat TM data for study-ing deforestation in Brazilian Amazon. Int J Remote Sens 20: 643-646.