article
Past and present land use influences on tropical riparian zones: an isotopic assessment
with implications for riparian forest width determination
Luiz Felippe Salemi1,5,6, Silvia Rafaela Machado Lins1, Elizabethe de Campos Ravagnani1
Marcelo Magioli2, Melissa Gaste Martinez1, Fernando Guerra3, Natassia Bonini Vidas1, Aline Fransozi4,
Silvio Frosini de Barros Ferraz4& Luiz Antonio Martinelli1
1
Universidade de Sa˜o Paulo, Centro de Energia Nuclear na Agricultura, Laborato´rio de Ecologia Isoto´pica, Piracicaba, SP, Brazil.
2
Laborato´rio de Ecologia, Manejo e Conservac¸a˜o de Fauna Silvestre, Universidade de Sa˜o Paulo, Escola Superior de Agricultura ‘‘Luiz de Queiroz’’, Cieˆncias Florestais
Av. Pa´dua Dias, 11, 13418-900, Piracicaba, SP, Brazil.
3
Universidade de Sa˜o Paulo, Centro de Energia Nuclear na Agricultura, Laborato´rio de Fertilidade do Solo, Piracicaba, SP, Brazil.
4
Laborato´rio de Hidrologia Florestal, Universidade de Sa˜o Paulo, Escola Superior de Agricultura ‘‘Luiz de Queiroz’’, Cieˆncias Florestais, Av. Pa´dua Dias, 11, 13418-900, Piracicaba, SP, Brazil.
5
Universidade de Brası´lia, Faculdade de Planaltina, Divisa˜o de Cieˆncias da Vida e da Terra,
6
Corresponding author: Luiz Felippe Salemi, e-mail:lfsalemi@unb.br
SALEMI, L.F., LINS, S.R.M., RAVAGNANI, E.C., MAGIOLI, M., MARTINEZ, M.G., GUERRA, F., VIDAS, N.B., FRANSOZI, A., FERRAZ, S.F.B., MARTINELLI, L.A.Past and present land use influences on tropical riparian zones: an isotopic assessment with implications for riparian forest width determination.Biota Neotropica. 16(2): e20150133. http://dx.doi.org/10.1590/1676-0611-BN-2015-0133
Abstract: In this article, by using carbon stable isotopes, we assessed the past and present land use influences that riparian areas are subject within agricultural landscapes. Emphasis is given to the understanding of the effects of the 2012 Brazilian Forest Act on such areas. We selected five riparian areas within a highly C4dominated agricultural landscape. Three of them had 30 meters native riparian forest
buffer (NRFB) and two of them had 8 meter and no NRFB. We used three 100 meter-transects located 5, 15 and 30 meters relative to stream channel to obtain soil samples (0 – 10 cm). All riparian areas presented soil carbon isotopic signatures that are not C3(native forests) irrespective of having or not 30 meters
NRFB. Two cases presenting less than 30 meters NRFB had higher C4derived carbon contribution. All of
the other three areas that followed the 30 meters NRFB presented, to some degree, C4derived carbon,
which was attributed to C4organic matter deposition originated from cultivated areas and, in one case, to
the persistence of former exotic grasses. With the 2012 Forest Act allowing narrower buffers (o30 meters),
we expect C4contributions to soil organic matter to remain high in riparian areas and streams within
agricultural landscapes dominated by C4 plants where 30 meter NRFB is no longer required. Such
contributions will likely continue to have detrimental effects on stream water quality and biota.
Keywords: Watershed; Soil degradation; Organic matter; Sediment; Carbon cycling.
SALEMI, L.F., LINS, S.R.M., RAVAGNANI, E.C., MAGIOLI, M., MARTINEZ, M.G., GUERRA, F., VIDAS, N.B., FRANSOZI, A., FERRAZ, S.F.B., MARTINELLI, L.A. Influeˆncias prete´ritas e presentes do uso da terra sobre zonas ripa´rias tropicais: uma avaliac¸a˜o isoto´pica com implicac¸o˜es para a
determinac¸a˜o da largura de florestas ripa´rias.Biota Neotropica. 16(2): e20150133.http://dx.doi.org/10. 1590/1676-0611-BN-2015-0133
Resumo:Neste artigo, ao utilizar iso´topos esta´veis de carbono, no´s avaliamos as influeˆncias presentes e prete´ritas do uso da terra a que as a´reas ripa´rias esta˜o sujeitas quando situadas dentro de paisagens agrı´colas. Eˆ nfase e´ dada ao entendimento dos efeitos do Co´digo Florestal de 2012 em tais a´reas. No´s selecionamos cinco a´reas ripa´rias em uma paisagem agrı´cola altamente dominada por plantas C4. Treˆs
delas apresentam faixa ripa´ria de floresta nativa (FRFN) de 30 metros de largura e as outras duas apresentam FRFN de 8 e 0 m (i.e. sem FRFN). No´s utilizamos treˆs transectos de 100 metros localizados a 5, 15 e 30 metros de distaˆncia do canal fluvial para obter amostras de solo (0 – 10 cm). Todas as a´reas ripa´rias apresentaram assinaturas isoto´picas do carbono do solo que na˜o sa˜o C3 (floresta nativa)
independentemente de apresentarem ou na˜o FRFN de 30 metros. Os dois casos em que FRFN era menor que 30 m apresentaram maior contribuic¸a˜o de carbono oriundo de plantas C4. Todas as outras
treˆs a´reas com FRFN de 30 m tambe´m apresentaram, em algum grau, carbono oriundo de plantas C4.
Todas as outras treˆs a´reas com FRFN de 30 m tambe´m apresentaram, em algum grau, carbono oriundo de plantas C4que foi atribuı´do a` deposic¸a˜o de mate´ria orgaˆnica de plantas C4originada das a´reas
cultivadas e, em um caso, a` persisteˆncia de gramı´neas exo´ticas pre´-existentes. Com o Co´digo Florestal de 2012 permitindo FRFN mais estreitas (o30 metros), no´s esperamos que a contribuic
¸a˜o de plantas C4
para a mate´ria orgaˆnica permanec¸a alta em a´reas ripa´rias e rios dentro de paisagens agrı´colas dominadas
por plantas C4 onde a FRFN de 30 m na˜o e´ mais uma obrigac¸a˜o. Tais contribuic¸o˜es ira˜o,
provavelmente, continuar a ter efeitos prejudiciais a` qualidade de a´gua dos rios e a` sua biota.
Palavras-chave: Bacia hidrogra´fica; Degradac¸a˜o do solo; Mate´ria orgaˆnica; Sedimento; Ciclagem de carbono.
Introduction
Riparian ecosystems generally perform many important ecological processes. When these streamside ecosystems are under forest cover these areas are considered to be important due to a series of reasons: (i) protection of stream banks against erosion and bank sliding (Abernethy & Rutherford 2000); (ii) reduction of erosion and input of soil particles into the stream (Lowrance et al. 1986, Verstraeten et al. 2006, Pires et al. 2009); (iii) shading and reduction of the water temperature (important for fish reproduction) (Imholt et al. 2013); (iv) riparian forests provide nutrients and carbon to aquatic communities (Lowrance et al. 1985); and they might also increase the input of coarse woody debris to the stream channel, which is important in creating habitat diversity within the stream environment (De Paula et al. 2011). These attributes of riparian forests are especially important in watersheds dominated by upland agricultural fields, where soil disturbance by cultivation and use of fertilizers and agrochemicals are frequent.
Several studies have shown that the width of the riparian forest is an important characteristic regarding some of the aforementioned attributes (Wenger, 1999, Zhang et al., 2010). Using meta-analysis, Zhang et al. (2010) showed that in order to perform these processes, at least a width of 20 m is required, although, depending on the attributes in view, different widths might be required (for more details, see Wenger 1999, Sparovek et al. 2002, Hawes & Smith 2005, Yuan et al. 2009). However, if all these important processes are to be achieved in a single place at the same time, the process that requires a wider buffer might be the one that should be adopted.
In Brazil, riparian areas are protected by law according to the Forest Act that is the Brazilian federal legislation that regulates the presence and distribution of the minimal native forest cover within rural private properties. This Act was originally created in 1934 and it was reformulated in 1965. Such Act stipulated that surface water bodies should have a riparian buffer around them to guarantee soil, water, biodiversity resources conservation and ecosystem processes. In the case of small streams (410 meters wide), the riparian buffer should
present a minimum of 30 m and springs should have a 50-meter buffer. These two buffers are denominated ‘permanent pre-servation areas’ in the Brazilian Forest Act and should be under the native vegetation cover (i.e. riparian forests) in order to guarantee their conservation goal.
In 2012, the Brazilian Congress approved a series of changes in the aforementioned Forest Act allowing the decrease of the width of riparian buffers needed to be restored in rural properties in cases where the law had not been
followed. This led to the reduction, in many cases, of the riparian buffers around small streams. For instance, the riparian buffer width in the 2012 Forest Act might be of only 5 meters instead of the 30 meters previously stablished in the 1965 Forest Act.
In Sa˜o Paulo State, the most economically developed state of Brazil, rural areas are intensively used and currently dominated by C4plants such as sugarcane and tropical forage
grass species (Rudorff et al. 2010, Adami et al. 2012), whereas forest remnants are generally dominated by C3 plants. These
two types of photosynthetic pathways generate different carbon isotopic composition (Farqhuar et al. 1989). C3plants
generally have ad13C around -28%, which is lower compared
to -12% which is the d13C average value for C4 plants
(Farqhuar et al. 1989). Therefore, carbon isotopic composition of the soil organic matter is highly influenced by vegetation cover (Zhang et al. 2015). This fact allows the use of carbon stable isotopes to track the source of organic matter (C3versus
C4) and relate it to land-cover (Martinelli et al. 1996).
In this study, we used carbon isotopic signature of the surface soil organic matter in order to investigate past and present land use influences on riparian areas of small agricultural watersheds in Southeast Brazil. Although the findings of this study are specific to the studied watersheds, we advocate here that the carbon isotopic signature of soil organic matter can be used as a proxy of the Forest Act compliance anywhere in the country in cases where the original forest was replaced by C4plants (forage grasses, sugarcane and
corn). We chose five small watersheds to conduct this study; three of them were in compliance with the Forest Act regarding the width of the riparian forest; and in two of these watersheds the riparian forest width was less than 10 meters.
Material and Methods
Study areas
The selection of the areas was based on finding agricultural areas dominated by C4 crops with possible influence of C4
-derived carbon on riparian areas, which, at least initially, would be expected to present a dominance of C3signal when
relative humidity of around 70%) and wet season (October to March; mean monthly temperature of around 24.4 °C and relative humidity around 80%). The annual rainfall in the region is approximately 1,400 mm, and the mean annual temperature is approximately 22°C.
All five small watersheds are within the domain of the Atlantic Forest biome. According to local farmers, the water-sheds of streams 1 and 5 were converted to cornfields around the 1930s and after 20 years, corn was converted to sugarcane. Although these two watersheds are very close geographically, they present very different riparian forest cover patterns, being around 5 to 10 meters in the former, and 30 meters wide in the latter. In the watershed 2, pasture has been established for at least 13 years without any riparian forest left. Watersheds of streams 3 and 4, in turn, were covered by pasture and pasture and sugarcane, respectively, for at least 10 years with riparian forest buffer of 40 meters or more (Figure 1). In the watershed 3, interviews with local farmers revealed that the riparian area had been under pasture (Andropogon bicornis L.) until 1988. After
that, forest restoration practices took place and the area was recovered by native forest again as it is at the present moment. Soils in four of the five riparian areas are generally classified as Ultisols (Udults); the only exception is in the riparian area of watershed 4 in which the soil is classified as an Oxisol (Udox). The topography is generally formed by gentle slopes (B8%) in areas under Ultisol soil type, and under gentle
to flat slopes (B3%) in the watershed 4.
Sampling design
In order to investigate the presence of carbon from C4
plants, three 100-m transects were established parallel to the stream channels at a distance of 5, 15 and 30-m from to the stream channel (Figure 1). Each transect started from the spring to 100 meters downstream. Soil samples were obtained every 10 meters in each transect totaling 10 soil samples per transect. The sampling procedure was made by using Dutch augers to collect soil samples from 0 to 10 cm soil layer as
Figure 1.Five riparian areas within the five small watersheds (W). Dark areas within W-1 to 5 indicate forest (C3) cover whereas ligher colours
indicate C4cover. Black circles, triangles and quadrats indicate soils sampling points in linear transects located 5, 15 and 30 meters relative to
stream channel. Scale on the bottom left corner refers to watersheds images whereas scale on the right, above W-5 image, refers to the map.
Table 1.Location and land use in the riparian areas of the five small watersheds.
Watershed Municipality Coordinates Land-use Riparian forest buffer
width (m)
1 Piracicaba 22 36044.82" S 47 40019.76" O Sugarcane
B8
2 Piracicaba 22°43032.03"S 47°31029.11"O Pasture Absent
3 Limeira 22°30033" S 47°15012" O Citrus/Pasture 30
adopted elsewhere (Powers & Schlesinger 2002). Soil samples were collected from April to June 2011.
Soil analysis
Soil samples were previously air-dried and then sieved to
o2 mm in order to remove rocks, roots, leaves and charcoal.
A sub-sample of 10 g of each sample was obtained using a Jones splitter. Afterwards, it was homogenized and milled. Finally, 5 mg of this sub-sample was weighed and packed separately into tin capsules.
The 13C:12C ratio was determined using a mass spectro-meter, Delta Plus from Finnigan Mat, and the isotopic ratio was reported as d13C (%) notation using the following
equation:
d13Cð Þ ¼% 1000 Rsample Rstandard
=ðRstandardÞ
Where:
d13C: is the abundance of13C in the sample
R sample: is the sample13C:12C ratio R standard: is the standard13C:12C ratio
The precision for carbon isotope was obtained by running an internal standard and it was 0.2%.
We assumed that organic matter derived from C3plants has d13C value equal to -27.9%which is the lowestd13C measured in our five study areas, and plant organic matter derived from C4 plants has ad13C4 as -11.3%based on an broad isotopic
analysis carried out in Brazil available elsewhere (see Assad et al. 2013). The percentage contribution from C4-derived
carbon is given by the following isotope dilution equation:
C4ð Þ ¼% d13Csoil d13C3Þ= d13C4 d13C3
Where:
d13Csoil is the carbon isotopic composition of the soil
organic matter;
d13C
3is the carbon isotopic composition of C3vegetation
( 27.9%); and
d13C4is the carbon isotopic composition of C4vegetation
( 11.3%).
Results
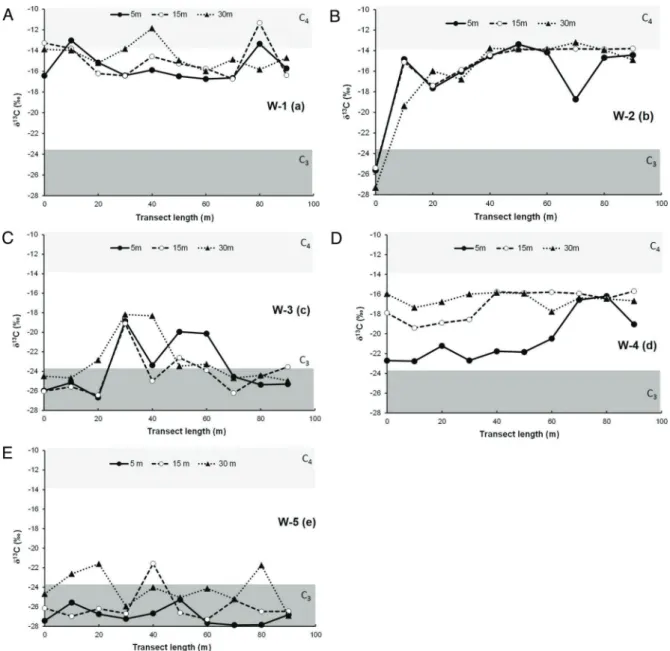
The two riparian area with low or null forest cover (watersheds 1 and 2) had soil d13C values predominantly
higher than -17%, some reaching values as high as 12%,
denoting a high contribution of C4derived organic matter to
the soil (Figure 2a, b). In the watershed 1, even the 5-m sampling points that are located within the riparian forest remnant had approximately 75% of organic carbon derived from C4 plants, suggesting that the entire riparian zone had
influence of C4 plants (Table 2). In the riparian area of the
watershed 2, the d13C of the soil near the spring resembled
those values of C3vegetation, being lower than 24%. After
that, a marked downstream increase in the soild13C values in
all three transects were observed, with values predominantly higher than -18%, denoting a clear dominance of C4 derived
carbon (Figure 2b). In these transects, with the exception of the spring, the average C4 derived carbon contribution was
approximately 70% (Table 2).
In the watersheds 3, 4 and 5 forest covers more than 30 m of the riparian area (Figure 2b to 2d). Although there is the dominance of C3 vegetation cover, only the watershed 5 soil
showed a clear soild13C values resembling those typical of C3
vegetation cover. In this watershed, soil samples collected along the 5-m transect line had d13C values varying from
approxi-mately -28% to -25%, typically within the C3 plants range
values (Figure 2e). Soild13C values were higher in the other two transects of watershed 5, but with few values higher than -22%, evidencing a low contribution of C4plants to the soil in
this watershed (Table 2). In the riparian areas of watershed 3,
d13C values were lower than -24% from 0 to 20 meters,
increasing to values varying from -24 to -18% in the middle
portion of the transect (from 20 to 70 meters). In the final part of the transect (from 70 to 100 m), soil d13C values decrease again to values lower than -24% (Figure 2).
There-fore, there was a low C4contribution to the soil organic matter
in the portion closer to the spring and in the final portion of the transect. Finally, the soild13C of riparian areas of watershed
4 varied between -22 to -16%along the transect, suggesting a
mixture in different proportions of C3 and C4 vegetation
(Figure 2d). Lower d13C values were observed in the
5m-transect line with values varying from -22 to -20%in the first
60 meters, and increasing to approximately -18%in the final 40 meters of the transect, denoting an increase in the contribution of C4derived organic matter in this last portion of the transect
(Table 2). The soild13C values observed in the 15m-transect
line varied from -18 to -16%in the entire transect, while values
increased to approximately -16%in the 30m-transect line. The
average C4contribution along the 5m-transect line was 44%,
increasing to 66 to 69 % in the 15m and 30m-transect lines, respectively (Table 2).
Discussion
d13C variability within riparian areas
There was no forest left in the majority of riparian area of watershed 2 that since 2002 has been covered by C4 grass
forage. Only around the spring, the C3contribution to the soil
increases due to the proximity of remnant forest immediately upslope the spring. In the rest of the transect, forest (C3) is
practically absent and there is no litter layer on the soil surface. In this case, the vegetation cover and the soil organic matter have similar d13C values, and this area is clearly in no
compliance with the Forest Act.
The watershed 1 forest cover width is wider than watershed 2 forest cover, reaching an average of 8 meters. The soild13C in
this area (5m-transect) does not reflect thed13C of the forest, but instead thed13C of a C4 vegetation, suggesting that this
forest is a young secondary growth that did not yet contributed substantially to the soil organic matter (Marin-Spiotta et al. 2009) or that upland C4 influences within this area are
substantial due to C4 organic matter deposition (Pires et al.
2009). The soild13C of the 15 m and 30 m-transect lines reflect
the C4vegetation type. This riparian area is not also complying
with the Forest Act.
In the riparian area of watershed 5 (with a forest cover 30 meters wide), thed13C of the soil showed an unequivocal
C3signal. Therefore, there is a full compliance of this riparian
entrance of upland C4carbon in the riparian given the higher
contribution of C4derived organic matter in the 30-m transect.
The riparian area of the watershed 3 is also covered with forest 30 m wide; however, this area was entirely covered by C4
forage grasses untilB25 years ago when it was left for recover.
Based on the soild13C values, it seems that the C3vegetation
replaced the old C4forage only in the first and final part of the
transect. It seems that in the middle, the signal of C4vegetation
of the old pasture still remains in the soil. Alternatively, the origin of this C4material present in the middle of the transect
could be generated upland by soil erosion and further deposition in this area. Several studies have documented the strong deposition rates of overland-flow derived materials within riparian areas, especially in flow convergence zones (i.e. depressions) (Lowrance et al. 1986, Cooper et al. 1987, Cavalcanti & Lockaby 2005, Cavalcanti & Lockaby 2006, Schoonover et al. 2006, Pires et al. 2009, Kreutzweiser et al. 2009, Mamoli et al. 2012). Moreover, there is the fact that tussocks of this grass were observed in the forest during our
Table 2.Contribution (%) of C4derived carbon in each of the transects
within the five small watersheds (W).
Transects
5 m 15 m 30 m
W Mean S.D. Mean S.D. Mean S.D.
1 74 8 78 11 81 7
2 69 22 73 22 70 26
3 26 17 22 13 30 15
4 44 15 66 9 69 4
5 6 5 11 10 22 11
*S.D.: standard deviation
Figure 2.d13C variation throughout the 5, 15 and 30 m transects in the W-1 (a), W-2 (b), W-3 (c), W-4 (d) and W-5 (e). The top rectangles in the
light grey indicates the expected area for C4signals while the bottom rectangles in dark grey indicates the expected area for C3signals. Middle
field campaigns, suggesting that this C4signal might be derived
from this persistent grass species (Guarantini et al. 2008, Griscom et al. 2009, Brancalion et al. 2009). The same is true for the riparian area of the watershed 4 that also has a large forest area wider than 30 meters, but still shows a clear C4sign
in the soil, which could be generated upland or be a remnant of the old pasture.
Another point that has to be mentioned is related to riparian forest age. The younger the riparian forest, the weaker would be the C3 signal in soil organic matter (Marin-Spiotta
et al. 2009). Provided that most of riparian forests presented here are riparian forest remnants (watersheds 1, 4 and 5), no
in situinfluence (i.e. soil organic matter replacement by direct land use in the area) was responsible for our results. Even at watershed 3, which has a B25 years old riparian forest, the
course of recovery towards a C3 signal can be seen in most
parts of the transects. This is in accordance with findings that show that soils dominated by C4 organic matter became
dominated by C3organic matter within approximately 10 years
after reforestation (Cook et al. 2014).
Soil organic matter: proportion of C4derived carbon
A study carried out in the same municipality of the present study (i.e. Piracicaba, Sa˜o Paulo State, Brazil) showed that 50 years after a land-use conversion from forest (C3) to
sugarcane (C4), the soil under sugarcane still had
approxi-mately 40% of soil organic matter derived from forest (Vitorello et al. 1989). In other areas, a similar persistence of the C3vegetation in the soil organic matter has been observed.
For instance, Roscoe et al. (2001) assessed the replacement of a C3 Cerrado-type vegetation physiognomy by an exotic grass
Brachiaria spp. (C4). They found that higher replacement
occurred at the first soil horizon (i.e. A horizon) where about 36% of the soil organic C was still derived from the C3
vegetation after 23 years of pasture cultivation (Roscoe et al. 2001). Our results, in turn, show that after approximately 13 to 60 years under C4plants, a proportion of 25 – 30% C3derived
carbon still can be found in the riparian areas of watersheds 1 and 2. Differences between the present study and the one by Vitorello et al. (1989) might be related to soil characteristics such as texture (Roscoe et al. 2001) or other factors affecting soil carbon turnover rate (Powers & Schlesinger 2002; Telles et al. 2003) such as soil moisture that might be typically higher in riparian soils compared to upland soils (Luiza˜o et al. 2004). Moreover, the long-term persistence of C3 signals in the
riparian areas of watersheds 1 an 2 might be attributed to highly recalcitrant organic matter or organic matter that is tightly bound to clay soil particles (Roscoe et al. 2001, Powers & Schlesinger 2002, Telles et al. 2003, Alcaˆntara et al. 2004, Marin-Spiotta et al. 2009).
Implications for riparian forest buffer width determination
The fact that riparian areas of watersheds 1 and 2, and even watersheds 3 and 4 showed clear contributions of C4 derived
carbon, may provide evidence that, in some cases, even riparian forest of 30 meters width or more are under strong influence of the upslope C4cultivated areas. As a consequence, 30 meters
riparian forest buffers or narrower widths (as currently allowed in 2012 Forest Act) do not appear to be appropriate to conserve soil and water. Indeed, a similar finding has been
found in a nearby area where even 30 meters riparian buffers did not suffice to retain soil particles originated from sugarcane fields (Pires et al. 2009).
If the five cases presented here represent the variety of conditions by which riparian areas are subject in southeast Sa˜o Paulo and other highly intensive agricultural landscapes elsewhere, it appears that, in most cases, riparian forest buffers of 30 meters or narrower might not be enough with regards to water resources protection. Thus, based on the 2012 Brazilian Forest Act, we expect that riparian areas with riparian forest buffers 5 to 15 meters wide will, in most cases, not be effective buffers to protect soil and water quality, the main original purpose of the Forest Act. Consequently, we expect the increases in suspended and bed load and their associated materials enhancing stream siltation, which in turn, alter light regime and stream environment with detrimental effects on stream water quality and biota.
Conclusion
We have shown that soil stable carbon isotopic composition can be a useful tool to investigate compliance with the Forest Act in riparian areas that were or are currently under the influence of a C4 vegetation type. As pasture soils in Brazil
have approximately 200 million ha covered with exotic African C4 grasses, and an additional 24 million ha of corn and
sugarcane crops together (Martinelli et al. 2010), the isotopic approach could be used to study several of these areas. However, for future studies it is imperative that soil sampling has to include deeper soil layers to exclude the influence of C4
carbon generated upland (i.e. outside of the riparian area). Finally, narrower riparian forest buffers (o 30 meters)
currently allowed in the 2012 Forest Act will likely contribute to keep the detrimental effects of soil erosion with conse-quences connected to stream water quality in agricultural landscapes. In other words, the already high stream suspended load and siltation with consequences for stream morphology, which shapes stream biota and nutrient uptake, are highly expected to remain in such landscapes where 30 native riparian forest buffer is no longer required.
Acknowledgements
The authors would like to thank George Lambais, Daniela Luz, Ce´sar Piccirelli, Jean Carvalho and Juliana Gragnani for their precious help during the field campaigns and laboratory analysis. In addition, we wish to thank all of the technical staff of Isotope Ecology Lab CENA/USP. Jim Hesson of Academic EnglishSolutions.com revised the English. Finally, we thank the Coordenac¸a˜o de Aperfeic¸oamento de Pessoal de Nı´vel Superior
(CAPES) and Sa˜o Paulo Research Foundation (FAPESP; grant #2014/10192-7) for the scholarship granted to M. Magioli.
References
ABERNETHY, B. & RUTHERFURD, I.D. 2000. The effect of riparian tree roots on the mass-stability of riverbanks. Earth Surf Process Landforms 25:921–937. http://dx.doi.org/10.1002/1096-9837(200008)25:9o921::AID-ESP9343.0.CO;2-7
crop in Brazil. Sustainability 4:574–585. http://dx.doi.org/10.3390/ su4040574
ALCAˆ NTARA, F.A., BUURMAN, P., FURTINI NETO, A.E,
CURI, N. & ROSCOE, R. 2004. Conversion of grassy cerrado into riparian forest and its impact on soil organic matter dynamics in an Oxisol from southeast Brazil. Geoderma 123:305–317. http://dx.doi.org/10.1016/j.geoderma.2004.02.014
ASSAD, E.D., PINTO, H.S., MARTINS, S.C., GROPPO, J.D., SALGADO, P., VASCONCELOS, E., SANO, E., PAVA˜ O, E., LUNA R., CAMARGO, P.B. & MARTINELLI, L.A. 2013. Changes in soil carbon stocks in Brazil due to land use: paired site comparison and a regional pasture soil survey. Biogeo-sciences 10:5499–5533.http://dx.doi.org/10.5194/bgd-10-5499-2013 BRANCALION, P.H.S., INSERNHAGEN, I., GANDOLFI, S. & RODRIGUES, R. Plantio de a´rvores nativas fundamentada na sucessa˜o florestal. 2009. In: Pacto pela restaurac¸a˜o da Mata Atlaˆntica: referencial dos conceitos e ac¸o˜es de restaurac¸a˜o flor-estal. LERF/ESALQ, Instituto BioAtlaˆntica, Sa˜o Paulo. p.14–23. CAVALCANTI, G. & LOCKABY, B.G. 2005. Effects of sediment
deposition on fine root dynamics in riparian forests. Soil Sci Soc Am J, 69(3):729–737.http://dx.doi.org/10.2136/sssaj2004.0239 CAVALCANTI, G. & LOCKABY, B.G. 2006. Effects of sediment
deposition on aboveground net primary productivity, vegetation composition and structure in riparian forests. Wetlands, 26(2): 400–409.http://dx.doi.org/10.1672/0277-5212(2006)26[400:EOSDOA] 2.0.CO;2
COOK, L.R., STAPE, J.L. & BINKLEY, D. 2014. Soil carbon dynamics following reforestation of tropical pastures. Soil Sci Soc Am J, 78:290–296.http://dx.doi.org/10.2136/sssaj2012.0439 COOPER, J.R., GILLIAM, J.W., DANIELS, R.B. & ROBARGE,
W.P. 1987. Riparian areas as areas of agricultural sediment. Soil Sci Soc Am J, 51(2):416–420.http://dx.doi.org/10.2136/sssaj1987. 03615995005100020029x
DE PAULA, F.R, FERRAZ, S.F.B, GERHARD, P, VETTORAZZI, C.A. & FERREIRA, A. 2011. Large woody debris input and its influence on channel structure in agricultural lands of southeast Brazil. Environ Manage, 48(4):750–763.http://dx.doi.org/10.1007/ s00267-011-9730-4
FARQUHAR, G.D., EHLERINGER, J.R. & HUBI, C.K. 1989. Carbon discrimination and photosynthesis. Annu Rev Plant Phy-siol Plant Mol Biol 40:503–537.http://dx.doi.org/10.1146/annurev. pp.40.060189.002443
GRISCOM, H.P., GRISCOM, W.G. & ASHTON, M.S. 2009. Forest regeneration from pasture in the dry tropics of Panama: effects of cattle, exotic grass, and forested riparia. Restor Ecol 17(1): 117–126.http://dx.doi.org/10.1111/j.1526-100X.2007.00342.x GUARANTINI, M.T.G., GOMES, E.P.C., TAMASHIRO, J.Y. &
RODRIGUES, R.R. 2008. Composic¸a˜o florı´stica da reserva Muni-cipal de Santa Genebra, Campinas, SP. Rev Bras Bot 31(2):323–337. http://dx.doi.org/10.1590/S0100-84042008000200015
HAWES, E. & SMITH, M. 2005. Riparian buffer zones: functions and recommended widths. Eightmile River Wild and Scenic Study Committee. 15p.
IMHOLT, C., SOULSBY, C., MALCOM, I.A. & GIBBINS, C.N. 2013. Influence of contrasting riparian cover on stream tempera-ture dynamics in salmonid spawning and nursery streams. Ecohy-drology 6(3):380–392.http://dx.doi.org/10.1002/eco.1291
LOWRANCE, R., LEONARD, R. & SHERIDAN, J.M. 1985. Managing riparian ecosystems to control nonpoint pollution. J Soil Water Conserv 40(1):87–91.
LOWRANCE, R., SHARPE, J.K. & SHERIDAN, J.M. 1986. Long-term sediment deposition in the riparian zone of a coastal plain watershed. J Soil Water Conserv 41(4):266–271.
LUIZA˜ O, R.C.C., LUIZA˜O, F.J., PAIVA, R.Q., MONTEIRO, T.F., SOUSA, L.S. & KRUIJTS, B. 2004. Variation of carbon and nitrogen cycling processes along a topographic gradient in a central Amazonian forest. Glob Change Biol, 10:592–600. http://dx.doi.org/10.1111/j.1529-8817.2003.00757.x
MAMOLI, R.S., COOPER, M., TOMAZELO, M. & LOBA˜ O, M.S. 2012. Aplicac¸a˜o da dendrogeomorfologia no estudo da deposic¸a˜o de sediments do solo no tronco de a´rvores de Guarea guidonea em mata ciliar no Estado de Goia´s, Brasil. Sci For 40:7–14.
MARIN-SPIOTTA, E., SILVER, W.L. SWANSTON, C.W.,
OSTERTAG, R. 2009. Soil organic matter dynamics during 80 years of reforestation of tropical pastures. Glob Change Biol, 15:1584–1597.http://dx.doi.org/10.1111/j.1365-2486.2008.01805.x MARTINELLI, L.A., JOLY, C.A., NOBRE, C.A. & SPAROVEK, G.
2010. The false dichotomy between preservation of the natural vegetation and food production in Brazil. Biota Neotrop. 10(4):323–330. (in Portuguese), http://dx.doi.org/10.1590/S1676-06032010000400036
MARTINELLI, L.A., PESSENDA, L.C.R., ESPINOZA, E.,
CAMARGO, P.B., TELLES, E.C., CERRI, C.C., VICTORIA, R.L., ARAVENA, R, RICHEY, J.E. & TRUMBORE S. 1996. Carbon-13 variation with depth in soils of Brazil and climate change during Quaternary. Oecologia 106:376–381.http://dx.doi.org/10.1007/ BF00334565
PIRES, L.F., BACCHI, O.O.S., CORRECHEL, V., REICHARDT, K. & FILIPPE, J. 2009. Riparian forest potential to retain sedi-ment and carbon evaluated by the137Cs fallout and carbon isotopic
ratio approach. An Acad Bras Cienc 81(2):271–279.http://dx.doi. org/10.1590/S0001-37652009000200013
POWERS, J.S. & SCHLESINGER, W.H. 2002. Geographic and ver-tical patterns of stable carbon isotopes in tropical rain forest soils of Costa Rica. Geoderma 109:141–160.http://dx.doi.org/10.1016/ S0016-7061(02)00148-9
ROSCOE, R., BUURMAN, P., VELTHORST, E.J. & VASCON-CELLOS, C.A. 2001. Soil organic matter dynamics in density and particle size fractions as revealed by the13C/12C isotopic ratio in a Cerrados oxisol. Geoderma 104:185–202. http://dx.doi.org/ 10.1016/S0016-7061(01)00080-5
RUDORFF, B.F.T., AGUIAR, D.A., SILVA, W.F., SUGAWARA, L.M., ADAMI, M. & MOREIRA, M.A. 2010. Studies on the rapid expansion of sugarcane for ethanol production in Sa˜o Paulo State (Brazil) using Landsat data. Remote Sensing 2:1057–1076. http://dx.doi.org/10.3390/rs2041057
SCHOONOVER, J.E., WILLIARD, K.W.J., ZACZEK, J.J.,
MANGUN, J.C. & CARVER, A.D. 2006. Agricultural sediment reduction by giant cane and forest riparian buffers. Water Air Soil Poll 169:303–315.http://dx.doi.org/10.1007/s11270-006-3111-2
SPAROVEK, G., BERNDES, G., KLUG, I.L. & BARRETO, A.G. 2010. Brazilian agriculture and environmental legislation: status and future challenges. Environ Sci Technol 44(16):6046–6053. http://dx.doi.org/10.1021/es1007824
TELLES, E.C.C., CAMARGO, P.B., MARTINELLI, L.A.,
TRUMBORE, S.E., COSTA, E.S., SANTOS, J., HIGUCHI, N. & OLIVEIRA Jr, R.C. 2003. Influence of soil texture on carbon dynamics and storage potential in tropical forest soils of Amazonia. Global Biogeochem Cy 17(2):1030–1040. http://dx.doi.org/10.1029/ 2002GB001953
VERSTRAETEN, G., POESEN, J., GILLIJNS, K. & GOVERS, G. 2006. The use of riparian vegetated filter strips to reduce river sediment loads: an overestimated control measure? Hydrol Process 20:4259–4267.http://dx.doi.org/10.1002/hyp.6155
VITORELLO, V.A., CERRI, C.C., ANDREUX, F., FELLER, C., VICTORIA, R.L. 1989. Organic matter and natural C-13 distribution in forested and cultivated oxisols. Soil Sci Soc Am J 53:773–778. http://dx.doi.org/10.2136/sssaj1989.0361599500 5300030024x
WENGER, S. 1999. A review of the scientific literature on riparian buffer width, extent and vegetation. Athens: University of Georgia. 59p. YOO, K., AMUNDSON, R., HEIMASATH, A.M. & DIETRICH,
YUAN, Y; BINGNER, R.L. & LOCKE, M.A. 2009. A review of effectiveness of vegetative buffers on sediment trapping in agricultural areas. Ecohydrol 2:321–336. http://dx.doi.org/10.1002/ eco.82
ZHANG, K.; DANG, H.; ZHANG, Q. & CHENG, X. 2015. Soil carbon dynamics following land-use varied with temperature and precipitation gradients: evidence from stable isotopes. GCB 21:2762–2772.http://dx.doi.org/10.1111/gcb.12886