A Work Project, presented as part of the requirements for the Award of a Master’s Degree in Management from the NOVA – School of Business and Economics.
REDEFINING THE ORGANIZATION OF THE PUBLIC WATER SUPPLY SECTOR
JOSÉ TELLES DE CARVALHO LOPES DE ALMEIDA, #2394
A Project carried out on the CEMS MIM Business Project course, under the supervision of: Professor Constança Casquinho
Abstract
Redefining the Organization of the Public Water Supply Sector
This paper reflects the Portuguese Water Supply Sector through the eyes of the National Water and Waste Services Regulation Authority. A group of students was challenged to think of ways on how to overcome the difficulty that the regulator has in interpreting the big amount of data it collects from all of the operators in the market. The students developed a pair of synchronized models that allows the regulator to compare cost structures and performance indicators to relevant proxies. The paper finishes with a reflection on public goods management and possible developments for the industry, regarding Management Models and Cost-drivers.
Key words: “cost-driver”;”water supply”; “regulation”; “public goods”
Table of Contents
Abstract ... 2 Context ... 4 Client ... 4 Market Overview ... 4 Current Situation ... 5The Business Project Challenge ... 6
Problem Definition ... 7 Methodology ... 8 Hypothesis ... 8 Analysis ... 9 Final Methodology ... 12 Recommendations ... 13 Concerns ... 14 Individual Contribution ... 15 Academic Discussion ... 18 Personal Reflection ... 23 Appendix ... 25 Bibliography ... 29
Context
In this chapter I will give a brief description of the Business Project’s context divided in four topics: the client with whom the team worked alongside during the Business Project; a market overview to explain the client’s purpose of activity; the current situation of the client; and the challenge that the group decided to tackle.
Client
The client with whom the group worked throughout the Business Project was the Entidade Reguladora dos Serviços de Águas e Resíduos (ERSAR). This is the National Water and Waste Services Regulation Authority. Apart from providing information about the sectors, ERSAR also aims to fulfil its mission of protecting the consumers by avoiding competition abuses as well as ensuring a necessary quality of the service provided. ERSAR also hopes to guarantee equal and clear conditions in the access to the water and waste services and the operation of these services.
Market Overview
The area of activity of ERSAR can be subdivided in three sectors: Water Distribution (AA); Wastewater Collection (AR); and Solid Waste Management (RU). These sectors are all considered to be of public interest, basic to the well-being of the population.
In this project we only attended to the flow of processes regarding water and wastewater management, thereby putting Solid Waste out of the scope.
The process begins in the Water Distribution sector (Figure 1) with seven different stages, in the following order:
2. Treatment – consists of making this fresh water harmless to the human body either by freeing from such components or adjusting them to consumable values.
3. Elevation – aims to pump the treated water to higher quotas where it can be properly stored
4. Adduction – this stage is simply the point where great volumes of water go from the pumps into storage facilities or directly into the distribution grid.
5. Storage – consists of storing large amounts of water in proper tanks that are controlled and can supply the population in cases of emergency.
6. Distribution – the stage where the water is distributed throughout the population in a complex grid that aims to reach everyone’s household.
7. Consumption – this is the final stage of the water distribution, when the consumer actually has access to the treated water in the grid.
The process for the wastewater is greatly similar but in the opposite direction (figure 2), finishing with the rejection of the wastewater into proper canals.
Current Situation
As we all know, any kind of monopoly greatly affect the competition in whatever sector. The case of the water and waste sectors is not an exception. In the case where these monopolies exist for a greater public well-being reason, the regulator poses a vital role in protecting the interests of the final consumer. ERSAR does this by promoting quality among the suppliers, and equality through tariff-setting. The tariffs charged by ERSAR aim to ensure economic sustainability for the suppliers while taking in consideration the available income for the population. In addition to this, ERSAR promotes its strategy with medium and long term perspectives. Having said this, the company encourages other economic activities within the sector, thereby reinforcing the entrepreneurial activity as well as environmental sustainability
Through the promotion of higher efficiency and effectiveness in the sector, regulation can benefit both the users and the operators of these services, and even Portugal as a whole.
The Business Project Challenge
ERSAR has been collecting a lot of valuable data from all the 400 operators in the sector. The problem is the lack of time and effort that ERSAR has available to treat that same data into usable information for proper strategic analysis. On top of that, this same data may become unreliable because operators may have incentives to underestimate costs in order to appear to be more financial sustainable than reality and sustain lower tariffs. This becomes unsustainable when these operators have to be subsidized from the municipality where they operate, in order to keep its cost structure. The team, together with ERSAR’s specialists and executives, crossed ERSAR’s needs with the pool of data available and proposed to create a financial model that helps ERSAR to close the gap between the current and the optimal tariffs in order to meet the company’s long-term oriented strategy. This financial model clusters the operators in scale, activity and operations. Furthermore, it identifies one efficient and reliable entity per cluster. Then, it extracts the cost information from the company’s database and allows for ERSAR to compare each entity with a relevant best practice within its cluster.
Problem Definition
As mentioned in the previous paragraph, ERSAR recommends on the tariffs and oversees them, but operators have a final word. Moreover, these operators may have incentives to promote lower tariffs for political interests: to promote the electorate. By doing so, the financial statements of these entities may become biased and the tariff calculated by ERSAR loses its effect. However, ERSAR has to guarantee that the operators are sound in financial terms, and has to respond to government pressure arisen after the recent economic crisis. One way to do this is to revise the tariff-setting process. This is where our team came in - to identify benchmark/standard values for costs, so as to compare these across different operators, for ERSAR to assess whether there is evidence of under or over estimations. Finally, not only was it important to assess efficiency across operators, but also performance, through ERSAR’s internal indicators and international benchmark.
In order to come up with a solution for these matters, we firstly got to know the industry and went through the hypothesis setting stage. Afterwards, we performed a deep analysis on ERSAR and specific companies from the industry. Only then we had enough information to build a sustainable and relevant model that is applicable to the problems ERSAR is facing.
Methodology
In this chapter I will perform a deeper analysis on each step the group took all throughout the project. This description will be subdivided into the hypothesis definition, the analysis overtaken and the final deliverables to the client.
Hypothesis
In order to define a proper hypothesis, the team started developing a diagnostic on ERSAR and SIMAS Oeiras e Amadora, an entity pointed out by ERSAR specifically as a Best Practice in the non-verticalized urban cluster. Within ERSAR we hoped to be introduced to the sector and get our objectives in line with the administration board of the company. In SIMAS we hoped to collect further data on an industry example, and also get a first-hand impression on possible major obstacles on our first arguments against or in favour of our hypothesis. At this point we believed that each operator in the retail of the water distribution sector differs from one another regarding: scale; geographical location; investments overtaken; degree of technologic development; efficiency; and procedures and bureaucracy. Therefore, these divergences would cause different cost structures and if we are able to identify cost items specifically related to these activities we will have identified the cost drivers for our model.
Nevertheless, given that the operators are not comparable among each other if these characteristics are too different we came up with a clustering criteria according to: size; management model; verticalization (bulk+retail or only retail); horizontal integration (AA+AR, only AA, only AR).
In order to do this we needed to further develop our analysis both into ERSAR’s database and SIMAS Oeiras e Amadora.
Analysis
The analysis stage consisted of: defining the clusters; identifying best practices; and creating the model.
When defining the clusters, we started by identifying the relevant criteria from the previously listed in the hypothesis. The aim of the criteria was to generate similarities within clusters but differences across them. In order to do this, we went through the Annual Report of ERSAR for 2014, where we gathered quantitative knowledge about the company and the sector nationwide. Moreover, with the field-trips to SIMAS Oeiras e Amadora, the team spent 6 full days in in-depth interviews with the departments of: human resources; communication and customer service; information technology; telemanagement and equipment; losses and mapping; infrastructure management; accounting; and legal and auditing. As already mentioned, these interviews allowed the team to exclude or develop sustained arguments regarding the hypothesis.
At first we believed that we could cluster the operators by number of clients but after the visit to the Telemanagement department they explained to us that most of the costs that they deal with are due to the pumps and the maintenance staff sent to fix ruptures in the pipelines. This lead us to believe that maybe we should also take in consideration the length of the pipeline when clustering but the fact is that ERSAR does not have information on every company regarding that. Furthermore, when we headed down to the Losses and Mapping department, we realized that the area covered is not a good criterion because different companies cover the same are but with considerably different densities. Such is the case of SIMAS Oeiras e Amadora that has one of the highest population densities in the country (PORDATA, 2011). To counter this case, the experts at SIMAS Oeiras e Amadora suggested we use the number of connections to the grid per kilometre of pipeline. This way we could assess the density as well as the area
covered. The problem with this variable is the same as before – ERSAR does not possess that data on enough companies in order to make this relevant.
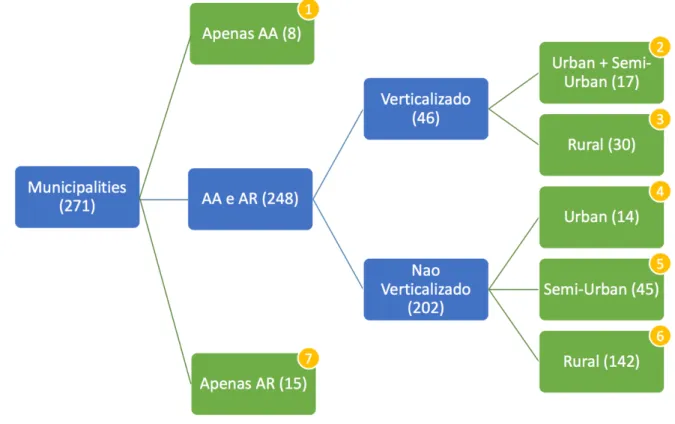
Before taking these conclusions to ERSAR’s specialists we looked at the the technical guide offered by ERSAR where we can get an explanation of each variable within ERSAR’s database. Here we found a variable called “Tipologia da área de intervenção” that exists for every operator and classifies the area where each company operates either as Urban, Semi-Urban or Rural; according to the total population and density of the area. Further information on how this ranking is calculated can be found in Figure 3 in the appendix. This looked as the perfect criterion to cluster the operators but it was not enough. We still needed to apply verticalization as well as horizontal differentiation. After meeting with ERSAR’s specialists to explained the situation, they were very content with our suggestion on the abovementioned variable and also provided us the information on which operators are verticalized and which are horizontally differentiated. Now that we had every piece of information, we started clustering the operators in area of activity: Only AA (cluster 1), Only AR (cluster 7), AA+AR. Given the small number of companies within clusters 1 (8 observations) and 7 (15 observations), no further clustering was performed. Nevertheless, still too many operators perform both AA and AR activities, the second step was to separate the ones that are verticalized from the ones that are not. Furthermore, within the 46 companies that perform both activities and are verticalized we separated them regarding the variable “Tipologia da área de intervenção” and then performed statistical tests (t-tests), taking Total Costs (regarding AA and AR activities only) as the analysis variable. With these tests we came to realize that there is no significant difference between companies that are classified as Urban from companies classified as Semi-Urban, within the veticalized cluster. Nevertheless, there is significant difference among companies either Urban or Semi-Urban and Rural. Hence, we decided to group Urban and Semi-Urban Verticalized operators and formed Cluster 2 (17 observations). As an outcome of this same analysis, Cluster
3 was created – Verticalized Rural operators (30 observations). Furthermore, we then performed the same statistical analysis in the 202 non-verticalized companies operating in both AA and AR. Since there was significant statistical difference in all combinations between Urban, Semi-Urban and Rural classifications of the operators, we created three clusters – Clusters 4, 5 and 6; with 14, 45 and 142 observations, respectively. A full schematization of the clustering can be observed in Figure 4 in the appendix.
After having defined the clusters we moved on to building the Ranking Criteria. In order to identify the best practice within each cluster we needed to find a variable that explains both Quality of the service provided and Reliability of data. To do so we firstly needed to highlight the criteria under which we wanted to build a ranking of all the entities. Again by looking at the technical guide provided by ERSAR, in which we have an explanation of all the variables in the database, we identified two variables that are given by ERSAR’s experts and explains exactly the criteria we initially assumed. These variables are “Avaliação Regulador” and “Fiabilidade Regulador” (ERSAR, 2016). These variables are used to rank each indicator on each company. In order to build the ranking variable, we took in consideration both these variables but we needed one single ranking score per company. With this in mind we performed a simple average of the rankings given to each indicator, per company. This way, we ended up with one score for the overall Quality of service provided, per company. As well as an overall score of Reliability of data, per company. With these two values we then calculated the final ranking score which consisted of a weighted average of the two scores. Further explanation on the ranking variable can be found in the chapter on my Individual Contribution for this project. As a final step to this project we needed to compile the databases from ERSAR into one single document. This was a problem because ERSAR did not have a way to extract the annual costs of each company into one single file. In order to solve this obstacle, we used an Excel Add-In
was hard and very time-consuming because we had to select the right file for each company, check if the structure is exactly the same, and only then put it in the right folder where we would then select every file and leave the computer merging the files overnight.
Finally, all the data we needed to build both the cost and the performance analysis models was gathered.
Final Methodology
In parallel to all of this work, the team had developed the excel model that through an extensive network of look-up references and conditional formatting to optimize user experience, was ready to be applied to the compiled database, clustering and ranking tools.
The final overview of the model can be seen in Figure 5 in the appendix.
In the model, the user only needs to select the company that he/she wants to check on the performance of its cost structure compared to the best practice of the cluster. Everything else is automatic. Moreover, the model was built so that ERSAR can make whatever changes the company finds necessary, namely: the cluster of a certain operator; the range that makes the conditional formatting; the best practice of each cluster; and the relevance of the cost items highlighted on the left.
Furthermore, the team developed an extra tool that allows for the comparison of a selectable cost item, between any 6 operators, with charts facilitating interpretation. Several examples of this tool’s output can be observed in Figures 6, 7 and 8 of the appendix.
Moreover, regarding the performance analysis model, a very similar logic was used. Instead of using the database in its essence as a reference table, we actually developed 12 indicators, based on an international benchmark (Co-operation, 2015), and ranked the performance based on a colour scale that can easily be changed by ERSAR at any time. This analysis differentiates AA from AR activities using the appropriate indicators from ERSAR’s database. The fields on which the model assesses any operator’s performance are: service coverage; water quality;
reliability; service quality; social sustainability; environmental sustainability; economic sustainability; and finance & efficiency. The model not only compares any company with the best practice of its cluster but also with the international benchmark taken from the abovementioned study by the European Benchmarking Co-operation. The indicators used on each field of the model can be seen in the example of the output that can be found in Figure 9 in the appendix.
In conclusion, the model developed by the team is of possible and relevant use for ERSAR. Moreover, I hope we have tackled this business challenge the best way possible. Nevertheless, some limitations were discovered and the team also came up with a set of recommendations for ERSAR regarding the future to come. These shall be discussed in the next chapter.
Recommendations
After concluding the model, the team thought of possible applications that, in both short and long term, ERSAR can suggest to the operators it oversees. These recommendations come in a chronological order and, in our opinion, would start by using the model in every operator in order to identify the ones with presumed misallocated costs. In the meantime, together with the best performers, understand what are the drivers for success that can be applied to operators of the same cluster or even across clusters due to other reasons. Only after this, ERSAR should, case by case, adjust the tariffs taking into consideration the coverage of total costs over the costs of the best practice of the cluster. Finally, with time, ERSAR will be able to promote certain strategies that minimize cost misallocation according to the cluster where the company operates.
It is in our belief that these recommendations are reasonable and within the scope of action of ERSAR.
Concerns
As the team performed the analysis and developed the model, certain limitations of the project were highlighted. Regarding both models, one of the most obvious fault that the team could not overcome was the missing data – the fact that ERSAR does not possess every bit of information regarding every company or even the same amount of information for every operator. Also, in case the companies are misguided regarding the veracity of the data, the models become useless.
Going deeper in the cost analysis model, the set of data in the database of today is from 2014, which in fact may not reflect the current situation therefore making the model obsolete. Furthermore, the team encountered some contradictions in ERSAR’s database regarding the clustering of verticalized and non-verticalized companies. Moreover, there may be some cost drivers that are specific of the geographic region or just locally stimulated that are not accounted for in the model.
Regarding the performance analysis model specifically, there is some diversification of unit measurement hence making it difficult to compare the data of the national operators with the international ones. Finally, the international benchmark values that are used are the same regardless of the cluster evaluated, meaning that the scale is only appropriate to a specific type of companies.
In conclusion, these limitations on the model give ERSAR a lot of room for improvement. It is in my belief that we should “live our lives with one foot raised” – always ready to respond to emerging opportunities.
In the next chapter I shall explain what was my individual contribution for the Business Project as a whole.
Individual Contribution
All throughout the Business Project, our group functioned very well as four members working together leveraging synergies from our teamwork abilities. Meaning that, in most of the topics of our project we actually worked as a team when it came to critically think about identifying our obstacles and tackling them the best way possible. There were no major topics where one of us strayed alone without the help of others. Therefore, this chapter does not come as easily as the overall description of each step of the project. However, regarding the overall group dynamics, I had many moments when I was responsible of scheduling meetings with the members of the group as well as follow-up meetings with our Academic Advisor. Moreover, the Portuguese speaking members of the group were in close contact with the client when it came to manage their expectations towards our project.
Furthermore, during the already mentioned visits to SIMAS Oeiras e Amadora, I was part of the group that was in charge of gathering information on the different departments in order to better understand the industry and build the potential hypothesis that would sustain our proposed solution for the Business Challenge. During this period, we had some diverging points of view between the group’s and the client’s perspective of what the business challenge really was. When the project started the challenge was made clear and the objective was to perform a cost analysis in order to understand what drives costs in the industry and how can we identify the cost items with greater impact on each company. But quickly another objective came in the way and overtook the attention of the group – aggregation of operators. This topic became specially interesting during our meetings with ERSAR where there was a strong impression, from the company’s experts, that there are economies of scale in the industry. This lead us to focus our attention on identifying arguments that would sustain this hypothesis. However, this pursuit mislead us from our initial focus hence creating the previously mentioned divergence.
Business advisors for the project in order to get the objectives in line with one another and get back in track with the project’s focus.
Still regarding group dynamics, it is in my belief that I had a strong influence in the construction of the slideshow presentation. Here I took the role of making our slides visually perceptible as well as content wise. This is because I believe that the human brain understands the idea that one tries to explain, much better through visual content than readable or spoken text. But again, this project was a product of cooperation among team members and I can not say that my work was more important than my colleagues’.
From all the topics discussed in the methodology of the project, the one I believe my opinion had most impact was when creating the Ranking Variable. After having defined the clusters we moved on to identifying the best benchmarks to which the model will compare the cost structure of each company within each cluster. In order to do so we firstly needed to highlight the criteria under which we wanted to build a ranking of all the entities. In order to build a model that can be updated every year, we decided to only use variables that are already existent in ERSAR’s database. This way we do not generate extra work for the company to keep using the model. Having said that, we took another look at ERSAR’s database and its variables and realized that ensuring quality was not enough to guarantee a certain company as a Best Practice of a certain cluster. Because of the reliability issues of the data, the same company could gather good quality but unreliable data, thereby getting a high score in such ranking and misrepresenting the cluster. For this reason, we decided to include another variable that represents reliability. When ERSAR developed the variables for its database, they generated two variables that rank each indicator in each company, regarding Quality and Reliability of data, according to ERSAR’s specialists. These variables are “Avaliação Regulador” and “Fiabilidade Regulador”, respectively. The first variable consists of a ranking that goes from 1 to 6: where 1 means bad performance of that service; 2 means medium performance of the service; 3 means good
performance of the service; 4 means that there is some problem with the data hence it should be looked into before interpretation; 5 means that the indicator is not applicable to the company; and 6 means the company did not provide the proper information for ERSAR to be able to rank that indicator. Having taken this into consideration, the team looked into the cases where the score ranged from 4 to 6 and either the case was irrelevant for the cost analysis or it was not applicable hence would not interfere with the ranking. This said, we decided to eliminate every indicator in this range when generating the ranking variable that classifies each company in terms of quality. Moreover, regarding the second variable, it consists on an evaluation on the reliability of the data provided on each indicator on each company. This evaluation is done through a ranking that goes from one star to three stars, where one star represents indicators with low reliability and three stars high reliability. For this variable we had to perform a translation of the stars into an actual ranking from 1 to 3 equivalent to the one presented in the previous variable. This way both variables are in the same scale.
Finally, we calculated a simple average of each variable per company, and then performed a weighted average of these two values in order to conclude with only one score per company that assesses both quality of service provided and reliability. The fact that the final score is calculated through a weighted average is so that ERSAR can change the significance of each variable in the future if it so wishes.
Academic Discussion
During my time as a NOVA masters in management student, I have taken courses on a very broad selection of topics. Ranging from marketing, operations, finance, innovation, human resources and also economics and social enterprise. The last two topics mentioned were possibly the ones I most recalled while doing my business project. First of all, since most operators in the Portuguese water sector are publicly managed, their main purpose is not to increase profits but to provide the best service possible while charging the lowest price possible to the consumer. Hence, I had to genuinely make an effort to change the profit oriented mind-set I was used to apply to most business cases and assignments throughout my Masters, into a logic of optimizing processes in order to charge less and less to the consumer. This would indeed make sense if there was a very competitive landscape and the operator was trying to gain market share, but here we are talking about monopolies. My academic discussion shall research on what drives decision-making in companies that provide public goods/services versus; and finding out what kind of guidelines should ERSAR provide to the operators on the Portuguese water sector.
The business challenge I was faced with represents a small part of a bigger and worldwide challenge which is related to the field of Sustainable Management of Natural Resources. The past 50 years of technological advancement have enhanced the scarcity of natural resource commodities. Nevertheless, as Jeffrey Krautkraemer entails in his study on the Economics of Natual Resource Scarcity, it is unlikely that technology alone can remedy that (Krautkraemer, 2015).
Therefore, it is in my belief that this is an area where ERSAR may play a vital role in guiding and overseeing the management of water facilities all throughout the country.
But the way to do so is not only to treat water as a scarce resource for environmental purposes but also for social reasons. This is, to respect the principles of universal access to drinkable water as well as proper sewage drainage; and to provide a high quality service at affordable prices. Because the water sector in Portugal is part of the Public domain and this has a distinct driver for success than the private sector. In Herbert Simon’s discussion on fact and value, Simon explains that, even though public and private sectors share similarities in the way they are managed, the public sector is driven by the population’s interest and political compromise (Simon, 2015), whereas the private sector values profit. In Economics, the optimization of the population’s interest is reflected through a maximization of the marginal benefit – the additional satisfaction or utility that a person receives from consuming an additional unit of a good or service. In practical terms, this is the maximum amount a person is willing to pay for that additional unit of a good or service. However, because ERSAR exists, the private sector in this industry is regulated. Meaning that, ERSAR may impose rules to operators in order to prevent consumers from being exploited from lack of competition in the market.
According to the Allocative Efficiency Theory, the equilibrium happens when Marginal Benefit equals Marginal Cost. Also stated in Paul Samuelson’s Theory of Public Goods in Economics as the Samuelson Condition for numéraire goods, as published by Wiley on behalf of the London School of Economics (Wiley, 1973). In other words, Tjvan Pettinger explains it as the optimal distribution of goods and services, when taking into account consumer’s preferences, and any increase would result in a decrease of social utility (Pettinger, 2012).
What I would like to stress in this discussion is the hypothesis that the optimal price for water distribution in Portugal is found when it meets the Allocative Efficiency Equilibrium. Nevertheless, the European Journal of Sustainable Development states that, even though the standards of evaluation for the concept of allocative efficiency are not always the same, the
"winners" and "losers" depending on the evaluated choice”. The principles of rational choice, individual maximization, utilitarianism and market theory further let us suppose that the consequences for winners and losers can be identified, compared and measured (EJSD, 2013). The matter in question is how to meet this equilibrium in markets with very little competition, such as a government monopoly (or public monopoly) where competition is prohibited by law. In the case of the Portuguese water distribution sector, consumers do not have a choice on what operator they want to work with even though there are many providers, both public and private, in the country, because they only operate in specific areas. And in each area, only one operates. Having said this, ERSAR’s challenge could be to identify the willingness to pay of each consumer under the area on which each water distribution provider operates.
Upon further research I found a paper published by the Oxford University Press, written by Leonid Hurwicz, which explains the Lindahl Tax Theory. This theory proposes a solution in which individuals pay for public goods according to their individual marginal benefits, through personalized prices (Hurwicz, 1979). The equilibrium for this theory is met when the unit-price meets the unit-cost of production. In other words, when the Samuelson Condition is met and the situation is allocatively efficient.
One possible criticism to this theory is that one should have to be aware of the individual indifference curves. Nevertheless, in my opinion, it is not realistic to assume that people would accept personalized prices to the very extent that the Lindahl Tax Theory supposes. Moreover, as Duncan Foley explains in his article published on The Econometric Society, concerning the Lindahl Tax Theory, individuals will not communicate their real preferences in case they know the outcome will harm them in any way (Foley, 1970).
However I came to realize that, by assuming that the consumer will always want to pay less for the same product, operators may choose to pursue one of two options: either optimize the cost structure and reduce the unit cost while providing the same service with the same quality; or
improve the quality/performance of the service thereby increasing the consumer’s willingness to pay. In other words, there are always two sides of the coin: on one hand are the consequences of cost cutting/optimization for the provider, against the benefits for the consumer; on the other hand is the increase in utility resultant from an investment in improving the quality/performance from the operator. In either case the decision should be undertaken as long as the consumer gains more than the company loses.
Therefore, my proposal for the application of this theory in the Portuguese water distribution sector is for ERSAR to suggest a tariff to each operator such that the final price meets the abovementioned equilibrium for consumers living in the affected area. In this case, what ERSAR would need to apply this theory is to confirm, with each operator, the proper unitary cost of supplying water. Through the optimization of the cost structure, one can expect the unit-cost to decrease, thereby adjusting the tariff and reducing the final price to the consumer. ERSAR’s mission is to guarantee that the consumer is not negatively affected by changes in price due to profit-driven reasons.
For industries such as this one, where companies are legally required to supply all of the output that is demanded at regulated rates, Laurits Christensen and William Greene specifically state in the Journal of Political Economy that: when level of output and factor prices are exogenously determined, it is preferable to estimate firm cost functions instead of production functions (Christensen & Greene, 1976).
In order to do this I researched papers on the cost drivers of delivering tap water and found a study on the influence of management models in Water Delivery, by Susan Feigenbaum and Ronald Teeples. In this study the authors explain that utility cost structures suffer from at least one of the following weaknesses: (1) improper measurement of firm ouput as a scalar value representing delivery income; (2) arbitrary imposed specifications of production technology;
problem with the first point can be related back to what I learned during the Business Project. This is that companies do not bill every drop of water that they operate. This is due to pipeline difficulties, leakages and water meter malfunctions. Hence, the total amount of water in the system will always be higher than the total water billed to every customer. However, Feigenbaum and Teeples, did not find any statistical evidence in their study to reject the hypothesis that public and private water utilities are equally efficient.
This conclusion goes in accordance with studies regarding the same tests ran in electric utilities. Atkinson and Halvorsen also find no significant difference between publicly owned firms in this industry and regulated privately owned electric utilities (Atkinson & Halvorsen, 1986). However, other empirical studies support an opposing view - publicly owned firms in this industry have lower costs than those that are privately owned1. In my opinion, it is the prospect of change that keeps productivity flowing. Meaning that, if one system remains the same for too long, people get accustomed to it and stop identifying errors or mistakes that become recurrent. Therefore, in the Portuguese water sector, the possibility that one management model may change from privately to publicly owned, and vice versa, due to lack of productivity, may stimulate people to “keep one foot raised”, ready to accept development.
In conclusion, this study tries to track down possible improvements for the Portuguese water sector in order to better guide the future of the companies who ERSAR oversees. However, there is no specific reason to believe that ERSAR should guide the market neither into a specific management model nor cost structure, for every operator in the Portuguese industry. Therefore, future research should focus on identifying specific traits of Portuguese publicly-owned utility companies in order to understand if the referred studies’ conclusions are relevant for the Portuguese situation.
Personal Reflection
This project worked for me as a very strong test to my professional capabilities. Meaning that, I felt like I was evaluating myself in order to understand whether I am ready to close the academic chapter of my life or not. The way this project was managed, by my group members, our academic advisor and the client, made me remember a lot that I had learned in my consulting professional experience last summer. This happened for the simple fact that the way it is structured is very similar to a real consulting project and the people involved were also formatted to work in that way. From my professional experience I applied many skills regarding meeting preparation and expectation management. However, it was from my extracurricular activities that I took most advantage from. During the project, I found myself managing my temper and measuring consequences regarding every stakeholder of the project, a lot of times. This came as a surprise to me. I was not expecting so much interaction with the client as well as the responsibility that comes with it. This was the real challenge to me. Nevertheless, the group dynamics were positively surprising to me and everyone managed that unexpected responsibility very well. This would not have been possible if not for the great team spirit created among each other. The group did not work as a typical college group assignment where together define the overall to-do list and then split tasks so that later they can put everything together. This group worked less individually and more collectively. In the future I hope I can take this team spirit and implement it in my professional life.
Regarding my positioning within the group, I felt that my peace of mind helped the group to overcome stressful situations. Moreover, the fact that I do not stress easily made the group turn to me in situations of distress. This meant that, in any situation, if I was stressed, everyone should be. I believe that being aware of such responsibility is the only way of succeeding in
some kind of calm or guidance, that person must take his/her next steps with careful words and actions. Therefore, I believe I assumed the role of the group’s Co-ordinator and Monitor Evaluator, as described in the Belbin Team Roles exercise (Belbin, 1969).
Because of this overlooking role, I felt like I was sometimes offloading my own share of work onto my colleagues. This made me feel like I was not producing as much as my team members and in order to clear things out, I asked them if they felt the same way. This happened to be very positive because they gave me feedback on how important they felt my actual work was to the project and that there were no hard feelings. Nevertheless, I felt that my data mining skills were not as beneficial to the group as they could have been. It is in my belief that my contribution to the group was not very specialized in one subject but rather transversal to every topic approached. Meaning that, I believe I can confidently explain every single step of our project until a certain level of detail. This happened mainly due to the preoccupation I had in assuring my team members were sure of what everybody was doing and the group was going forward together. In order to do so, I had to understand what everyone was doing and spread the good news around the members.
In conclusion, I believe the client was very happy with our work and that we delivered a great value added to them. This said, the great thing that I can say about this project is that I would do it all over again.
Appendix
Figure 1Water Distribution Process Flow
Figure 2
Wastewater Collection Process Flow
Figure 3
Tipologia da área de Intervenção, detailed:
Weighted average of the scores classifies as follows: [1,2] – Rural; ]2,4] – Semi-Urban; ]4,6] - Urban
Figure 4 Final Clusters
Figure 5
Figure 6
Example of a possible output of the extra tool that allows for comparison of a certain variable
among up to 6 operators:
Figure 7
Example of a possible output of the extra tool that allows for comparison of a certain variable among up to 6 operators:
Figure 8
Example of a possible output of the extra tool that allows for comparison of a certain variable among up to 6 operators:
Figure 9
Example of the output of the performance analysis model and list of indicators used per field of evaluation of the model:
Bibliography
Atkinson, S., & Halvorsen, R. (1986). The relative efficiency of public and private firms in a regulated environment. In S. E. Atkinson, & R. Halvorsen, The relative efficiency of public and private firms in a regulated environment: The case of U.S. electric utilities (pp. 281-294). USA: Journal of Public Economics.
Belbin, D. M. (1969). Belbin Team Roles. Retrieved from Belbin: http://www.belbin.com/about/belbin-team-roles/
Christensen, L., & Greene, W. (1976). Economies of Scale in U.S. Electric Power Generation. In L. R. Christensen, & W. H. Greene, Economies of Scale in U.S. Electric Power Generation (pp. 655-676). Chicago: The University of Chicago Press.
Co-operation, E. B. (2015). 2015 Water & Wastewater Benchmark. Holland: De Swart The Hague, The Netherlands.
EJSD. (2013). Economic Efficiency in Edgeworth Box. In E. J. Development, Economic Efficiency in Edgeworth Box Market the Case of Two Goods (pp. 355-360). -: European Journal of Sustainable Development.
ERSAR. (2016). Guia de avaliação da qualidade dos serviços de águas e resíduos prestados aos utilizadores. In ERSAR, Guia de avaliação da qualidade dos serviços de águas e resíduos prestados aos utilizadores (p. 12 e 26). Lisboa: ERSAR.
Fare, R., Grosskopf, S., & Logan, J. (1985). The relative performance of publicly-owned and privately-owned electric utilities. In R. Fare, S. Grosskopf, & J. Logan, The relative performance of publicly-owned and privately-owned electric utilities (pp. 89-106). -: Journal of Public Economics.
Feigenbaum, S., & Teeples, R. (1983). Public Versus Private Water Delivery. In S. Feigenbaum, & R. Teeples, Public Versus Private Water Delivery: A Hedonic Cost
Foley, D. (1970). Lindahl's Solution and the Core of an Economy with Public Goods. In D. K. Foley, Lindahl's Solution and the Core of an Economy with Public Goods (pp. 66-72). -: The Econometric Society.
Hurwicz, L. (1979). Outcome Functions Yielding Walrasian and Lindahl Allocations at Nash Equilibrium Points. In L. Hurwicz, Outcome Functions Yielding Walrasian and Lindahl Allocations at Nash Equilibrium Points (pp. 217-225). Oxford: Oxford University Press.
Krautkraemer, J. (2015). Economics of Natural Resource Scarcity: The State of the Debate. -: Resources for the Future.
Meyer, R. A. (1975). Publicly Owned versus Privately Owned Utilities: A Policy Choice . In R. A. Meyer, Publicly Owned versus Privately Owned Utilities: A Policy Choice (pp. 391-399). -: The MIT Press.
Pescatrice, D. R., & Trepani, J. M. (1980). The performance and objectives of public and private utilities operating in the United States. In D. R. Pescatrice, & J. M. Trepani, The performance and objectives of public and private utilities operating in the United States (pp. 259-276). -: Journal of Public Economics.
Pettinger, T. (2012, 12 8). Allocative Efficiency. Retrieved from Economics Help: http://www.economicshelp.org/blog/glossary/allocative-efficiency/
PORDATA. (2011). PORDATA - Dados de Portugal de acordo com os CENSOS Nacionais.
Retrieved from PORDATA - Dados de Portugal:
http://www.pordata.pt/Municipios/Densidade+populacional+segundo+os+Censos-591 Simon, H. (2015, 5 12). How is private sector management different from public sector
management? Retrieved from YoExpert:
http://management.yoexpert.com/management-general/how-is-private-sector-management-different-from-pu-36799.html
Wiley. (1973). The Economic Theory of Clubs. In Y.-K. Ng, The Economic Theory of Clubs: Pareto Optimality Conditions (pp. 291-298). The London School of Economics.