Proposed acquisition of Norwegian
Air Shuttle by Ryanair
Olha Pletenytska
Dissertation written under the supervision of
António Borges de Assunção
Dissertation submitted in partial fulfilment of
requirements for the International MSc in Finance, at
the Universidade Católica Portuguesa, December 2017.
Abstract
The European airline industry can be characterized by being a very competitive, in the consolidation phase, with many Asian and Middle East competitors entering into this market. Therefore, there exist several moves airline companies are expected to make in the next couple of years. It is expected some activity from full-service carriers as in a attempt to enter into low-cost business segment, or low-cost carriers to expand into long-haul flight segment due to pressures on costs and profitability, and others. In this context, the current dissertation focuses on the potential deal between Ryanair and Norwegian Air Shuttle. This deal puts forward the entrance of the largest low-cost carrier into the long-haul segment, and an opportunity to expand to other regions as US. Given the conditions of two airlines, the synergies of 1637 million euros were forecasted and thus, it is proposed to Ryanair to pay a premium of 23,36% over the current share price to Norwegian Air Shuttle shareholders. This translates into the price per share of NOK 300 and the total transaction value of NOK 10 727,9 million, all paid in cash.
Resumo
Atualmente, a indústria aérea europeia é muito competitiva e na sua fase de consolidação. Existem muitos novos concorrentes da Ásia e Médio Oriente a entrar neste mercado. Assim, os experts nesta área esperam alguma dinâmica nesta indústria a nível de fusões e aquisições. Espera-se que alguns participantes que atualmente operam em segmento de transporte aéreo de pessoas de curtas-distâncias e baixo-custo (LCC), tentem entrar para o segmento de voos de longas-distâncias e vice-versa. Neste âmbito surge esta dissertação de mestrado, que propõe à Ryanair a ser pioneira e comprar a companhia aérea -Norwegian Air Shuttle. A Ryanair é a maior empresa de transporte de baixo-custo e provedora de voos de curta distância na Europa, e apresenta muito potencial para entrar neste segmento de voos de longa distância. Além disso, esta aquisição poderá facilitar a Ryanair a expandir a sua atividade para outras regiões. As potenciais sinergias foram calculadas e correspondem aos 1637 milhões de euros. Desta forma, sugere-se que a Ryanair pague 300 coroas norueguesas por ação (em prêmio por ação de 23,36%), o que corresponde ao valor total da transação de 10 727,9 milhões de coroas, tudo a pagar em
Acknowledgements
Foremost, I want to express my sincere gratitude towards Professor António Borges de Assunção for his availability, patience and valuable insights taught in the M&A course and afterwards, at the dissertation seminars.
Moreover, I would like to thank my family and close friends, who made the part of this journey. Thank you all for the motivation and for all support I had during the last 2 years in my master program.
C
ONTENTSIntroduction ... 7
Literature Review ... 8
1.1. Mergers and Acquisition ... 8
1.1.1. Reasons to enter into M&A ... 8
1.1.2. Analysis and Trends... 9
1.1.3. Methods of Payment ... 10
1.1.4. Synergies ... 11
1.2. Valuation Approaches ... 12
1.2.1. Discounted Cash Flow ... 12
1.2.2. Adjusted Present Value ... 13
1.2.3. Relative Valuation ... 14
1.2.4. Conclusion ... 15
Analysis of European Airline Industry ... 16
2.1. Industry Overview ... 16
2.2. Overview of relevant airline company types ... 18
2.3. Consolidation of airline industry in Europe ... 19
2.4. Motives for M&A in airline industry ... 20
2.5. Deal rationale within the industry trends ... 21
Firm Analysis ... 22
3.1. Ryanair ... 22
3.1.1. Ownership Structure ... 22
3.1.2. Operating Revenues ... 23
3.1.3. Operating Expenses ... 24
3.1.4. Analysis of key financial items ... 26
3.2. Norwegian Air Shuttle ... 28
3.2.1. Ownership Structure... 28
3.2.2. Operating Revenues ... 29
3.2.3. Operating Expenses ... 31
3.2.4. Analysis of key financial items ... 32
3.2.5. Evolution of Norwegian Air Shuttle Price per Share ... 32
Valuation ... 34
4.1. Ryanair ... 35
4.1.1. Discounted Cash Flow Model ... 35
4.1.1.1. Total Operating Revenues ... 35
4.1.1.2. Total Operating Expenses ... 36
4.1.1.3. Cost of Capital ... 37
4.1.1.4. Capital Expenditures and Net Working Capital ... 38
4.1.1.5. Free Cash Flows to the Firm ... 38
4.1.2. Comparable Multiples Method ... 39
4.2. Norwegian Air Shuttle ... 41
4.2.1. Discounted Cash Flow Method ... 41
4.2.1.1. Total Operating Revenues ... 41
4.2.1.2. Total Operational Expenses ... 43
4.2.1.3. Cost of Capital ... 44
4.2.1.4. Capital Expenditures and Net Working Capital ... 45
4.2.1.5. Free Cash Flow to the Firm ... 46
4.2.2. Comparable Multiples Method ... 47
5.3. Merged firm including synergies ... 51
Transaction Process ... 52
6.1. Mean of Payment and Premium ... 52
6.2. Industry regulation issues and other risks related ... 53
Conclusion ... 54
Appendices ... 55
I
NTRODUCTIONThe present dissertation is an analysis and proposal of the potential deal that can occur in the airline industry between Ryanair and Norwegian Air Shuttle. Therefore, this dissertation comprises two main goals. The first one resides in contextualizing the deal, assessing the strategic rationale of it as well as to account the potential financial benefits that may arise. The second objective consists in valuing firms on a stand-alone basis, looking for potential synergies that may come up from the combination of the two businesses and finally, agree on transaction terms.
The European airline industry can be characterized by being very fragmented, with some large companies and many medium ones, with more firms entering the market and competing for market share. Recently, some Middle-East and Asian companies entered into this market intensifying, even more, the competition. For that reason, many airline companies are looking for partnerships in order to consolidate their positions or to explore new markets in other regions.
In the first section, we conduct a literature review about some valuation methods and some important topics related to the mergers and acquisitions (M&A) field, namely types of mergers, trends, methods of payment and others topics.
Section two concentrates on the European airline industry in order to contextualize the deal. Some opportunities and threats are identified and explored. In addition, it is presented the forms that companies use to take advantage of these opportunities, as well as the ways that use to overcome threats. Specifically, Brexit that it is expected to have a large impact on the airline industry. Thus, it is necessary to study its implications.
The following two sections present detailed firm analysis as well as a valuation of Norwegian Air Shuttle and Ryanair on the stand-alone basis. In here, it is used DCF method and forward Market Multiples. We also present the evolution of the market share price and compare it to the share price obtained through different methods.
L
ITERATURER
EVIEW 1.1. Mergers and AcquisitionSometimes firms operate in a very turbulent environment, and in order to continue improving its operating activities, they seek for alternatives. This can pass by joining the other market participants. For instance, can form strategic alliances or joint ventures, create contractual relationships or proceed to minority investments (Bruner, 2004). The alternative option consists in pursuing a merger or an acquisition (M&A), which resides in combining two companies to create one larger and more efficient later on. Thus, the turbulent environment is the main source of M&A activity even if its success or failure depends on the transaction terms agreed and mostly, on the way the deal is conducted and implemented (Bruner, 2004).
A turbulent environment we observe during the periods of high uncertainty due to higher competition, progress (advances) in technology and social trends, as well as industry consolidation (Ashkenas et al. 1997). The purchase of one company (target) by the other (buyer) is considered as the simplest “strategy for growth” because it gives access to new markets and simultaneously helps the buyer to get access to new skills and capabilities (Rappaport and Sirower, 1998).
1.1.1. Reasons to enter into M&A
Many articles about mergers and acquisitions state different reasons why this industry is so big and what actually motivates the companies to follow the paths of the merger or acquisition.
One of the biggest reasons is the caption of synergies. Synergies can be defined as the present value of future improvements in cash flows after the transaction (Eccles et al. 1999). They may result from higher efficiency and companies (when combined) can achieve cost savings, revenue improvements, process improvements, and tax shields (Eccles et al. 1999). Beyond this value creation, companies also look for market consolidation, diversification and growth opportunities. This is only possible if the market presents favorable market circumstances.
1.1.2. Analysis and Trends
The Institute for Mergers, Acquisitions and Alliances (IMAA) offers statistical data about mergers and acquisitions across different regions and industries, from 1985 until present days. Graphs 1 (M&A Europe) and Graph 2 (M&A worldwide) show that, during the period of analysis, M&A activity has been increasing worldwide both in a number of deals and in its value. It is possible to observe on the graphs below the relationship between the deals activity and the values of the transactions, from 1985 and 2016. Moreover we verify that the activity comes in waves.
0 200 400 600 800 1000 1200 1400 1600 1800 2000 0 2000 4000 6000 8000 10000 12000 14000 16000 18000 20000 19851987198919911993 19951997199920012003200520072009201120132015 V a lu e o f T ra n sa ct io n s (i n b il . E U R )
Number of Deals Value (in bil. EUR)
Graph 1: The mergers and acquisitions evolution (in number of deals and value of transactions per year) in Europe between 1985 and 2016 (Source: Institute for Mergers, Acquisitions and Alliances, imaa-institute.org).
500 1000 1500 2000 2500 3000 3500 4000 4500 5000 10000 15000 20000 25000 30000 35000 40000 45000 50000 55000 V a lu e o f T ra n sa ct io n s (i n b il . E U R )
By analyzing closely M&A activity during the past year 2016, we can verify it was the second best value (accounted for a total of $3,6tn) since the 2007-2008 crisis. Due to this and to huge political uncertainties surrounding the world FT (2017) expects that 2017 will be a very interesting year in terms of potential takeovers. Looks like this uncertainty period (related with political shocks – election of Donald Trump, Brexit, and the defeat of major Italian constitutional referendum) instead of putting away deals, it is instead attracting these. The low growth prospects that the companies are facing, push those to look for ways to improve growth, for instance by buying rivals and/or expanding into new geographies. Additionally, low-interest rates seem to persist.
The airline transportation segment is a part of the industry of Transportation & Infrastructure, which in terms of M&A has been quite active. For instance, among the sample of 91 different industries, T&I deals had achieved 1653 billion EUR, representing 2,97% of the whole sample value (IMAA website, 2017).
1.1.3. Methods of Payment
The means of payment is an important factor to consider in a merger or acquisition because it may have some influence on the value created to shareholders in the transaction (Rappaport and Sirower, 1999). As mergers and acquisitions activity has increased in last three decades, methods of payment had also changed along years (Boone et al. 2014). Boone et al (2014) verified that companies use more and more the mix of stock and cash in the transaction, and that this combination is already treated in form of separate payment category.
When the deal involves a cash payment, the transfer of ownership is relatively simple. However when it comes to stock deals, sometimes it may become difficult to find who the target it is and who the buyer it is (Rappaport and Sirower 1999). In the cash deals, acquiring shareholders bear all risk associated with the realization of synergies expected. This type of transactions usually sends a positive reaction to the market because it demonstrates that the acquirer believes it shares are undervalued and that there exists a strong possibility to achieve synergies.
Concerning to the stock transaction, instead of the acquirer giving to the target shareholders the amount agreed in cash, they give stock. Of course, the acquirer will need
to decide whether it needs to issue more shares or offer fixed value of shares of the newly combined firm (Rappaport and Sirower, 1999). The cash deal has an advantage as it gives to the target shareholders the possibility to stay in the company after the transaction, participate in potential synergies that will result, and also share risks of not materializing synergies (Rappaport and Sirower 1999). Authors conclude that this type of payment is more used in large deals, where the risk for acquired shareholders is much bigger. Boone and her colleagues (2014) conclude that in fact, stock payments increase when there is a huge valuation uncertainty regarding to the target and buyer as well. Another important aspect of the stock transaction is an impact that sends to the capital markets. It mostly indicates that acquirers’ shares are overvalued and that management is not very confident about the probability of success (it shares risks with target shareholders) (Rappaport and Sirower, 1999).
In mixed payments, the buyer gives to target firm shareholders the choice between stock and cash (Boone et al. 2014). Authors also find that the use of this combination of stock and cash has tripled from 10% (in the 1990s) to 30% in 2013, whereas the opposite happened to the other two methods.
To finance the deal, the acquirer has the possibility to issue new shares and as the consequence, the value added will be shared amount more shareholders, reducing the amount for each of them (old shareholder will bear the cost) (Rappaport and Sirower, 1999). The way to not decrease this value added for old shareholders is by offering some stake to acquired firm shareholders, saying that potential value of shares will be bigger if synergies are realized (Rappaport and Sirower, 1999).
Finally, to take the decision regarding the mean of payment, management should decide on three issues: decide if acquirers’ shares are under or overvalued, establish the risk associated with the not realization of synergies and finally, think about stock price behavior before closing the deal (Rappaport and Sirower, 1999).
to operate separately. Synergies can allow according to Eccles et al. (1999): cost reductions, revenue enhancements, process and efficiency improvements, tax savings and financial engineering.
Cost savings is the synergy where company succeeds more since it can control them, and measure costs and deviations internally (Sirower & Sahni, 2006). This results largely in the extinction of some unneeded functions, jobs, and facilities, or even the achievement of economies of scale, since the company starts to have larger purchasing power (Eccles et al. 1999). By the other side, revenue enhancements are harder to control due to its dependence on external factors, such as competitors, clients, macroeconomic conditions, and others (Sirower & Sahni, 2006). Another operational synergy is the possibility to retain the best people and practices in company, and the transference of core competencies.
Regarding financial synergies, these appear when acquirer gains access to lower borrowing rate without affecting its credit rating. It might come from tax savings.
1.2. Valuation Approaches
To value business, several valuation methods exist and thus, the question that arises is which one of them is more reasonable and more accurate to apply to value one specific company. In the current section, we will discuss the classical Discounted Cash Flow (DCF) approach, Adjusted Present Value, and Relative Valuation approach.
1.2.1. Discounted Cash Flow
This is the most popular method to value the company. It emerged in the 1970s and according to it, the value of business equals to expected future cash flows discounted at the weighted-average cost of capital (WACC) (Luehrman, 1997). There also exists another way to value named Adjusted Present Value (APV).
If working with WACC method, the DCF can be comprised of two steps. In the first step, the statements of profit and loss, financial position, and cash flows are projected with at least five years out (Kaplan, 1996). As it requires estimation of future income and other items, it requires a high level of detail. The second step centers on the development of a
valuation model and computation of free cash flows (Free Cash Flows to the Firm), using the following equation:
= (1 − ) + & − − (1)
These future free cash flows are then discounted to time 0 at WACC:
= × + × (1 − ) × (2) In this equation corresponds to the cost of equity calculated through Capital Asset Pricing Model (CAPM) using the equation:
= + × − (3) Regarding the , this is a cost of debt and T corresponds to the tax rate. As it is possible to verify, the taxes are subtracted from the cost of debt, and for that reason the cost of debt needs to be adjusted to the tax shields. WACC rate assumes stable financial structure during explicit period and reflects the time value of money and the cash flows risk. Therefore, it is possible to conclude that WACC works better when managers have an objective of having stable debt-to-capital ratio over the long period (Luehrman, 1997).
1.2.2. Adjusted Present Value
Myers (1974) proposes Adjusted Present Value approach which tries to resolve some limitations of WACC. This approach helps to know more than just if NPV is positive or not. It considers cash flows from different business units and financing strategies (Luehrman, 1997).
To use APV first it is necessary, as in DCF, to forecast cash flows and then discount them as the company was fully equity financed, i.e. discount at the unlevered cost of capital (Kaplan, 1996). Afterwards, given the financing strategy company is going to follow, it is necessary to estimate and discount all financing benefits (tax shields) to t=0 (Kaplan
1.2.3. Relative Valuation
Relative Valuation in practice is the most used method. It simply consists on looking in on a specific industry for companies with similar characteristics to the one that we are trying to value, then compute some of theirs multiples as well as find the value of the underlying company based on benchmark multiples (Lie and Lie, 2002).
Market Multiples
There are many reasons why the use of market multiples in the financial industry is so large (Kaplan and Ruback, 1996). One of them consists on its relative simplicity and its intuitiveness because simply says that similar firms should have comparable characteristics. Additionally, it has an advantage of implying fewer assumptions to value the firm.
To go further with relative valuation, it is necessary to find the “peer group” of the firm (Holthausen and Zmijewski, 2012). Peer group is composed by companies with similar characteristics. Sometimes finding the adequate comparable companies may constitute an obstacle due to differences the firms may present and also an adjustment that needed in particular in the financial variables (Holthausen and Zmijewski, 2012). They can differ significantly in terms of size, activity, growth prospects, risks, and others issues.
Once the peer group is defined, we can proceed to step two of finding suitable multiples. Several authors in finance literature try to explain to what extent some multiples provide valuation close to market values.
Most multiples, generally, involve a combination of different firm variables such as enterprise value, the market value of equity, EBIT, EBITDA, revenues, debt and others (Holthausen and Zmijewski 2012). According to authors multiples will depend from company to company due to business features.
According to Holthausen and Zmijewski (2012), EV/EBITDA is one of the market multiples most utilized to value the firm and despite that, they conclude this multiple is actually not the most “reliable”. EV/earnings, in reality, outperform EV/EBITDA.
Transaction Multiples
Transaction comparables in valuation also revealed to be an important tool for valuing corporate assets. This method consists in looking at similar transactions that occurred in the industry and at which prices transactions were completed (Kaplan and Ruback, 1996). This helps to understanding better the market, namely the competitors’ behaviors and trends of the industry.
1.2.4. Conclusion
The analysts usually opt for using market multiples or transaction multiples (Bancel and Mittoo, 2014). Regardless that, Kaplan and Ruback (1996) found that in fact, DCF performs better than the comparable method. The transaction multiples are very important as they give an idea about transactions values and premiums paid, and whether the market is hot or not.
A
NALYSIS OFE
UROPEANA
IRLINEI
NDUSTRY2.1. Industry Overview
Both Ryanair and Norwegian Air Shuttle, represent European airline industry and therefore in order to frame the underlying transaction, is essential to conduct some analysis of the airline industry. The air transport industry has been important for the world since it creates value for consumers, investors, governments, and broader economies according to IATA 2016 Mid-year report and IATA 2016 End-year report. According to the same source, in 2014 and 2015, the expenses on air transport accounted for 1% of global GDP, and in 2016 accounted for 0,9%. Regarding the RPKs, which is one of the industry main drivers, have been growing since 2014, and even above the world GDP.
The main issues that firms in this industry are obliged to deal with are the large number of competitors and the price pressure (SAS Annual Report 2015/2016). Moreover, in this industry companies support a high proportion of fixed costs out of total costs and the fuel costs are the primary source of company operational costs. Besides that, companies usually generate revenues closer to departure and are affected by a large number of third parties subcontractors and authorities.
The liberalization of European airline industry came into force in 1997 and as a result of, Ryanair and Easyjet grew considerably. One decade after, in March of 2008, the Open-Skies Agreement between the EU and the US took place, and it has been considered as a decisive point for worldwide airline industry (Cento, 2008).
Nowadays, the airline industry is facing more threats related to the terrorist attacks, uncertainty about the evolution of fuel prices, tight regulations, not clear policies of new US President and finally, uncertainties about the Brexit. The consequences of UK exiting the EU are largely unknown, especially which implications it can have for UK air transport in terms of traffic to and from the European Union members (IATA, 2017). Some consequences of Brexit we already feel today, as slower economic growth in the UK and Europe and devaluation of sterling in regard to other currencies. The International Air Transport Association (IATA) studied potential consequences that may arise from this event and found three possible outcomes from negotiations, which obviously have different degrees of risk and complexity:
1) UK becomes a member of EEA (European Economic Area) in the same way as Norway, and gives total access to the Single Market;
2) OK and EU agree on some bilateral agreement, similar to bilateral agreement between Switzerland and EU;
3) Or, WTO relationship.
IATA expects that the year 2017 to be more challenging for European airlines as fuel prices are expected to grow. According to IATA website, the association outlooks the increase of the oil prices from $ 44,6 per barrel (in 2016) to $ 55,0 per barrel (Brent) in this year. This consequently will lead to increase the jet fuel prices. In 2016 jet fuel prices were on average $ 52,1 per barrel, and they are expected to reach $ 64,9 in 2017, representing an increase of 24,6% (IATA 2016 End-year report). To note that the impact of this rise in fuel costs in companies profitability, will also depend on hedging instruments companies have in place. Moreover, during the period in which the fuel costs were low, companies decided to invest in modern aircraft that are more efficient, and therefore, at the same time as fuel prices are expected to increase, the fuel efficiency is expected to improve by 1,5% in 2017.
The oil prices have varied considerably during the past 10 years (Graph 3), reaching the lowest value in January of 2016.
Graph 3: Evolution of Ice Brent Crude Oil Closing Prices (2007-2016); (Source: Data Retrieved From Thompson Reuters) 0,00 20,00 40,00 60,00 80,00 100,00 120,00 140,00 160,00 m ai -2 0 0 7 o u t-2 0 0 7 m ar -2 0 0 8 ag o -2 0 0 8 ja n -2 0 0 9 ju n -2 0 0 9 n o v -2 0 0 9 ab r-2 0 1 0 se t-2 0 1 0 fe v -2 0 1 1 ju l-2 0 1 1 d ez -2 0 1 1 m ai -2 0 1 2 o u t-2 0 1 2 m ar -2 0 1 3 ag o -2 0 1 3 ja n -2 0 1 4 ju n -2 0 1 4 n o v -2 0 1 4 ab r-2 0 1 5 se t-2 0 1 5 fe v -2 0 1 6 ju l-2 0 1 6 d ez -2 0 1 6
Finally, when looking at European airline industry and its margins, IATA forecasts that net post-tax profit is going to drop in 2017 to $ 5,6 billion, representing $ 5,65 per passenger and only 2,9% of revenue.
2.2. Overview of relevant airline company types
The airline industry has two main segments: passengers transport and cargo. Norwegian Air Shuttle and Ryanair provide to its customers only passengers transportation, and therefore only this one will be analyzed further on.
In terms of business models, currently exists two prevalent business models in the airline industry: Full-Service Carriers (FSC) and Low-Cost Carriers (LCCs). These types differ according to the service level provided and the distance of flights (short or long hauls). Moreover, each business model can be characterized by having different network configurations: hub-and-spoke in case of FSCs and point-to-point in LCCs (Lordan et al, 2016).
The FSCs are composed by the airlines that provide both medium and long-haul flights, and medium-high service level. Some examples of FSCs operating in the European market are Lufthansa, AIG, TAP, and Air France – KLM. These use hub-to-spoke networks, which consist on using the central airport or some main airports, called hubs, and that are connected to other airports (Lordan et al, 2016). Hence, to fly from one secondary airport to another, it is necessary to pass through the main hub. Whereas the LCCs’, also called as no frills carriers, their main goal consists in offering mainly short haul flights, on point-to-point network configuration. This means that one specific airline company has several airports, connected to each other (Lordan et al, 2016). Hence to travel from one airport to other, it is not necessary to pass by a central hub, leading to shorter travel time. In the European market, exist two largest LCCs, namely Ryanair and Easyjet.
We find it important to mention that in European market also exist some hybrid companies, which combines characteristics of the previous two types. For instance, Norwegian Air Shuttle is a low-cost carrier. Recently, has forced an entrance into the long-haul market, and providing medium-low service to its clients.
2.3. Consolidation of airline industry in Europe
Worldwide the air transport industry is considered as one of the most dynamic and competitive industries (Lordan et al, 2016). Particularly, European airline industry is fragmented when compared to US airline industry and today, it is facing many challenges due to the current tough competitive environment, namely with many participants entering and starting forming partnerships in order to consolidate its position and capture demand (Canelas and Ramos, 2016).
The industry participants are being challenged by the increasing of the competition. Many have entered into the European market (Middle Eastern and Asian FSCs companies as Etihad) and fight for its market share in this market. Especially, we verify that the growing competition for long-haul traffic is squeezing the profitability of FSCs (Canelas and Ramos, 2016). Likewise, more and purer LCCs are expanding into long-haul flight segment due to pressures on costs and profitability. Another option passes by LCCs trying to cover all gaps in LCCs segment and potentially expand to new areas such as Eastern Europe. Thus, strategically, several airlines are studying some strategic moves in order to not to lose its efficiency, agility, and clients in the European market, through collaboration techniques or even mergers and acquisitions (Canelas and Ramos, 2016).
As an example, we have Air France and KLM Royal Dutch Airlines that merged in 2004 and Lufthansa acquired 100% of Germanwings in 2009. We also have as an example, the International Airlines Group (AIG) which was formed in 2011 as a result of the merger of British Airways and Iberia. Some years later, IAG decides to enforce and consolidate its position in the European market and acquired Vueling and Aer Lingus. On groups’ website we can read that:
“The airline industry is moving gradually towards consolidation though some regulatory restrictions still prevail. IAG's mission is to play its full role in future industry consolidation both on a regional and global scale.”
In 2016, the Norwegian Air Shuttle obtained approval to fly to the US (they already flew to some Asian countries) starting its long-haul plan of expansion. In early 2017, Norwegian Air Shuttle announced partnerships with two biggest LCCs airlines in Europe, Easyjet and Ryanair, so they can also take advantage of the European market, as well as offer to passengers combined flights.
Therefore, it is possible to conclude that there has been quite a lot activity in European airline industry, and further strategic moves are expected to happen in the near future.
2.4. Motives for M&A in airline industry
One needs to understand why airline companies enter into M&A deals, so to frame the current deal proposal and its reasons. The first reason is that pursuing merger is considered as a form of “rapidly achieving external corporate expansion and growth” (Merkert and Merrel, 2012). Authors review what forces incentivize this type of deals in the airline sector. Authors pointed out that some reasons are more related to revenues/costs improvements and others to the cash flows and profits. Thus, they summarize these costs in 6 categories: higher efficiency and reduced costs, higher market share and revenues, less competition, access to airport slots and facilities, access to aircraft and more appealing to customers.
The airlines should also focus their attention on the related potential risks and disadvantages that may result. These common risks that exist may arise from different corporate cultures, potential costs that might come from the transaction, incompatibility of products/services that companies provide, synergies that cannot be realized, and others (Merkert and Merrel, 2012). Moreover, some barriers can appear due to the political, economic regulatory and national identity issues. Some authors affirm that both companies should have similar business models and corporate culture(Lenartowicz et al, 2013).
In this deal proposal, we are considering M&A in LCCs segment and therefore it is necessary to find which factors effects the low-cost airlines. Lenartowicz et al (2013) interviewed experts in LCCs M&A activity and found that “network growth, to remove competition, gain access to new markets, and relieve economic pressure were the main drivers”. Regarding the potential target, this should present some specific characteristics,
being the main the following ones: fleet compatibility, corporate culture and network advantages (Lenartowicz et al, 2013).
2.5. Deal rationale within the industry trends
After analyzing air transport industry, and some transactions that took place recently we can affirm that more activity is expected in next years. Given the recent partnership formed between Norwegian Air Shuttle and main LCCs (EasyJet and Ryanair), we consider that the acquisition of NAS by Ryanair is justifiable.
The first reason is that many competitors in European market just put more and more price pressure and cost efficiency and companies need or to become more efficient or grow in term of revenues or both. Thus LCCs need to start filling the gaps in LCCs market and/or start entering into long-hauls. It should be noted, that Ryanair has flights to 207 destinations in 34 countries, and has some own airports in many countries and serves cities that many airlines do not have the capacity to do. Moreover, it provides flights for two continents (Europe and North Africa). On the other hand, NAS serves fewer airports than Ryanair in Europe and Africa. However, this company already flies to US, Caribbean and Asia (long-route flights) and recently has announced that it is expanding into Argentina. Therefore the deal rationale is:
- Ryanair gains access to continents where NAS operates, boosting the company growth (Appendix 2);
- Elimination of some costs by cutting off common coverage in some less used airports;
- NAS gains access to all airports (Appendix 1) where Ryanair operates and increases purchasing power that holds with their suppliers. This might result in a reduction of costs and even lower flight prices for its’ customers.
F
IRMA
NALYSISRyanair is an Irish air transport company, it is the largest European short-hauls and low-cost carrier company operating. In early 2017, it started to seek for new opportunities in long-haul segment. By the other side, Norwegian Air Shuttle it is also a low-cost carrier (LCC) however it is a provider of flights for both short and long hauls. As opposite to Ryanair, Norwegian Air Shuttle seeks to provide low-medium service level to its passengers.
To justify and endorse deal rationale is indispensable to understand both airline companies involved in the transaction, in terms of operating activities, drivers of costs and revenues and other financial indicators, social issues that surround companies, and risks and opportunities.
3.1. Ryanair
Ryanair is Europe’s low fares and low-cost carrier company that served almost 120 million passengers in 2017 and flying to over 207 destinations in 34 countries. The firm was created in 1985 in Ireland and since then it has been expanding in terms of passengers and employees, aircraft and new destinations. It acquired Buzz Air in 2003 boosting the successful development of new routes and creating of new bases.
Nowadays, Ryanair has 1800 routes across countries of Europe and North Africa, flies to 34 countries, has 86 bases and operates in 207 airports (of these 110 are Primary ones) (Appendix 1).
3.1.1. Ownership Structure
To understand better the organization, we also can look at its ownership structure. Ryanair (ticker RYA.I) has six major shareholders: Capital, HSBC, Fidelity, O’Leary, Baillie Gifford & Co. The rest of shareholders detain much lower piece of the company, except company directors and executive officers (detain 4,6% as of 30 June 2017). Moreover, the company shares are traded on Irish Stock Exchange Market and London Stock Exchange.
3.1.2. Operating Revenues
This airline company classifies revenues in scheduled revenues and ancillary revenues. These both sources of revenues are driven by the number of passengers that use company services that have been increasing over the years as it is illustrated in the following figure.
Graph 5: Historical number of passengers of Ryanair (Source: Ryanair Annual Reports). 0,00 20,00 40,00 60,00 80,00 100,00 120,00 2010 2011 2012 2013 2014 2015 2016 2017 Number of Passengers (in million)
Graph 4: Breakdown of Ryanair major shareholders (Source: Ryanair Annual Report 2017). 0,00% 10,00% 20,00% 30,00% 40,00% 50,00% 60,00% 70,00% Capital HSBC Fidelity Baillie Gifford Michael O'Leary Other Capital HSBC Fidelity Baillie Gifford Michael O'Leary Other June 30, 2017 61,50% 3,80% 5,10% 5,80% 9,30% 14,50%
The scheduled revenues are obtained directly through passengers booked, and its’ value has also been increasing over the years, as a result of a yearly increase of the passenger volumes on existing routes and the successful launch of new bases. Concerning the ancillary revenues, these can be unfolded in non-flight scheduled, in-flight sales and Internet-related proceeds. Moreover, the ancillary revenues have been gaining more and more important in terms of absolute values along years on total operating revenues of Ryanair. To understand better these two types of company operating revenues, we decided to illustrate these in terms of revenue per passenger booked. When analyzing the data presented below we verify that, on average, the scheduled revenues per passenger and the ancillary revenues per passenger had increased from 2010 until 2017.
Even though the scheduled revenues decreased, the total Ryanair revenues of the year increased as a result of an increase in ancillary revenues. This shows that non-ticket related revenues are getting more and more importance along years.
3.1.3. Operating Expenses
In terms of operating expenses, the company classifies these as the ones that are directly linked up to revenues. By its’ values, it’s plausible to conclude that Ryanair main costs are the fuel and oil costs. The airport and handling charges, route charges and fixed costs
0,00 10,00 20,00 30,00 40,00 50,00 60,00 2010 2011 2012 2013 2014 2015 2016 2017 In eu ro s
Sheduled revenues per passenger booked Ancillary revenues per passenger booked
Graph 6: The Evolution of Operating Revenues per Passenger Booked during period 2010-2017 of Ryanair. (Source: Ryanair Annual Reports)
with staff also account for a big part of total costs. To note that almost all of these items grew during past year not only because of macroeconomic factors as inflation but also are the result of 18% traffic growth and the settlement of more new primary airports to the airline company network.
Graph 7: The classification of the operating expenses of Ryanair, in millions of euros. (Source: Ryanair Annual Reports).
Because the overall operational expenses of Ryanair grew slightly during past year (Graph 7), the expenses per passenger grew also as expected.
Graph 8: The evolution of operating expense per passenger booked from 2010 to 2017 of Ryanair in euros 0,0 500,0 1 000,0 1 500,0 2 000,0 2 500,0 Staff costs
Depreciation Fuel and oil costs Maintenance, materials and repairs Aircraft rentals Route charges Airport and handling charges Marketing, distribution and others
2016 2017
2010 2011 2012 2013 2014 2015 2016 2017 Operating expense per
passenger booked 39,1 43,6 48,9 52,5 53,6 50,9 47,7 48,3 30,0 35,0 40,0 45,0 50,0 55,0
3.1.4. Analysis of key financial items
It also important to look at some company main financial items and its evolution during the past 5 years. When looking at EBIT, one of the main indicators of margin, it is possible to observe positive and increasing margins during the period 2012-2017. The same applies to the net income. Ryanair presented the annual net income of at least 10% out of total revenues of the year.
Concerning the earnings per share (EPS), these fell from 2016 (€116,26 cents) to 2017 (€105,30 cents) when looking at Table 1 presented on the next page. However, if we exclude the effect of exceptional accounting gain of €317,5m on the sale of Aer Lingus shareholding of FY2016, the EPS accounts for €92,59 cents in FY 2016. Therefore, as expected, due to share buyback program in course since 2006 together with good performance of Ryanair, made EPS as well as price per share (PPS) increasing along years (Graph 9).
In terms of market perception of company equity, we can see it was always well above its book value (Table 1). Therefore, investors’ perception about the business and the future prospects have been and continues to be very positive.
3.1.5. Evolution of Ryanair Price Per Share
We find important to illustrate the evolution of the market price of Ryanair since 2012. The evolution were positive and price per share grew considerably during this period. The share price reached the value of 17,845€ per share in the end of June 2017, reaching the market cap of 22 590,40m euros. Moreover, since year 2012 the stock price have been increasing 32,61% on average per annum (Graph 9). Therefore, this shows that the past years have been quite rewarding for Ryanair shareholders.
Ryanair
(in million of €) FY2012 FY2013 FY2014 FY2015 FY2016 FY2017
Operating Revenues 4390,2 4884,0 5036,7 5654,0 6535,8 6647,8 % growth 20,96% 11,25% 3,13% 12,26% 15,60% 1,71% EBITDAR 1083,1 1146,0 1111,9 1530,0 2002,5 2117,6 % margin 24,67% 23,46% 22,08% 27,06% 30,64% 31,85% EBITDA 992,4 1047,8 1010,4 1420,6 1887,4 2031,5 % margin 22,60% 21,45% 20,06% 25,13% 28,88% 30,56% EBIT 683,2 718,2 658,6 1042,9 1460,1 1534,0 % margin 15,56% 14,71% 13,08% 18,45% 22,34% 23,08% Net Income/loss 560,4 569,3 522,8 866,7 1559,1 1315,9 % margin 12,76% 11,66% 10,38% 15,33% 23,85% 19,79%
EPS (in € cent) 38,03 39,45 36,96 62,59 116,26 105,30
Average Staff 8438 9059 9501 9586 10926 12438
End-year Fleet 294 305 297 308 341 383
Total Assets 9001,0 8943,0 8812,1 12185,4 11218,3 11989,7
Total Equity 3306,7 3272,6 3285,8 4035,1 3596,8 4423,0
Total Debt 3625,2 3498,3 3083,6 4431,6 4023,0 4384,5
Price per share year
end (in €) 4,48 5,95 7,61 11,13 14,17 14,53
Graph 9: The evolution of RYANAIR PPS 01/02/2016 – 30/06/2017) (Source: Irish Stock Exchange website www.ise.ie/).
Ryanair Price per Share; 17,845 (30/06/2017) 0 2 4 6 8 10 12 14 16 18 20 0 1 /2 0 1 2 0 4 /2 0 1 2 0 7 /2 0 1 2 1 0 /2 0 1 2 0 1 /2 0 1 3 0 4 /2 0 1 3 0 7 /2 0 1 3 1 0 /2 0 1 3 0 1 /2 0 1 4 0 4 /2 0 1 4 0 7 /2 0 1 4 1 0 /2 0 1 4 0 1 /2 0 1 5 0 4 /2 0 1 5 0 7 /2 0 1 5 1 0 /2 0 1 5 0 1 /2 0 1 6 0 4 /2 0 1 6 0 7 /2 0 1 6 1 0 /2 0 1 6 0 1 /2 0 1 7 0 4 /2 0 1 7 In eu ro s
3.2. Norwegian Air Shuttle
The company we propose to Ryanair to acquire is Norwegian Air Shuttle (NAS). Hence, in this section, we are going to conduct the same analysis for NAS in order to understand its historical operational and financial performances.
NAS is a low-cost carrier that provides low-medium service level to the clients of it services. It flies short-hauls and long-haul routes and is considered as the sixth largest low-cost carrier in the world. It offers more than 500 routes and over 150 destinations across Europe, North Africa, the Middle East, Thailand, the Caribbean and the US. The approval to fly to the US was recently obtained by Department of Transportation (Appendix 2).
In 2016, NAS was recognized as the “World’s Best Long Haul Low-Cost Airline” and “Best Low-Cost Airline in Europe”.
3.2.1. Ownership Structure
The company stocks are traded on OSLO BORS ASA since 2003, and the company had 35.759.639 of shares outstanding as of 30/06/2017. In order to understand better this airline, we start by presenting the ownership structure of NAS (ticker NWC.OL). In graph 10 we present major shareholders of Norwegian as of 30/06/2017. Briefly we conclude that HBK Invest AS is the largest NAS shareholder, detaining about 17,90% of company stock.
Graph 10: Breakdown of Norwegian Air Shuttle major shareholders (Source: NAS Interim Report for Q2). 82,10% 3,10% 4,20% 5,10% 6,40% 7,10% 17,90% 0% 15% 30% 45% 60% 75% 90% Others shareholders DNB Asset Management AS Norway
Ferd AS Norway Danske Capital Norway Skagen AS Norway Folketrygdfondet Norway HBK Invest AS Norway
3.2.2. Operating Revenues
NAS operating revenue may be separated by geography (national and international) or by revenue type (passenger transport, ancillary revenues, and other income). In geographic terms, both domestic and international revenues have been increasing since 2008. However, it is important to emphasize that operating revenues from international geographies has been increasing faster because of the increase of passenger traffic openness to new routes to new destinations.
The graph above displays that the international exposure has been more significant along years, and it's increasing its significance as years pass by. Only in 2016, it generated to NAS around 20.000m Norwegian kroners.
We also gather information on how the revenues are collected. The largest part of overall revenues comes from passenger transportation (Graph 12). Other source of revenues called the ancillary revenues, are composed of the sales of ticket-related products and services as revenues from baggage sales and seating and others. This type of revenues has been gaining more importance for NAS (Graph 12). Finally, the named other revenues,
0 5 000 10 000 15 000 20 000 25 000 30 000 2008 2009 2010 2011 2012 2013 2014 2015 2016 In m il li o n o f N o rw eg ia n K ro n er s Domestic International
Graph 11: The evolution of operating revenues of Norwegian Air Shuttle by geography type (2008-2016) (Source: Norwegian Air Shuttle Annual Reports and Thompson Reuters).
Graph 12: The evolution of operating revenues of Norwegian Air Shuttle by source (2007-2016) (Source: Norwegian Air Shuttle Annual Reports and Thompson Reuters).
0 5 000 10 000 15 000 20 000 25 000 2007 2008 2009 2010 2011 2012 2013 2014 2015 2016 In m il li o n o f N o rw eg ia n K ro n er
Passenger transport Ancillary revenue Other revenues
0 5 000 000 10 000 000 15 000 000 20 000 000 25 000 000 30 000 000 2007 2008 2009 2010 2011 2012 2013 2014 2015 2016 Number of passengers
Graph 13: The number of passengers transported by Norwegian Air Shuttle (2007-2016) (Source: Norwegian Air Shuttle Annual Reports).
3.2.3. Operating Expenses
The firm has multiple sources of operational costs (Graph 14). Firstly there are the costs related to aircraft, fuel, the costs related to airports and staff costs. As normal, the largest sources of cost are directly related to the company activity, such as the aviation fuel, and airport and staff expenses. Secondly, NAS has also substantial expense with aircraft leases, which have increased considerably from 2015 to 2016. Note that the majority of costs, except aviation fuel, decreased during last year accompanied by increase in revenues.
It is necessary to look at yearly operational expenses per passenger booked as it shows better whether the increase in costs was slow or not, and whether it happened as revenues increase. As per following graph we verify that although the overall operating costs increased from 2015 to 2016, the cost per passenger booked decreased in the same period. Moreover the revenue per passenger booked increased during past year. Threfore this may improve somehow Norwegian airline low margins (Graph 15).
Graph 14: The classification of the operating expenses of Norwegian Air Shuttle and comparison of operational expenses between year 2015 and year 2016. (Source: Norwegian Air Shuttle Annual Reports).
(1 000) 0 1 000 2 000 3 000 4 000 5 000 6 000 Sales & Distribution Expenses
Aviation Fuel Airport Charges Handling Charges Technical Maintenance Expenses Other aircraft Expenses Staff costs Other operating expenses Other losses/(gains) - net Aircraft Leases Depreciation and amortization
3.2.4. Analysis of key financial items
The Table 2 presents the firm’s main financial items retrieved from Annual Reports of NAS and Thompson Reuters during the period 2012-2016. We confirm that company was struggling with margins in previous years. For instance, when considering the operational margin EBIT, we observe it has been low and negative in year 2014. We also point out that in some years, we have positive EBITDAR but then the company has large fixed costs related to aircraft leases, thus sending the EBITDA margin to negative amounts.
Consequently, the EPS values (Appendix 5) have been very unstable during the period of analysis. In terms of market perception of company equity, the market capitalization during last three years has always been above the equity book value.
3.2.5. Evolution of Norwegian Air Shuttle Price per Share
In the end of June of 2017, the price per share stood at 243,20 NOK (Oslo Stock Exchange) and Norwegian had the market cap of 8 696,7m NOK. The market share price is more volatile in case of Norwegian than for Ryanair. As opposite to Ryanair, the NAS price suffered great variations since 2012, but overall it has been increasing on average 30,39% p.a. (Graph 16). 400 450 500 550 600 650 700 750 800 850 900 2007 2008 2009 2010 2011 2012 2013 2014 2015 2016 In N o rw eg ia n K ro n er s
Operational expenses per passenger booked Revenues per passenger booked Graph 15: The Evolution of operational expenses and revenue per passenger booked 2007-2016. (Source: NAS Annual Reports).
In millions of Norwegian Kroner 2012 2013 2014 2015 2016 Operating Revenues 12841,0 15511,0 19540,0 22483,5 25950,6 % growth 21,96% 20,79% 25,98% 15,06% 15,42% EBITDAR 1804,0 2716,0 1183,0 3686,5 5854,1 % margin 14,05% 17,51% 6,05% 16,40% 22,56% EBITDA 771,0 1432,0 -663,0 1473,5 3012,2 % margin 6,00% 9,23% -3,39% 6,55% 11,61% EBIT 386,0 902,0 -1411,0 340,5 1716,4 % margin 3,01% 5,82% -7,22% 1,51% 6,61% Net Income/loss 457,0 323,0 -1070,0 246,5 1135,0 % margin 3,56% 2,08% -5,48% 1,10% 4,37%
EPS (in Norwegian
kroner) 13,08 9,15 -30,42 6,99 31,75 Full-time staff 2705 3507 4375 4576 5796 End-year Fleet 68 85 95 99 118 Total assets 11 920,0 14 763,0 22 708,0 31 634,0 37 762,7 Total Equity 2 421,0 2 751,0 2 109,0 2 965,0 4 049,0 Total Debt 5 692,0 6 917,0 14 117,0 20 842,0 24 936,5
Mid-market price per
share (in NOK) 143,90 188,20 276,20 323,70 287,0
Graph 16: The evolution of NAS PPS on Oslo Stock Exchange (2012-2017) (Source: Yahoo Finance). Norwegian Air Shuttle price per
share; 243,20 (30/06/2017) 0 50 100 150 200 250 300 350 400 0 1 /2 0 1 2 0 4 /2 0 1 2 0 7 /2 0 1 2 1 0 /2 0 1 2 0 1 /2 0 1 3 0 4 /2 0 1 3 0 7 /2 0 1 3 1 0 /2 0 1 3 0 1 /2 0 1 4 0 4 /2 0 1 4 0 7 /2 0 1 4 1 0 /2 0 1 4 0 1 /2 0 1 5 0 4 /2 0 1 5 0 7 /2 0 1 5 1 0 /2 0 1 5 0 1 /2 0 1 6 0 4 /2 0 1 6 0 7 /2 0 1 6 1 0 /2 0 1 6 0 1 /2 0 1 7 0 4 /2 0 1 7 0 7 /2 0 1 7 1 0 /2 0 1 7 In N o rw eg ia n k ro n er s
V
ALUATIONIn this section, we will make an attempt to validate the underlying transaction.
The final goal consists in determining the price per share of both companies on a stand-alone basis and merged, using different valuation methods in order to take an investment decision. We start valuation with the estimation window of eight years for Ryanair (fiscal year ending 31/03) and for Norwegian Air Shuttle AS (fiscal year ending 31/12). After that period, the forecasts are considered to be very uncertain, and therefore we assume perpetuity.
Moreover, valuations on stand-alone basis are made in currencies used in firm annual reports, i.e. Ryanair uses Euros as a currency and Norwegians Air Shuttle uses Norwegian kroners. On consolidation basis, Norwegian results will be translated to euros at spot rate S(EUR/NOK) of 9,58708NOK (30/06/2017) (Appendix 7).
To value both companies on stand-alone perspective, and given the literature review, the two methods to be used are: DCF (WACC to discount FCFF) and Comparable Market Multiples.
4.1. Ryanair
We start with DCF valuation and after, will continue with the relative valuation method.
4.1.1. Discounted Cash Flow Model 4.1.1.1. Total Operating Revenues
The total operating revenues of Ryanair are divided into two categories: revenues from tickets sold and ancillary revenues. To forecast both types of revenues, the forecasted number of passengers by Ryanair until the year 2025 will be used (Graph 17). We also present the aircraft number Ryanair management is expecting to have between 2018-2025 (Graph 18).
Graph 17: The goal established by Ryanair in terms of number of passengers (2018-2025). (Source: Ryanair Annual and Interim Reports).
131 142 152
162 175 189
200 206
2018F 2019F 2020F 2021F 2022F 2023F 2024F 2025F Number of Passengers (in million)
0 200 400 600
2018F 2019F 2020F 2021F 2022F 2023F 2024F 2025F
Graph 18: The number of airliners Ryanair is expecting to have between 2018-2025. (Source: Ryanair Annual and Interim Reports).
growing revenues, mainly due to increase in passenger number. As the consequence, to forecast the revenues for the following eight years we are going to use the disclosed number of passengers the Ryanair is searching to achieve by year by 2024, and for the year 2025, we assume 3% of growth in passenger number.
The total scheduled revenues during the forecasting period result from the product between the scheduled revenues per passenger booked and a number of passengers served. For that, we need to consider also the evolution of scheduled revenues per passenger booked in the previous section, and for future assume it will be 2,0%1 per year.
Ancillary Revenues
For ancillary revenues, we follow the same logic as for scheduled revenues. We take an assumption that the revenue per passenger will grow at the inflation rate1.
Summing up, we estimate the following evolution of the total operating revenues (graph 19):
4.1.1.2.Total Operating Expenses
Regarding the forecast of operating expenses, we followed the following approach:
1 Source:https://data.oecd.org/price/inflation-forecast.htm . 0,0 2 000,0 4 000,0 6 000,0 8 000,0 10 000,0 12 000,0 14 000,0 2018F 2019F 2020F 2021F 2022F 2023F 2024F 2025F Scheduled Revenues Ancillary Revenues
- Depreciation: over the past 3 years, the depreciation rate remained relatively stable. On average, it stood at 6,87%, and therefore we assume it will continue to remain at 6,87% of PPE;
- Fuel and oil costs: These costs are directly related to revenues, and accordingly if revenues increase, the fuel costs should naturally increase too. We consider the three year average of percentage of total revenues for 2018 (31,90% for FY18) and assume that the percentage will decline until 28,00%.
- For the rest of operating expense categories, we assumed these items will grow at average growth rate of last three years.
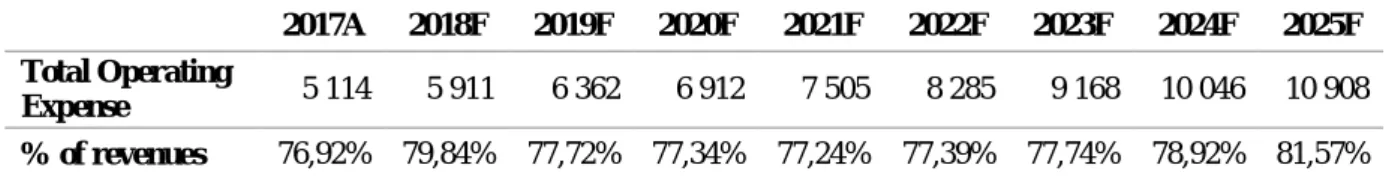
Summing up, our forecasts of amounts of total operating yearly expense are the following:
2017A 2018F 2019F 2020F 2021F 2022F 2023F 2024F 2025F Total Operating
Expense 5 114 5 911 6 362 6 912 7 505 8 285 9 168 10 046 10 908 % of revenues 76,92% 79,84% 77,72% 77,34% 77,24% 77,39% 77,74% 78,92% 81,57%
Table 3: Forecasted total operating expenses in euros and as percentage of revenues. (Source: Own Calculations).
4.1.1.3. Cost of Capital
In order to proceed with the calculation of the cost of capital, we need to consider the following variables: the cost of equity, cost of debt, equity and debt ratios, beta, market risk premium, risk-free and tax rate.
Firstly, concerning the computation of the cost of equity, we use as risk-free rate the yield of 0,466% of German Government Bund 10y2, and as Beta, we use 1,043. Finally, for
market risk premium we use the one provided for Ireland by Fernandez (2017) of 6,70%. Overall we obtain the cost of equity of 7,43% (Appendix 8).
Secondly, Ryanair cost of debt in 2017 stood at 1,49% (March 31) (Source: Ryanair Annual Report 2017). This interest rate corresponds to the weighted average interest rate obtained by the company in different types of debt in use.
The Statutory rate of Irish corporation tax is 12,50%, nevertheless, the company has paid on average only 10,58% (mean rate of past 3 years). We consider the legal tax rate in our forecasts. Therefore, we get the after-tax cost of debt of 1,30% (Table 4).
Cost of debt 1,49%
Irish Tax rate 12,50% After-tax cost of debt 1,30%
Table 4: Net cost of debt as of 31/03/2017 (Source: Ryanair Annual Report 2017).
Items related to long-term debt and its current maturities were projected based on the information provided in annual reports. Therefore we consider debt amount of EUR4.569,7m (current and non-current debt, including capital leases) as of 31/03/2017, and Debt/Assets of 16,72%.
Summarizing, we obtain the weighted-average cost of capital of 6,41% (Appendix 9).
4.1.1.4.Capital Expenditures and Net Working Capital
The working capital results from subtracting the current liabilities from the current assets. With the goal of calculating the Working Capital (Appendix 12) needs for the future, we do not include items such as the cash and cash equivalents, the short-term debt and other investments in its calculation.
As for the capital expenditures forecasting, the company annual reports state historical values. We conduct the forecast and define that it will decrease to 6%, converging to the depreciation rate (Appendix 13).
We present forecasted income statements and statements of financial position (2018-2025) in Appendix 10 and 11 respectively.
4.1.1.5. Free Cash Flows to the Firm
Given the income statement and balance sheet projections, we continue with the calculation of FCFF.
For that, we consider the growth rate of 1,50% after 2025 (inflation rate forecasted by Bergin et al (2016)) and WACC of 6,41%. Summarizing, the results obtained are the following (also in Appendix 14):
2018F 2019F 2020F 2021F 2022F 2023F 2024F 2025F FCFF (37,8) 468,8 492,9 731,7 780,9 1 076,5 1 429,9 1 551,6 TV 32 082,0 WACC 6,41% PV(TV) 19 518,1 81% PV(FCFF) 4 542,0 19% EV 24 060,1 100% Debt 4 569,7 Cash 1 224,0 Equity 20 714,4 PPS 16,24
Table 5: Forecasted FCFF Ryanair (Source: Own Computations).
The stock price at 30/06/2017 stood at 18,845€, what indicates that according to DCF approach, Ryanair share price is overvalued by the market in about 16,04%.
Next it is possible to visualize the stock price changes in relation to changes in growth rate and cost of capital. We conclude the stock price is sensitive to changes in two variables. Growth Rate 16,24 0% 0,50% 1% 1,50% 2% 2,50% 3% WACC 5% 17,69 19,61 22,01 25,10 29,22 34,98 43,63 5,50% 15,53 17,05 18,91 21,23 24,22 28,20 33,78 6% 13,74 14,96 16,44 18,23 20,48 23,37 27,22 6,41% 12,49 13,53 14,76 16,24 18,06 20,35 23,30 6,50% 12,23 13,23 14,42 15,84 17,58 19,76 22,55 7% 10,94 11,78 12,75 13,90 15,27 16,96 19,06
Table 6: Sensitivity analysis of Price per Share to changes in growth rate and WACC (Source: Own Computations).
low cost carriers, being EasyJet the main competitor of Ryanair in the LCC segment in Europe. Norwegian is also a low-cost carrier, by instead on focusing on Western Europe, it operates more at North o Europe. Finally, the Southwest Airlines is the largest American airline company that launched a low-cost carrier business model, which some years after was adopted by Ryanair in Europe.
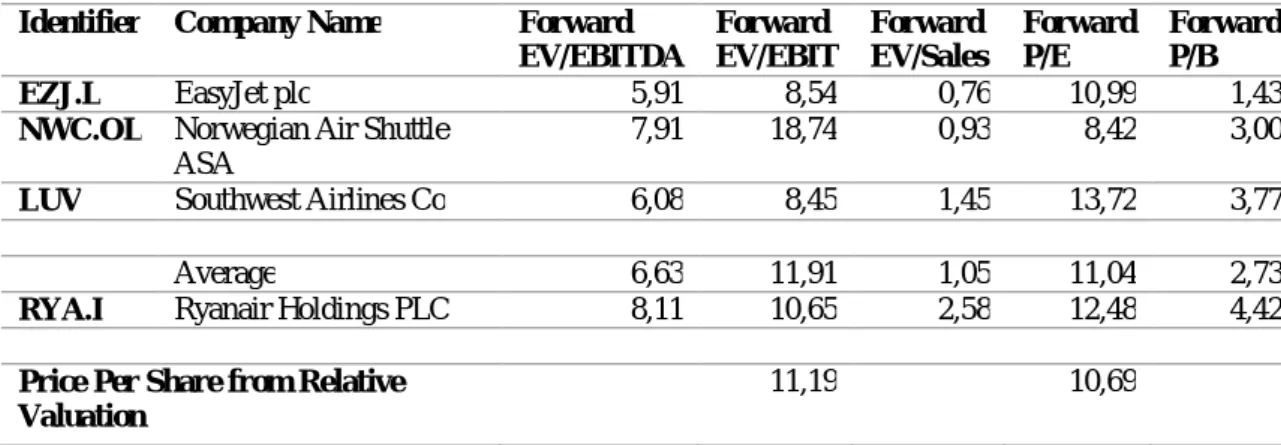
In terms of market multiples, we find necessary to use forward multiples, as these usually perform better than simple multiples (Liu et al, 2002).
Identifier Company Name Forward EV/EBITDA Forward EV/EBIT Forward EV/Sales Forward P/E Forward P/B EZJ.L EasyJet plc 5,91 8,54 0,76 10,99 1,43 NWC.OL Norwegian Air Shuttle
ASA
7,91 18,74 0,93 8,42 3,00
LUV Southwest Airlines Co 6,08 8,45 1,45 13,72 3,77
Average 6,63 11,91 1,05 11,04 2,73
RYA.I Ryanair Holdings PLC 8,11 10,65 2,58 12,48 4,42 Price Per Share from Relative
Valuation
11,19 10,69
Table 7: Peer group multiples (Source: Thompson Reuters and Own Calculations).
By the Table 7, we find that Ryanair outperform its peers in terms of Forward EV/EBITDA, Forward EV/Sales, Forward P/B. Therefore, due to these differences, it does not seem correct to use these multiples to estimate relationship between Ryanair and its peer group.
In this way, we only take into account Forward EV/EBIT and Forward P/E. The first multiple suggests us the price per share of 11,19€ (below the current market price) and the second point out the price per share of 10,69€ (once again, below the current market price).
4.2. Norwegian Air Shuttle
In this part, the stock price of Norwegian Air Shuttle is going to be determined using two different methods, and after, will be compared to the one quoted on Oslo Stock Exchange.
4.2.1. Discounted Cash Flow Method
To use DCF, the financial projections of revenues, operating expenses, debt and other items of the company are produced, for the next eight years.
4.2.1.1. Total Operating Revenues
NAS, as mentioned above, has three types of revenues: Scheduled Revenues, Ancillary Revenues, and Other Revenues.
Scheduled Revenues
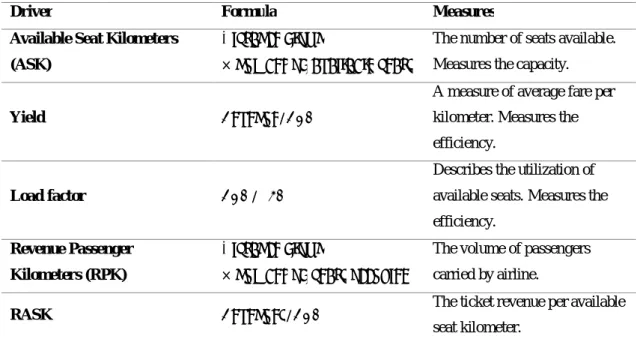
The NAS revenues are driven by three elements: ASK, Yield and Load Factor.
Driver Formula Measures
Available Seat Kilometers
(ASK) ×
The number of seats available. Measures the capacity.
Yield /
A measure of average fare per kilometer. Measures the efficiency.
Load factor /
Describes the utilization of available seats. Measures the efficiency.
Revenue Passenger
Kilometers (RPK) ×
The volume of passengers carried by airline.
RASK / The ticket revenue per available
seat kilometer. Table 8: The operating metrics of NAS (Source: Ryanair Annual Reports).
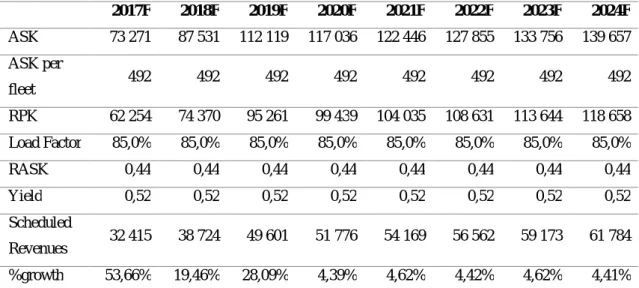
point and given the historical trend, we assume the number of aircraft will grow on average 4,50% per year, i.e. some will depreciate and simultaneously company will look for its substitution. To mention the life expectancy of the body of the aircraft is 25 years for the majority of airline aircraft (NAS Annual Report 2016). Consequently we project the following number of airplanes:
With the goal of estimating ASK, we make one assumption about the number of ASK per fleet. We see the last three years and obtain the average of 492 million, and assume it constant over next years. We also assume the load factor is going to stand on 85% (3-year average). 2017F 2018F 2019F 2020F 2021F 2022F 2023F 2024F ASK 73 271 87 531 112 119 117 036 122 446 127 855 133 756 139 657 ASK per fleet 492 492 492 492 492 492 492 492 RPK 62 254 74 370 95 261 99 439 104 035 108 631 113 644 118 658 Load Factor 85,0% 85,0% 85,0% 85,0% 85,0% 85,0% 85,0% 85,0% RASK 0,44 0,44 0,44 0,44 0,44 0,44 0,44 0,44 Yield 0,52 0,52 0,52 0,52 0,52 0,52 0,52 0,52 Scheduled Revenues 32 415 38 724 49 601 51 776 54 169 56 562 59 173 61 784 %growth 53,66% 19,46% 28,09% 4,39% 4,62% 4,42% 4,62% 4,41% Table 10: Forecasted operational metrics and scheduled revenues of NAS. ASK and RPK in million; RASK and Yield in NOK; Scheduled Revenues in millions of NOK (Source: Own Calculations).
Ancillary Revenues and Other Revenues
We look at the values of ancillary revenues and find no patterns in data, and therefore make an attempt to project this item as the fixed percentage of scheduled revenues. We observed its evolution during the last three years and verified that, on average, it was 17,70% of scheduled revenues. We take this value as the reference for our estimation. Table 9: The forecast of the number of aircraft for NAS (Source: NAS Annual Report 2015 and 2016, and own assumptions).
2017F 2018F 2019F 2020F 2021F 2022F 2023F 2024F
Concerning the other revenues, we follow the same reasoning and fix percentage at 4,04%.
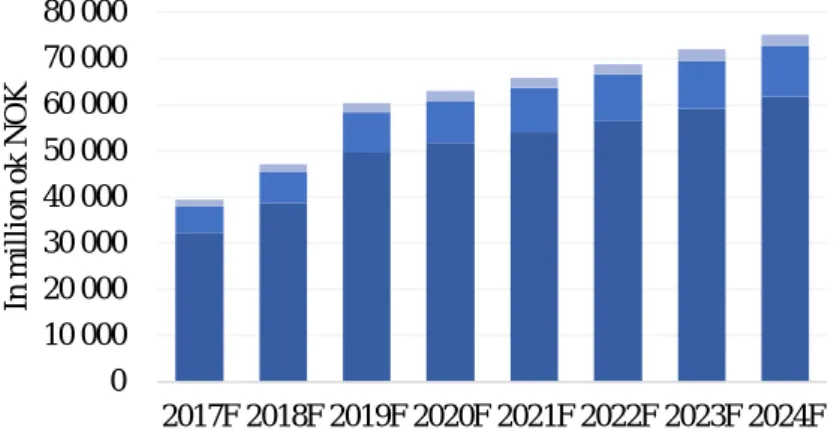
Graph 20: The Forecasted Operating Revenues of Norwegian Air Shuttle (Source: Own Computations).
4.2.1.2. Total Operational Expenses
NAS organizes costs in categories as disclosed in Appendix 16. To estimate different items of operating expenses, and based on historical, we follow the following procedure:
- Directly Related Operating Expenses: During last 5 years the evolution of operating expenses out of total operating revenues (in percentage) was the following:
Year 2012 2013 2014 2015 2016
Total Operating Expenses (% Total Operating Revenues)
71,12% 73,30% 78,61% 70,45% 69,46% Table 11: Norwegian Air Shuttle expenses expressed as percentage of revenues (Source: Norwegian Air Shuttle Annual Reports).
The items that are part of group Directly Related Operating Expenses, were forecasted as a fixed percentage (average of past 3 years) of total directly related expenses (Appendix 17); 0 10 000 20 000 30 000 40 000 50 000 60 000 70 000 80 000 2017F 2018F 2019F 2020F 2021F 2022F 2023F 2024F In m il li o n o k N O K
- Payroll: As for payroll forecast, it did not vary much as percentage of total revenues. Therefore we assume it will position itself at same level as in previous years (15%) (more detailed in Appendix 17);
- As per other operating expenses and Other losses/(gains) we assumed 5,50% and 0,96% respectively.
Summing up, we project the following total operating expenses:
4.2.1.3. Cost of Capital
To compute WACC, once again we need the following items: the cost of equity, cost of debt, equity, and debt ratios, beta, market risk premium, risk-free and tax rate.
With regard to the risk-free interest rate, we use 1,655% which corresponds to the Norwegian Government Bond with a maturity of 10 years retrieved from Thomson Reuters at date 30/06/2017. The equity beta of 1,03 was also retrieved from Thomson Reuters and as Norwegian market risk premium we use rate of 6,10% (Fernandez et al, 2017). Finally, we obtain the cost of equity of 7,94%.
As for the cost of debt, we use the interest rate of 2,75% used in previous year (Source: Norwegian Air Shuttle Annual Report 2016). The legal Norwegian Corporate Rate stands on 27%. Therefore, after-tax cost of debt corresponds to 2,01% (Table 12).
Graph 21: The Evolution of Total Operating Expenses 2017-2024 (Source: Own Computations). 0 10 000 20 000 30 000 40 000 50 000 60 000 70 000 80 000 2017F 2018F 2019F 2020F 2021F 2022F 2023F 2024F In m il li o n N O K
Cost of debt 2,75% Norwegian Corporate Tax Rate 27,00% After-tax cost of debt 2,01%
Table 12: Net cost of debt as of 31/12/2016 (Source: Norwegian Air Shuttle Annual Report 2016). Concerning the debt outstanding, at 31/12/2016 it was equal to NOK 24 936,51m. For purpose of computing the cost of capital, we consider the target ratio of D/A of 74,14%.
Summarizing, given the variables, the cost of capital (WACC) obtained resumes in 3,54%. Comparing these cost of debt with the cost of debt given by Norwegian in last year annual report – of 5,70%, we decide to use the one indicated by the company in order to take more a conservative approach.
4.2.1.4.Capital Expenditures and Net Working Capital
The capital expenditures (CAPEX) covers all expenditures incurred by the company to acquire or/and update of physical assets (Appuhami, 2008). In this case, capital expenditures by Norwegian correspond to the acquisition of new aircraft and improvements of quality of the current ones. As we predict the company is going to continue investing. By the year 2024, we forecast investment in new aircraft will be more or less at the same level as depreciations (Appendix 21), i.e. at the same time as aircraft loses its economic value, the company makes additional investment so to replace it with a new one.
For calculation of the net working capital for Norwegian, we do not include items such as the cash and cash equivalents, the short-term debt and other investments. Our results are resented in Appendix 20.
The other financial statements for the period 2017-2024 (Income Statement and Balance Sheet) we disclose in Appendices 18 and 19 (in domestic currency). In our forecasts we assume the company will not distribute any dividends, due to continuous investment plans
4.2.1.5. Free Cash Flow to the Firm
In the same way as we computed for Ryanair, we are going to compute Operational Cash Flow and Free Cash to the Firm for NAS (Appendix 22).
Regarding the Norwegian Air Shuttle recommendation to use the growth rate of 0% on valuations beyond 8 years, we do not follow it because recently, the company entered into new business unit – long-haul segment (it launched flights to new destinations – US).
We decided to use the norwegian expected inflation rate. Norges Bank (2017) expect inflation rate to be higher than 1,50%4 at the end of 2020 and therefore we consider 1,50% as a growth rate in Norwegian Air Shuttle valuation.
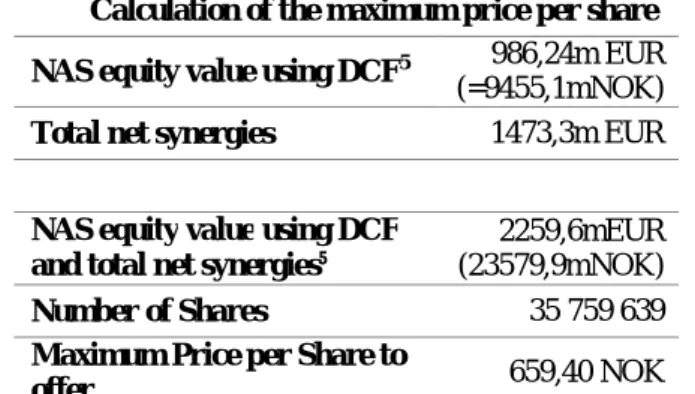
Finally, given forecasted variables we obtain the Enterprise Value of NOK 32 068,0m. After taking out the net debt of NOK 22 612,9m, we stand with equity of NOK 9 455,1m. Therefore the price per share is of NOK 264,41 (number of shares is 35759639). Considering the S(EUR/NOK, 30/06/2017) of 9,58708 kroners we obtain the equity value of 986,2€. 2017 2018F 2019F 2020F 2021F 2022F 2023F 2024F FCFF (6 787,4) (5 030,4) (4 467,8) 2 070,9 2 152,4 2 270,7 2 363,2 2 492,2 60 227,3 WACC 5,70% PV(TV) 38 653,9 120,54% PV(FCFF) (6 585,9) -20,54% EV 32 068,0 100,00% Debt 24 936,5 Cash 2 323,6 Equity 9 455,1 PPS 264,41
Table 13: Forecasted FCFF Norwegian Air Shuttle in NOK (Source: Own Computations).
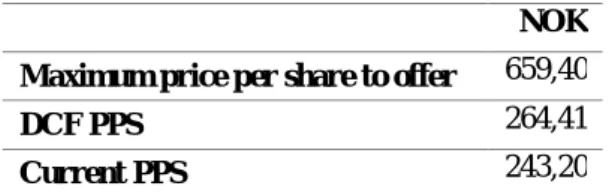
Given the market price per share at 30/06/2017 of 243,20 NOK, and given the price per share obtained through DCF method, we conclude that Norwegian Price per share is 8,02% undervalued by the market.
4 See in
http://static.norges-bank.no/contentassets/b36f0051784546c5a56ce612036e9c4c/mpr_2_17.pdf?v=11/30/2017133657&ft =.pdf