Regional Dynamics and Social Diversity –
Portugal in the 21st Century
Teresa Ferreira Rodrigues
Introduction
hrough its history Portugal always presented regional differences concerning population distribution, as well as fertility and mortality trends. Local specificities related to life and death levels reflect diverse socioeconomic conditions and also different health coverage. We will try to diagnose the main concerns and future challenges related to those regional differences, using quantitative and qualitative data on demographic trends, well-being average levels and health services offer. We want to demonstrate that this kind of academic
researches can be useful to policy makers, helping them: (1) to implement regional
directed policies; (2) to reduce internal diversity; and (3) to improve quality of life
in the most excluded areas.
T
Our first issue consists in measuring the link between Portuguese modernization
and asymmetries on social well-being levels1. Today Portugal faces some
modera-tion on populamodera-tion growth rates, a total dependency on migramodera-tion rates, both exter-nal and interexter-nal, as well as aged structures. But natioexter-nal average numbers are totally different from those at a regional level, mainly if using non demographic indicators,
such as average living patterns or purchase power2.
The paper begins with a short diagnosis on the huge demographic and socioeco-nomic changes of the last decades. In the second part we analyze the extent of the link between those changes and regional convergence on well-being levels. Finally, we try to determine the extent of regional contrasts, their main causes and the rela-tionship between social change and local average wealth standards, as well as the main problems and challenges that will be under discussion in the years to come, in what concerns to health policies.
In practical terms we used two different databases and two specific methodologies. A first diagnosis is based on the results of a cluster analysis, crossing official
infor-mation from: i) population census for the years 1960, 1970, 1981, 1991, 2001 and
1 Veiga, 2004.
also 2005 estimations, all from National Statistical Institute3; and ii) vital
demo-graphic statistics on births, deaths and migrations from 1991 to 2007. The 278
Portuguese mainland municipalities4 were aggregated in five groups, according to
their specific demographic dynamics for the last decades (1960–2007).
On a second moment, a main component analysis was done, supported by
eco-nomic and social data at municipal level5. Besides including a few demographic
indicators, it mainly covers average health resources and services offer, income and
educational rates and other economic and social indicators. Using more than 92%
of all available variables (38 in 1993 and 54 in 2004)6, we created a statistical
indica-tor named “global indicaindica-tor of demographic, economic and social well-being”, that
sums up and allows stratification of all municipalities in all cases7. In a third
mo-ment, we cross-checked demographic dynamics with well-being results and tried to establish the interaction between them, in order to: i) fully understand the extent of the relationship between social change and social well-being levels; ii) relate them to health investment; and iii) evaluate the need to implement regional pointed out policies, which may reduce diversity between Portuguese social groups and geo-graphic regions.
Portugal: Long Term Facts and Trends
Portugal faced huge changes since mid 70’s, most visible in three main areas: a)
political changes, as it became a democratic regime in 1974 and an EU member
since 1986; b) economic changes, mainly related to a moderate industrialization
process and to an asymmetrical urban growth, (leading to coastal concentration, the rise of metropolitan areas and countryside desertification); c) relevant social changes, associated with a huge improvement on both average educational levels
3 Instituto Nacional de Estatística (INE).
4 Administrative units, corresponding to mainland Nuts IV and excluding Madeira and Azores islands, due to lack of partial information on well-being rates.
5 Provided by Marktest since 1993. We selected the first and latest series, 1993 and 2004
(Salex Index).
6 In 1993: 38 variables → 3 major components, Yk , k=1, 2, 3 (explain 94% of total inertia); In 2004: 54 variables → 4 major components, Yk , k=1,…, 4 (explain 92% of total inertia). Main Component 1993 2004 Y1 85% 81% Y2 6% 6% Y3 3% 3% Y4 ---- 2% 7 Chorão, Pereira, 2009.
and quality of life. Family structure and life style also suffered huge transforma-tions.
In the transition from the 20 th to the 21 st centuries the country faces the
chal-lenges and opportunities associated to those changes. They were followed by: (i) some moderation on demographic growth rates; (ii) the harmonization on life and death annual tolls; meaningful migrations to the coastal areas and urban centres;
high levels of life expectancy; ageing phenomenon. Nowadays, 80% of the country
presents negative natural population growth rates and ageing structures8. They are
explained by low fertility levels (less than 1,4 children per woman), the increase of
life expectancy (75,2 years for men and 81,6 for women)9 and by the existence of
75,000 more people aged 65 plus than those under 15 years old (15,6%/17.0%)
(Table 1)10
Table 1. Global Annual Demographic Trends (%).
Inter-census periods Natural Rate Total Rate Migration Rate
1960–1970 1.15 -0.21 -1.36
1970–1981 0.85 1.29 0.44
1981–1991 0.34 0.03 -0.31
1991–2001 0.08 0.45 0.37
2001–2007 0,03 0,37 0,34
Source: Estatísticas Demográficas, 1968, p. LXX, 1970–2001; Xº to XIVº Recen-seamento Geral da População Portuguesa, 1960 to 2001; Estimativas da População 31/XII/2005. A deeper analysis show us several ways of transition to modernity, which occurred
somehow later than in most European countries11. Those realities are only
consequential when analyzed at a regional level and when related to non demo-graphic indicators. We can therefore discuss if the country, that became spatially unequal in what concerns to human distribution, is or isn’t more homogeneous concerning quality of life and social well-being. This will allow us to understand the
real aim of contemporary social changes. For the selected years of 1900, 1950, 2001
and 2007, and using Population Census data, we calculated the relative proportion
of residents for all the existing NUTS III, in order to measure their evolution
dur-ing the 20th century.
8 Carrilho et al., 2007.
9 EUROSTAT, b) 2008.
10 In what refers to World’s ageing ratio, Portugal ranks 8th (PRB, 2009); EUROSTAT, a) 2008.
Map 1. Portuguese Regional Demographic Profile, 1900–2007.
Winning less
Winning
more Losing less
No trend
Losing more
Source: Rodrigues, 2001.
By the end of the 20th century Portugal can be considered a country divided in five
different groups of municipalities in terms of demographic cohesion.12 Map 1
pre-sents winning and loosing areas, in what concerns human concentration. Our
con-clusions are based on former research13, which measured at what extent
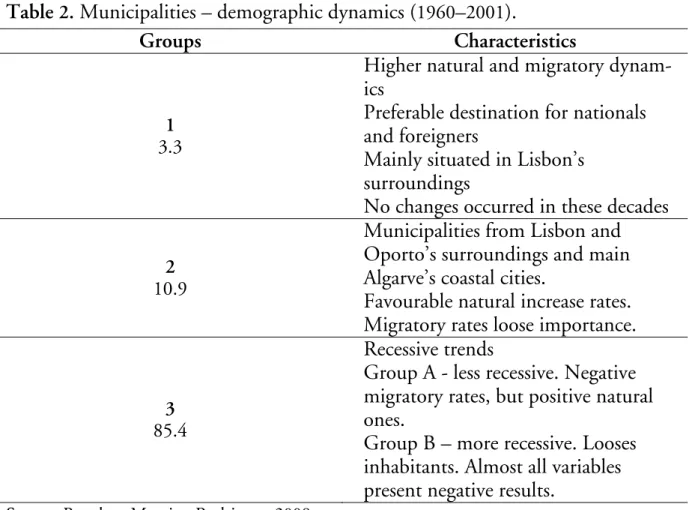
homogene-ous demographic behaviours where related to geographic situation. (Table 2) The
first group of municipalities reveals a positive situation, although it represents only
3.3% of the total. Their leadership is consistent: they grow faster than all the others,
benefiting from internal and external positive migratory rates; they possess the
higher active population rate and also the higher natural rates. Group 2,
represent-ing 11% of all municipalities, shows both natural and migratory medium rates,
although with positive demographic dynamics. But almost 86% of Portuguese
municipalities presented recessive behaviours for the concerned period. They lost inhabitants due to negative natural and migratory trends, with higher rates in the
60’s and in the 80’s.
12 Based on a cluster analysis, using “non hierarchic” criteria (K-means) (MAROCO,
2007).
Table 2. Municipalities – demographic dynamics (1960–2001).
Groups Characteristics
1
3.3
Higher natural and migratory dynam-ics
Preferable destination for nationals and foreigners
Mainly situated in Lisbon’s surroundings
No changes occurred in these decades
2
10.9
Municipalities from Lisbon and Oporto’s surroundings and main Algarve’s coastal cities.
Favourable natural increase rates. Migratory rates loose importance.
3
85.4
Recessive trends
Group A - less recessive. Negative migratory rates, but positive natural ones.
Group B – more recessive. Looses inhabitants. Almost all variables present negative results.
Source: Based on Moreira, Rodrigues, 2008.
Looking nowadays for a regional convergence…?
In the last decades regional differences are declining in what concerns to demo-graphic collective behaviours, but asymmetries on geodemo-graphic distribution are in-creasing, as well as the differences between socioeconomic groups. In order to evaluate the extent of these phenomena, we created a statistical index, which we believe is able to sum up and allow stratification for all administrative units. The
analysis by main components14 automatically sorted all 278 continental
municipali-ties15 by homogeneous groups and a ranking, according to their average
socioeco-nomic and development trends for the years 1993 and 2004. Our conclusions
fol-low those pointed by several national and international reports, although based in
different variables16. From 1993 to 2004 we observe a global negative slope on index
values, the emergence of a few rich and dynamic regions and an increase in regional differences. As it happens with population distribution, Portuguese economic and
14 Bouroche, Saporta, 2002.
15 It only refers to continental Portugal. There is no available data on the 30
municipalities of Madeira ans Azores.
social development model was built during the 20th century base based on coastal concentration of population, economic structures, urbanization and investment on goods and services, both from public and private sectors.
At the beginning of the 21st century, Portugal hasn’t yet assured the
homogeniza-tion as far as well-being standards are concerned. 17 (Table 3, Table 4, Map 2, Map
3, Map 4)
Table 3. Well-being Index by Municipalities: Homogeneous Groups in 1993.
Group Number Municipalities Well-being Index
1 1 Lisboa 2339.0
2 1 Porto 950.5
3 1 Loures 691.5
4 1 Sintra 584.7
5 1 Vila Nova de Gaia 518.0
6 5 Almada. Amadora. Cascais. Coimbra e Oeiras 385.1
7 3 Matosinhos. Braga e Guimarães 335.7
8 15
Aveiro. Barcelos. Barreiro. Gondomar. Leiria. Maia. Seixal. Santa Maria da Feira. Santo Tirso. Setúbal. Torres Vedras. Viana do Castelo. Vila Franca de Xira. V.N. de Famalicão e Viseu.
231.6
9 55
Abrantes. Águeda. Albufeira. Alcobaça. Alenquer. Amarante. Anadia. Beja. Bragança. Caldas da Rainha. Cantanhede. Castelo Branco. Chaves. Covilhã. Espinho. Estarreja. Évora. Fafe. Faro. Felgueiras. Figueira da Foz. Fundão. Guarda. Ílhavo. Lamego. Loulé. Lousada. Mafra. Marco de
Canavezes. Marinha Grande. Moita. Montijo. Olhão. Oliveira de Azeméis. Ourém. Ovar. Paços de Ferreira. Palmela. Paredes. Penafiel. Pombal. Ponte de Lima. Portalegre. Portimão. Póvoa de Varzim. Santarém. Santiago do Cacém. Seia. Silves. Tomar. Torres Novas. Valongo. Vila do Conde. Vila Real e Vila Verde
119.3
10 192 All the other municipalities of continental Portugal 49.2
Source: Chorão. Pereira. 2009.
17 This solution presents for both years a R2 = 0,993, which explains 99.3% of total variability, and a semi partial R2 = 0,0007. The results reflect the k-means application of gravidity centre to the 10 municipality groups identified by Ward’s method.
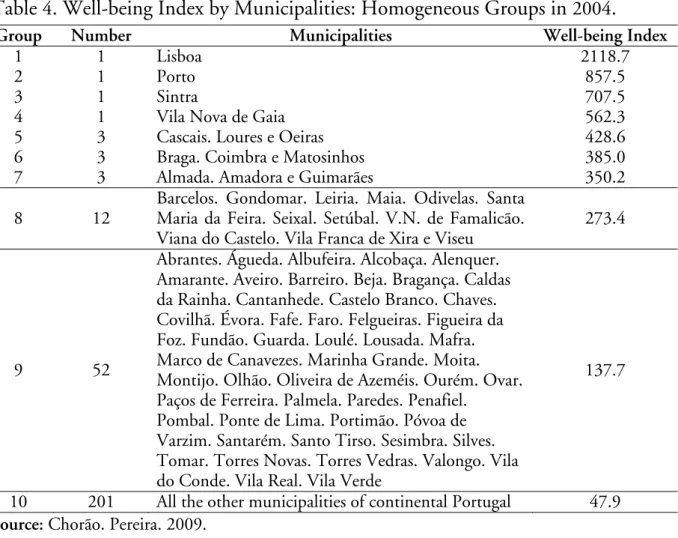
Table 4. Well-being Index by Municipalities: Homogeneous Groups in 2004.
Group Number Municipalities Well-being Index
1 1 Lisboa 2118.7
2 1 Porto 857.5
3 1 Sintra 707.5
4 1 Vila Nova de Gaia 562.3
5 3 Cascais. Loures e Oeiras 428.6
6 3 Braga. Coimbra e Matosinhos 385.0
7 3 Almada. Amadora e Guimarães 350.2
8 12
Barcelos. Gondomar. Leiria. Maia. Odivelas. Santa Maria da Feira. Seixal. Setúbal. V.N. de Famalicão. Viana do Castelo. Vila Franca de Xira e Viseu
273.4
9 52
Abrantes. Águeda. Albufeira. Alcobaça. Alenquer. Amarante. Aveiro. Barreiro. Beja. Bragança. Caldas da Rainha. Cantanhede. Castelo Branco. Chaves. Covilhã. Évora. Fafe. Faro. Felgueiras. Figueira da Foz. Fundão. Guarda. Loulé. Lousada. Mafra. Marco de Canavezes. Marinha Grande. Moita. Montijo. Olhão. Oliveira de Azeméis. Ourém. Ovar. Paços de Ferreira. Palmela. Paredes. Penafiel.
Pombal. Ponte de Lima. Portimão. Póvoa de Varzim. Santarém. Santo Tirso. Sesimbra. Silves. Tomar. Torres Novas. Torres Vedras. Valongo. Vila do Conde. Vila Real. Vila Verde
137.7
10 201 All the other municipalities of continental Portugal 47.9
Source: Chorão. Pereira. 2009.
In fact, the convergence on national demographic behaviours doesn’t reflect the homogenization on well-being standards. There is a clear coincidence between most positive/negative population variations and better/worse life standards. Demo-graphic trends, economic dynamics and public services offer are positively linked. Public services concentration is induced by central policies on education and health systems, as well as well-being infrastructures. This fact explains the reason why population tends to be increasingly concentrated in Lisbon (AML) and Oporto’s
(AMP) Metropolitan Areas18, as well as in the coastal regions. Six municipalities
represent 25% of all national purchase power: Lisbon, with 10.8%. followed by
Oporto (3.7%), Sintra (3.5%), Vila Nova de Gaia (2.6%), Cascais (2.4%) and
Oei-ras (2.0%).19 They all belong either to AML or AMP. Apart from the strongest eco
18 Áreas Metropolitanas: administrative units with some political autonomy, formed by several municipalities, which figures as a political intermediate structure, with some financial and administrative autonomy. AML (Área Metropolitana de Lisboa) includes 18 municipalities: Alcochete, Almada, Amadora, Barreiro, Cascais, Lisboa, Loures, Mafra, Moita, Montijo, Odivelas, Oeiras, Palmela, Seixal, Sesimbra, Setúbal, Sintra, Vila Franca de Xira. AMP (Área Metropolitana do Porto) includes 9 municipalities: Espinho, Gondomar, Maia, Matosinhos, Porto, Póvoa do Varzim, Valongo, Vila do Conde, vila Nova de Gaia (Fernandes, Alves, 2009).
Map 2. Portugal, 2002 Functional Marginalisation Index.
Source: OECD. 2008
nomic points, a few medium sized historical urban municipalities grow in the inner part of the country, attracting inhabitants and public and private investment (Beja, Évora, Castelo Branco, Guarda, Bragança).
Most of rural municipalities stand at the bottom in the ranking and are loosing more quality of life than all the others. There are a few cases of loss in terms of quality of life in urban municipalities, mainly in those ones near the two biggest cities - Lisbon and Oporto. A large part of the country faces problems in terms of
development, but that can be explained by the decrease of their “index of global
demographic, economic and social well-being” from 1993 to 2004. In those areas
the negative consequences of ageing structures are more noticeable.
At the beginning of this new century, the unbalance in terms of the spread of Portuguese population can be, to a large extent, explained by the scarce relationship between real needs and the offer of social resources.
A particular case study: national health system…
Portugal presents a human and social development model built upon the basis of population, economic, urbanization, goods and services concentration in the
Atlantic coast. As expected, the comparative reading of the results of 1993 and 2004
shows that Lisbon has the highest values of our well-being index. Oporto and its surrounding municipalities follows Lisbon in the rank of the regions with higher urban rates. We can confirm the there are differences between the coastal areas and all other Portuguese regions as far as the mainland is concerned. However we already saw that there are municipalities in the inner part of the country that pre-sent indexes of well-being similar to those of coastal regions; those municipalities really differ from many other depressed ones in the neighbourhood. One would like to know if that might be due to the quality of local health services. If we compare
our well-being index results with a health status indicator20, one concludes that
there are huge similarities between the two indicators, namely in what concerns to the inner municipalities, with a few exceptions for the most significant
urban/political and administrative units (Map 3). Those differences are nowadays
greater than they were ten years later, which means that the inequalities are far from
being solved. in what concerns to both health and quality of life services (Map 4).
20 Several authors have proved a strong association between poverty and low health status. This last concept includes the analysis of social and economic data and individual assumed perceptions (Santana, 2005).
Source: Chorão. Pereira. 2009; Santana. Vaz. Fachada. 2004
During the 90’s, the improvement regarding general well-being in Portugal. was
closely followed by the concentration of healthcare “best” services21. If we compare
data from Table 3 with data from Table 4, a few remarks call our attention. In
1991/1993, 52.3% of all administrative units had health levels well below national
average, mostly in rural and inner municipalities. Well-being rates were even more
concentrated, with a total of 76% below national average. But the “depressed
municipalities” represented less than 30% of national residents, in both cases. By
2001/2004, 65% of all administrative units present health levels below national
average (rural and inner country). By 2004, 73% of all municipalities stand below
national average, although depressed municipalities are more depressed than ever
and represent less than 25% of national residents. These municipalities loose
resi-dents and become at the same time less attractive to migration and to economic investment. i.e., they risk loosing quality of life and purchase power in the near
future. Less consuming standards lead to less population and. on a second step, to less public and political investment on infrastructures.
From 1991 to 2004 only 14 municipalities belonging to the non depressed areas
showed negative variations, both in well-being and health care indicators. The new emerging offer on health services tend to concentrate in the most populous areas, but some of these municipalities experienced, nevertheless, a deterioration of posi-tion in the well-being ranking. Life quality patterns risk to be affected by huge demographic growth rates, due to immigration, which lead to various problems, like the ones seen in the suburbs of Metropolitan Areas of Lisbon and Oporto (Fig-ure 1)22.
Figure 1. Portugal, Well-being and Health care investment.
Migration
Poverty/exclusion
Source: Author’s own elaboration.
We know that health status levels are influenced by local demographic structure and local economic and social average standards. Portuguese National Health Ser-vice seems unable to deal with regional specific needs and the same happens with private health care institutions. The problem lies in the lack of consistence between resident’s demographic and economic profile and health treatments specialized offer. Rural inner areas show higher elderly rates and a major dependency on public health services. as people living there have lower incomes. At the same time more and better health care options pop up in urban centres. It seems that those who can pay get a better health care, even in places where there seems to exist less quantity and quality of services. Only centralized policies can solve or reduce health care differential conditions, although adjusted to local specific realities.
22 Some of those municipalities loose their relative position from 1993 to 2004 (Moreira, Rodrigues, 2008).
U
Geographic homogenization is, therefore, far from being a reality in 21st century Portugal. The unbalance in terms of the spread of Portuguese population through-out the territory can be, to a large extent, explained by the insufficient relation between real needs and the offer of social resources (in which healthcare has the lead role).
Conclusion
The purpose of this study was to analyze to what extent changes in regional demo-graphic dynamics reflect and influence well-being average standards, using health status as an example of Portuguese lack of good practices on local policies.
Interna-tional reports, such as OECD’s Territorial Reviews: Portugal23, underline the risks
associated to diversity on economic and demographic dynamics, caused by different local capabilities to implement economic modernization. The focus is set on the urgency to implement regional differentiated policies, considered the best way to support endogenous dynamics of innovation and ensure sustainable development. Portuguese future social development will rely on a better distribution of structural investments, under the impulse of EU Cohesion Policy. Portugal is a good example of how new types of regional policies can contribute to national development, in a small, yet diverse, country, with weak population growth rates and limited public spending capability, marked by a long tradition of centralized governance and no elected political regional power.
Teresa Rodrigues is Ph.D and Associated Professor, Department of Political Studies, FCSH – Universidade Nova de Lisboa.
Acknowledgement
This article presents the main guidelines developed by the author in the PHOE-NIXTN CONFERENCE. Health and Welfare: diversity and convergence in policy and practice, held in the University of Athens – Building Kostis Palamas.
Akadi-mias. Athens 19–22 February 2009.
References
Carrilho, Maria José, Patrício, Lurdes. “A situação demográfica recente em
Portu-gal”. Revista de Estudos Demográficos 40 (2007) 39–75.
Chorão. L., Pereira. L. “Avaliação de qualidade de vida e bem-estar”. pp.129–151 in
T. Rodrigues (ed.). Regionalidade Demográfica e Diversidade Social. Porto,
2009.
EUROSTAT. a) EUROPOP2008 (EUROstat POpulation Projections 2008
-based). Convergence scenario, national and regional. 2008.
EUROSTAT. b) Statistics in Focus. 812008.
Fernandes, Olívia, Alves, Helena. “Regionalidades específicas – as Áreas
Metro-politanas de Lisboa e Porto, pp.153–210 in T. Rodrigues (ed.) Regionalidade
Demográfica e Diversidade Social. Porto, 2009.
INE. Sistema Urbano. Áreas de influência e marginalidade funcional. Lisboa, 2004.
Moreira, Maria J., Rodrigues, Teresa. As Regionalidades Demográficas no Portugal
Contemporâneo. CEPESE Working Paper, 2008
http://cepese.up.pt/principal.php?IDNivel=77.
OECD. OECD Territorial Reviews: Portugal, Paris, 2008
http://www.oecd.org/document/47/0.3343.en_2649_33735_41380591_1_1_1 _1.00.html.
PRB. World Population Data Sheet 2009. Population Reference Bureau.
Wash-ington, 2009 http://www.prb.org).
Rodrigues, Teresa. "Os factores de mudança no Portugal das regiões (séculos XIX a
XX)". Revista População e Sociedade. 7. Porto (2001) 173–193.
Rodrigues, Teresa. “Introdução”, pp.7–10 in T. Rodrigues (ed.). Regionalidade
Demográfica e Diversidade Social. Porto, 2009.
Rodrigues, T et al. Regionalidade Demográfica e Diversidade Social. Porto, 2009.
Santana, Paula. Geografias da Saúde e do Desenvolvimento. Evolução e Tendências
em Portugal. Coimbra, 2005.
Santana, Paula, Vaz e Fachada. "Estado de saúde dos Portugueses, uma perspectiva