S
EGMENTATION OF ONLINE BEHAVIOUR
THE WEBSITE&
THE SOCIAL NETWORKPetra Janna Elizabeth Slits
Dissertation submitted in partial fulfilment of requirements for the degree of International Master in Management at Universidade Católica Portuguesa
ADVISOR: Ana Isabel de Almeida Costa
A
BSTRACT
Effective marketing communication activities require companies to identify and target the right customer segments. This dissertation explores the potential of social network analysis as a tool for online behaviour segmentation. To this end, the patterns of user interactions in the Facebook page of a Portuguese company, alongside clickstream data from its website, were cluster analysed. The cluster analysis of the interaction patterns yielded four clusters, mainly based on differences in content of the posts on Facebook. These clusters were the Photo-fans, Route-lovers, Promo-people and Video-viewers. The SNA metrics were able to provide concrete insights to characterize these segments. The analysis of clickstream data also yielded four clusters: Prospect, Info Seekers, Curious and Scanners. These consumer segments differ in terms of search detail, which could be attributed to their relative level in the purchase process. A field study on the Facebook page was conducted to link the interaction patterns to the browsing behaviour on the website. For the content of the posts during this field study, the clickstream data of the website did not show substantial differences. This dissertation concludes by noting that SNA tools can be useful and provide insights for marketers that attempt to segment social network audiences. Also, the link between the behaviour of social network audience and website visitors potentially leads to useful and actionable insights.
3
S
UMÁRIO
As actividades de marketing eficazes requerem que as empresas sejam capazes de identificar e comunicar aos públicos alvo adequados. Esta dissertação explora o potencial da análise de redes sociais (SNA) como ferramenta de segmentação do comportamento digital. Para este fim, este estudo analisa em clusters os padrões de interacção entre utilizadores da página de Facebook de uma empresa portuguesa, juntamente com os dados das visitas ao website da empresa. A análise de clusters dos padrões de interacção resultou em quatro clusters baseados nas diferenças de conteúdo das publicações no Facebook. Este clusters foram denominados os “Fãs de fotografia”, “Amantes de rotas”, “Pessoas de promoção” e os “Visualizadores de vídeos”. As métricas de SNA forneceram uma visão concreta que caracterizasse estes segmentos. A análise dos dados das visitas ao website gerou também quatro clusters: “Pretendentes”, “Requerentes de informação”, “Curiosos” e os “Scanners”. Estes quatro segmentos diferem em termos de detalhe de pesquisa, o que pode ser atribuído ao seu nível relativo no processo de compra. Foi realizado um estudo de campo na página de Facebook para ligar os padrões de interacção com o comportamento de navegação no website. No caso do tipo de conteúdo publicado durante o estudo, os dados das visitas no website não variaram substancialmente. Esta dissertação conclui que as ferramentas de SNA podem ser úteis na segmentação de audiências nas redes sociais. Contudo, a ligação entre o comportamento nas redes sociais e o comportamento no website pode levar a insights úteis e práticos.
4
A
CKNOWLEDGEMENTS
By handing in this thesis my time as a full-time student will be over and that means that real life will start soon. Getting to this point has been quite a journey, in both the literal and the figurative way of speech. Luckily, I did not have to travel this long road alone. First of all, I would like to thank professor Ana Costa, who helped me finishing this document by sharing her profound knowledge on digital marketing, data analysis and statistical methods, but mostly for motivating me to make the best of this work. Also, I would like to thank Pedro Rosa from VAN for his support, explanations about social network analysis and providing the necessary data for writing this dissertation.
For her moral encouragement, I would like to thank my roommate and friend Elena; sing-along movies, take-away sushi and the occasional glass of wine made the last few months a lot more bearable. Also, thanks to the #umbrella-gang and the Fresh Thinkers: you guys made the entire master experience unforgettable. Adding to this, I would like to express my gratitude to my year club JC TOMTOM ‘Altijd van de kaart’- Bar, Chan, Chris, Eem, Han, Kiek, Ka, Lian, Maad, Nien, San, Suus and Viet - for being there whenever, wherever and however needed during my entire study.
Last but not least, I would like to take this opportunity to thank my family that despite of the distance, is always there for me. Thanks to my brother and sisters, Rob, Karin and Tanja, for inspiring me to be a fighter like you and thanks to my amazing parents, Jac and Liesbeth, who gave me the freedom to explore the world on my own and supported me by providing some real grown-up insights to see things from a different perspective.
5
T
ABLE OF CONTENTS
Abstract ... 2 Sumário ... 3 Acknowledgements ... 4 Table of contents ... 5 Table of figures ... 7 Table of tables ... 8 Table of appendices ... 9 1. Introduction ... 101.1 Background and Problem Statement ... 10
1.2 Aim and Scope ... 11
1.3 Research Methods ... 12
1.4 Relevance ... 13
1.5 Dissertation outline ... 13
2. Literature review & Conceptual framework ... 14
2.1 Segmentation ... 14
2.2 Segmentation of browsing behaviour ... 15
2.3 Social Networks ... 16
2.4 Social network sites ... 19
2.5 Conceptual framework ... 22 3. Methodology ... 23 3.1 Research method ... 23 3.2 Secondary data ... 23 3.2.1 Facebook ... 24 3.2.2 Website ... 25 3.3 Primary data ... 27
3.3.1 Social network site ... 27
3.3.2 Website ... 27
4. Results & Discussion ... 29
4.1 Network structure ... 29
6
4.2 Facebook segments ... 32
4.2.1 Discussion of the Facebook segments ... 33
4.3 Website segmentation ... 35
4.3.1 Discussion of the website segments ... 36
4.4 Field study ... 38
4.4.1 Discussion of the field study ... 40
5. Conclusions & Limitations ... 42
5.1 Conclusions ... 42
5.2 Limitations & Future research ... 44
References ... 45
7
T
ABLE OF FIGURES
Figure 1: Conceptual Framework ... 22 Figure 2: Network structure of the company’s Facebook page ... 29 Figure 3: Network structures for competitors 1, 2 and 3 ... 30
8
T
ABLE OF TABLES
Table 1: Post Categories and Descriptions ... 24
Table 2: Number of posts and interactions per category ... 25
Table 3: Number of interactions per post category ... 27
Table 4: Network metrics for the company and competitors ... 30
Table 5: Summary of Facebook segments ... 33
Table 6: Description of segments based on website behaviour ... 36
Table 7: Network metrics field study ... 39
Table 8: Comparison on network metrics ... 39
9
T
ABLE OF APPENDICES
A – Coding guide ... 50
B - 2-step cluster analysis of FB-users (SNA) ... 51
C - ANOVA & Tukey Post Hoc on FB-users ... 52
D - 2-step cluster analysis of website users ... 53
E - Box plots 2-step cluster analysis of website users ... 54
F - Crosstabs on clusters website users ... 55
G - T-test for comparison SNA metrics field study ... 56
H - T-test for comparisons entry page field study ... 57
10
1.
I
NTRODUCTION
1.1
B
ACKGROUND ANDP
ROBLEMS
TATEMENTIn a world where viral videos set the agenda for news and ordering groceries online is becoming a common thing, marketers are looking for the online places where they can find consumers, in an attempt to learn who these consumers are, what they are doing and how they can be convinced to make a purchase. Among the channels that marketers use frequently these days are social network sites (SNS) (Ngai, Tao, & Moon, 2015). These sites are built on user profiles, user generated content and connections between users (Ellison, Vitak, Gray, & Lampe, 2014; Heinonen, 2011; Mislove, Marcon, Gummadi, Druschel, & Bhattacharjee, 2007). Companies can also partake in these social networks and use them as a marketing channel, for instance to advertise, deliver branded content or manage customer relationships (He, Zha, & Li, 2013).
Facebook is one of the largest social network sites in the world and becoming an important place for marketing activities. The main advantage of using Facebook as a marketing channel is the accuracy of audiences it can address. As Facebook is built on profiles with demographic information, interests and connections, it is possible to select specific audiences for specific marketing messages (Facebook, 2016). Nevertheless, Facebook also selects the content that users see on their News Feeds by implementing an algorithm that determines which content is pushed forward and which content will not be shown (Widman, n.d.). In that sense, companies hoping for organic reach will have to deliver content that resonates highly with the interests of their audience, or they might end up getting the same visibility as a website that ends up on the third page of results of a Google-search.
So what if an algorithm already handles demographic and psychographic factors for selecting an audience? Then, there is the opportunity to analyse their behaviour in detail and segment users into consumer groups accordingly (Kotler & Armstrong, 2012). Using behavioural factors for segmentation has the advantage that behaviour is observed and therefore it is closer to reality than what people might say about their preferences and interests. Mainly, there are two approaches for doing behavioural segmentation online; one is to analyse online browsing behaviour on websites such as online e-stores or other websites with content provided by companies, while the other one is to examine the interaction patterns on social network sites such as Facebook (Campbell, Ferraro, & Sands, 2014).
11 Due to the growing number of e-commerce sites, browsing and shopping behaviour data is becoming more accessible, allowing researchers and marketers to classify consumers based on that behaviour (Benevenuto & Rodrigues, 2009; Wu & Chou, 2011). On the other hand, in order to analyse the interaction patterns researchers and marketers can use Social Network Analysis (SNA) tools, which focus on studying the relationships between the interacting elements in a network (Trusov, Bodapati, & Bucklin, 2010). Social networks and their members can vary widely from one another based on the amount of people connected, what type of content they consume or share, and how the information flows through the network (Trusov et al., 2010). SNA tools can be used to find these patterns and highlight the most effective ways to reach consumers.
The problem that arises with marketing activities online, and particularly on social network sites, is that it is difficult to find the right users to target. And even when companies are able to select a target segment based on demographic and psychographic variables, the algorithms on social network sites might interfere with reaching the selected audience. That is why marketers are looking for other variables, such as the behavioural variables or interaction patterns, to include in their segmentation of online audiences. Studies have already used the activity level of a user on social networks or their reactivity to marketing messages on those sites in order to find segments and discover the most influential users in a network (Campbell et al., 2014; Trusov et al., 2010). Nevertheless, those studies only considered the audiences on social network sites, without linking them to the visitors of (branded) websites.
1.2
A
IM ANDS
COPEThis dissertation seeks to explore the potential of social network analysis as a tool for segmentation of interaction patterns on social network sites and relate this to browsing behaviour on websites. In order to achieve this, the following research questions are posed:
1. Can audiences on SNS be meaningfully segmented by analysing patterns of user interaction with branded content? How can SNA tools enable this?
2. To what extent do these segments match those identified based on browsing behaviour on a branded website?
3. Is it possible to predict specific browsing behaviour on the website based on interaction patterns observed on SNS?
12 These research questions will be answered by analysing data that was made available by VAN, a marketing agency based in Lisbon. Both the analyses of the online browsing behaviour and the user interaction patterns were conducted based on the website and branded Facebook page of the same client company. This company offers unique flying experiences by helicopter over the city of Lisbon and surroundings. It addresses the Portuguese and tourist market with a geographical focus on Lisbon. The website has both a Portuguese and English version, which are identical except for the language, however the communication messages on their social media channels are exclusively written in Portuguese. The main channel for marketing messages is the Facebook page of the company, where they use mostly organic posts to provide information to their fans about new flying routes, unique offers or special events. Other than the Facebook page, the company has an Instagram profile that is used to posts pictures of the flying experiences and landscapes around Lisbon.
1.3
R
ESEARCHM
ETHODSThis dissertation essentially undertook a descriptive approach, because it attempted to divide the consumer market of a company into targetable segments and characterize these segments. To this end, secondary data from the company’s website and Facebook page was analysed first. The dataset resulting from Facebook entailed the extraction of the entire user network based on the interaction between users and branded content between January 1st
and March 31st
2016. The dataset resulting from the website behaviour entailed the analysis of the clickstreams of visitors during a week without any specific marketing activity on social media channels (18-24th of April 2016). The primary data based on a field study was also extracted
from both the branded Facebook page and the company website after running a campaign with branded content on Facebook during one week (2nd
– 8th
of May 2016).
The extraction and analysis of the Facebook user network of the company required the use of two types of software: Gephi and NodeXL. NodeXL is a plugin for Microsoft Excel that can extract and analyse social networks by creating separate worksheets for the network members and the connections between them (The Social Media Research Foundation, 2016). Gephi is a program that can process files created by programs such as NodeXL and visualise the network structure (Gephi.org, 2016). In addition, Gephi calculates specific network metrics, which can be added to an Excel-file for further analysis.
13 To extract the data about the behaviour on the website, a tracker was installed on the site to record the actions of visitors. The tracker used for the recordings is called Hotjar and it has the ability to show all the clicks, pages and mouse movements from the visitors (Hotjar Ltd., n.d.). In addition, it provided information about time and date of the visit, the device used and location (county) from the visitor.
The statistical methods used for the segmentation and further analysis of the segments were Two-step cluster analysis, Analysis of Variance (ANOVA), Mahalanobis outlier analysis, T-tests and crosstabs with Chi Square tests. All these tests are done with the statistical IBM program SPSS.
1.4
R
ELEVANCEThis thesis delivers an application of segmentation based on the online behaviour of consumers and hence provides fresh insights on the browsing behaviour on a website as well as the interaction patterns on SNS. The segmentation allows marketers to precisely target audiences based on the differences in their online behaviour, which will make their websites and campaigns more efficient. Next to that, SNA can contribute to a better understanding about the diffusion of information shared by the company in its network. Marketing managers can use such information to spread their messages quicker and in a more efficient manner (Trusov et al., 2010). In addition, this thesis bridges the two fields of academic studies, which are becoming more and more entangled because of the popularity of SNS (both among individual users and companies). With that, this dissertation contributes to the literature on social network analysis and to the marketing literature on segmentation of online audiences. In SNA studies, this one is unique becuase it looks at the members of the network at an individual level, which is not common. For the segmentation of online audiences, this dissertation adds to the research that uses other differentiating variables than demographics and psychographics.
1.5
D
ISSERTATION OUTLINEChapter 2 reviews existing literature on market segmentation, browsing behaviour, SNA and SNS and ends with the conceptual framework that guides the empirical study. Chapter 3 presents the research approach and method, while chapter 4 reports and discusses the main results obtained. Finally, chapter 5 draws the main conclusions of this dissertation and its implications to marketing research and practice and discusses its potential limitations.
14
2.
L
ITERATURE REVIEW
&
C
ONCEPTUAL FRAMEWORK
2.1
S
EGMENTATIONMarketing is an essential part of corporate strategy in consumer industries. Its main task is to help companies and brands sell products. Nevertheless, companies cannot sell to all consumers in diverse markets. To be able to reach specific consumers with the right message to promote a product, marketers should first divide the market into groups of consumers with similar profile and demand for a product category. This is part of the Segmentation, Targeting and Positioning processes, which are often executed by marketers with the ultimate goal of defining and adapting offers to different markets (Kotler & Keller, 2012). The essence of segmentation is to divide a large and diverse market into small and uniform markets, based on variances in consumer needs in order to gain higher customer satisfaction (Kotler & Armstrong, 2012; Smith, 1956). Moreover, segmentation is a fundamental strategy for marketers who want to understand the differences among consumers and with that better target and position products (Campbell et al., 2014). Segmentation is often based on demographic, psychographic or behavioural data (Hamka, Bouwman, de Reuver, & Kroesen, 2014; Kotler & Armstrong, 2012). Demographic and psychographic segmentation use descriptive information about the consumers and their lifestyles, while behavioural segmentation uses the conduct of consumers while purchasing a product to differentiate between groups of people (Hamka et al., 2014). This helps marketers to better understand the patterns of interaction and behaviour involved in a purchase process (Aggarwal & Mangat, 2015; Liu, Li, Peng, Lv, & Zhang, 2015; Wu & Chou, 2011).
Broadly, there are two approaches to segment consumers based on their online behaviour; one based on web browsing and another on interactions between users (Campbell et al., 2014). The data used for the segmentation analysis of web browsing is built on the navigation patterns of visitors of websites. When these patterns are combined with demographic or other characterizing data, marketers can effectively adapt the (online) advertising to those customer groups (Lambrecht & Tucker, 2013). When marketers segment based on online interactions, they mostly use data from social platforms on which consumers are allowed to express themselves (Campbell et al., 2014). The members of online communities have specific consumption and contribution patterns that can be used by community managers for several purposes such as segmentation (Campbell et al., 2014;
15 Trusov et al., 2010). Likewise, users that have influence on the behaviour of other users via their interactions or contributions to the platform, can be identified and recruited as brand ambassadors or product advocates (Campbell et al., 2014; Cho, Wang, & Lee, 2012; Trusov et al., 2010).
2.2
S
EGMENTATION OF BROWSING BEHAVIOUROnline consumer behaviour has become a topic of interest for both researchers and marketers because understanding this behaviour might help improve websites, offer innovative consumer insights or provide data for segmentation (Benevenuto & Rodrigues, 2009). Additionally, it provides information about the visitors of a website, which for example directly influences the price of the advertising space on the site (Benevenuto & Rodrigues, 2009; Trusov et al., 2010). Furthermore, it can help create response models for more efficient retargeting campaigns, to reduce the costs and increase revenues (Benevenuto & Rodrigues, 2009; Chen et al., 2015). These campaigns are based on the installation of a tracker and cookie in the web browser of the consumer, with the goal of presenting highly targeted ads in other platforms. The ads are adapted to the behaviour on previously visited websites (Lambrecht & Tucker, 2013).
Website browsing behaviour is typically recorded as clickstream data. These datasets can contain information about the actions of visitors on a website from the moment they enter until they leave the site, such as the number of site pages visited, the navigation sequence or the time spent per visit (Aggarwal & Mangat, 2015; Olbrich & Holsing, 2011). In addition, it is possible to follow the consumer while still on the website (internal), but also when the consumer ended the session on the site (external) and in this way learn about the logistics of the site or the click-through patterns outside the website (Lambrecht & Tucker, 2013). Clickstream data can be turned into powerful knowledge, enabling predictions about possible purchases of visitors on a particular website. For example, in her study on an e-commerce site, Moe (2003) found four different consumer clusters that predict the likelihood of purchasing a product. These are goal-directed buyers, hedonic browsers, search/deliberation and knowledge builders. They are based on previous literature and confirmed by a cluster analysis on variables such as the time spent per page visited, the count of product, informational and search result pages, the number of pages per level (category, brand or product), and the repetition count per page (Moe, 2003). In another research, Olbrich and Holsing (2011) relate the time spent on the website, the time spent on a specific page and the
16 frequency of looking at product details to likelihood that a visitor will buy a product.
In addition to predicting possible purchases, segmentation of online audiences can provide strategic insights on the most appropriate marketing messages for specific purposes. In their study, Liu and colleagues (2015) segmented the customers of an ecommerce site based on the price level of the product they bought, the degree of trust in the seller, the reviews of other buyers of the product, the frequency of adding a product to a basket of ‘favourites’ and the duration of the purchase process. They found six different groups of consumers and tested three promotion strategies on them to see which group responded the best to each advertisement. These groups are economical purchasers, active-star purchasers, direct purchasers, high-loyalty purchasers, risk-averse purchasers and credibility-first purchasers. The promotional strategies used were a discount promotion, advertising and word-of-mouth. The results show that discount promotion work best for the economically sensitive group, the direct purchaser group responds best to advertising, while word-of-mouth works best with the consumer group that is most active in contributing to consumer reviews themselves (Liu et al., 2015). These results show that via segmentation and testing different promotional material, marketers can derive useful implications for their overall marketing strategies.
Possibilities for gathering clickstream data are only limited to the technical boundaries of the website or tracker in question. Data can be collected on many different variables, such as the order of pages visited, the common navigation sequences (or paths) used by visitors, the results of these sequences (in other words: was there a conversion?), the activity level at a specific time, the number of pages visited, the time spent on each of them and the page that was referring to the website (Aggarwal & Mangat, 2015). All these variables are recordings of the actions of visitors on a website, so they can be used for behavioural segmentation analysis.
2.3
S
OCIALN
ETWORKSAnother way to segment consumers based on their online behaviour is by looking at their interaction patterns with other users or online content. This involves the analysis of social networks, a topic that has been studied by researchers before, both online and offline.
Networks exist in countless shapes and sizes. On a basic level all networks have the ability to connect otherwise separated units. In social networks, the units are actors, also
17 called nodes or entities (Borgatti, Everett, & Jonshon, 2013; Cho, Wang, & Lee, 2012; Merchant, 2012). Nodes can be people, companies, institutions or countries that interact with each other and that are connected based on their interrelationships (Borgatti et al., 2013; Merchant, 2012). A node can have several different connections, called ties, to other nodes that underline the nature of their relationships (Borgatti et al., 2013; Merchant, 2012). Both the type of actor and type of connection define the flow of communication or interactions within the network, also called diffusion pattern (Borgatti et al., 2013; Cho et al., 2012; Merchant, 2012). The diffusion pattern highlights the position of an actor in the network and with that, the access to information (Cho et al., 2012). Though, not only the position of nodes in the network influences the access to information, also the strength of the ties, or intimacy, between the nodes regulates the interactions (Burt, Kilduff, & Tasselli, 2013; Cho et al., 2012).
In SNA, there is a distinction between weak and strong ties between nodes (Burt et al., 2013; Cho et al., 2012; Ngai et al., 2015; Trusov et al., 2010). When nodes are people, strong ties can be seen between family members, good friends or others they are (geographically) close to, with whom they have a large number of interactions and where there is mutual trust (Cho et al., 2012; Ellison et al., 2014; Merchant, 2012). The existence of strong ties requires actors to invest in the maintenance of relationships (Cho et al., 2012). On the other hand, weak ties reflect the connections that are not as significant in daily life, such as the supermarket cashier, friends of friends or acquaintances that live far away and thus people do not invest much time in these relationships (Cho et al., 2012; Ellison et al., 2014).
2.3.1STRUCTURES AND INFLUENCERS IN SOCIAL NETWORKS
The connections that are created through interactions between actors form the basis of social network analysis (Trusov et al., 2010). Such analysis is useful for marketers because social networks can be seen as structures of diffusion or channels of distribution for marketing messages (Burt et al., 2013). The organization of the network and the flow of information in it determine for the speed, reach and impact of such messages (Burt et al., 2013; Ellison et al., 2014).
Actors can have two kinds of roles in social networks: bonding (closure) or bridging (brokerage) (Burt et al., 2013; Ellison et al., 2014; Katona, Zubcsek, & Sarvary, 2011). Bonding actors (re-) enforce the ties between a specific subgroup in the network and make
18 this group even more cohesive, while bridging actors are in the middle of (several) subgroups and connect different parts of the entire social network (Burt et al., 2013; Ellison et al., 2014; Katona et al., 2011). Both roles enhance the acceleration of information diffusion inside the network and increase the occurrence of passing along information compared to flows outside of the network (Burt et al., 2013).
Due to the ease and frequency of interactions and the relatively stronger ties among bonding actors, the group that is closest to these actors is called the ‘referral group’ and has such an effect on its members that they develop similar beliefs, attitudes and behaviours (Cho et al., 2012; Ngai et al., 2015; Trusov et al., 2010). Next to the referral group, there can also be specific individuals that have influence on other members in their networks in ways that those adapt their attitudes, behaviours or beliefs according to the influencer (Cho et al., 2012; Trusov et al., 2010). The potential influence of an actor can be inferred from the location in the network, based on the corresponding ties and interactions (Trusov et al., 2010). Members in the network with the most influence are called opinion leaders and can be seen as the bridging nodes in a social network; they connect different groups in the network and have a certain control of which information flows to what group (Cho et al., 2012; Katona et al., 2011; Kotler & Keller, 2012; Trusov et al., 2010). Because of the catalysing effect of opinion leaders on the diffusion of information and innovations in the network, opinion leaders can help companies or brands to influence the other members in the network (Aral & Walker, 2012; He et al., 2013; Heinonen, 2011).
2.3.2SOCIAL NETWORK ANALYSIS
There are two different levels of analysis of social networks. First, a network can be analysed as a whole, looking at the structure and diffusion characteristics. Secondly, a network can be analysed based on the individual node level, looking at their specific location and connections (Burt et al., 2013). In offline social networks, the accomplishments of the group are normally taken as a whole, while in online networks, the contribution of each group member can be traced (Burt et al., 2013).
On the network level, several characteristics can be assessed, like the network diameter or shortest path length, average path length, density and average degree are metrics that can be used to characterize the network (Borgatti et al., 2013). The diameter measures the longest path between nodes in the network, so how many steps to cross from one side of the
19 network to another (Borgatti et al., 2013; Mislove et al., 2007). The average path length counts the average amount of steps a piece of information should travel for reaching the other end of the network. Density measures the total number of connections in the network relative to the maximum amount of connections possible, whereas average degree stands for the average number of connections of nodes (Borgatti et al., 2013; Lewis, Kaufman, Gonzalez, Wimmer, & Christakis, 2008).
Degree can also be defined at node level, as well as several measures of centrality. Centrality relates to the location and relative power of the node in the network (Hanneman & Riddle, 2005). Three relevant measures of centrality are closeness, betweenness and eigenvector centrality. Closeness centrality assesses the speed of information diffusion at the node (Borgatti, 2005; Hanneman & Riddle, 2005). Moreover, it explains how close a member is to others and how fast the information will be shared between them. It is measured by calculating the distances between a node and its adjacent neighbours and when this distance is low, the speed of flow is high because the nodes are closer (Borgatti, 2005). The betweenness centrality shows the control that a specific node has over the flow if information (Hanneman & Riddle, 2005; Lewis et al., 2008). The control of information shows how often a member of the network is involved in the shortest path for information to travel; which implies that nodes at the centre have lower control than nodes at the edges of the networks, or nodes that are between subgroups within the networks, because there are more options for a different path in the middle (Borgatti, 2005). High betweenness centrality can therefore signal bridging nodes. When a node has a high control over information, it means that the number of shortest paths passing through the node is higher than through other nodes. Lastly, the influence of the member of a network is based on its so-called eigenvector, which calculates the risk of being affected by others based on the eigenvectors of adjacent members of the network. The higher the eigenvector of the surrounding nodes, the higher the eigenvector of the node itself (Borgatti, 2005; Hanneman & Riddle, 2005).
2.4
S
OCIAL NETWORK SITESSocial network sites are online social media platforms that are constructed of user profiles, built on content that is created by these users (User Generated Content) and allows for interactions between the users (Heinonen, 2011; Mislove, Marcon, Gummadi, Druschel, & Bhattacharjee, 2007; Ngai et al., 2015). The sites enable the formation of networks around individuals or groups of individuals, who publicly show their relationships with each other as
20 well as the interactions between them (Ellison et al., 2014; Merchant, 2012). The networks created by users serve several purposes, such as preserving relationships previously formed, offering sense of belonging by providing access to groups of people with similar interests, granting continuous access to existing information or creating and distributing content (Mislove et al., 2007; Ngai et al., 2015). For some SNS, the networks mainly represent the connections people already had offline, while others essentially enhance the possibilities to create new ties (Lewis et al., 2012; Merchant, 2012; Mislove et al., 2007). In either case, SNS allow people to have relationships with others, regardless of their location in the world (Ngai et al., 2015), establishing the so-called ‘glocalised’ communities (Merchant, 2012).
2.4.1FACEBOOK
Facebook is one of the most popular SNS in the world, having ca. 1.5 billion users that logged in at least once a month in the last quarter of 2015 (Statista, 2016). The site allows users to connect to others via ‘friendships’ that can represent any kind of tie that people might have in real world situations (Lewis, Gonzalez, & Kaufman, 2012). Therefore, it is not possible to distinguish between strong and weak ties on Facebook, which means that in SNA it is most common to consider all Facebook friends connections as weak ties (Ellison et al., 2014; Lewis et al., 2012). Even though Facebook is reliant on users to connect and create networks, its business model is based on advertising. Facebook offers many options for companies to launch campaigns, either paid or organic (Facebook, 2016).
The content displayed on a Facebook user’s page is called the News Feed. It shows posts placed or created by friends and other connected elements in the network (Bakshy, Messing, & Adamic, 2015). In addition, it can show paid marketing messages from companies that a user is not (yet) connected to. These messages can be either advertisements or boosted posts. Like traditional communication channels, Facebook is increasingly acting as a gatekeeper for information as the content presented to a user is based on an algorithm embedded in the platform (Bakshy et al., 2015; Widman, n.d.). This algorithm is built on three variables; affinity, weight and time. Affinity measures the goodness of fit of a piece of content to a particular user. Weight measures the importance of previous interactions between the user and similar pieces, while time measures the degree of novelty of the content. (Widman, n.d.). It is important to realize that Facebook also uses an algorithm like this when companies are trying to reach consumers on their News Feeds with paid content.
21
2.4.2MARKETING ON SOCIAL NETWORK SITES
There are many opportunities for companies and brands to tap into large SNS audiences such as Facebook. Not only does it offer various options for highly targeted advertising campaigns, it can also be a tool for branding, content delivery or customer relationship management (He et al., 2013; Kotler & Keller, 2012). Facebook allows brands and companies to set up fan pages that look relatively similar to user profiles and become part of consumers’ social networks. Since consumers typically put more trust in the information that flows in their personal networks than on traditional advertising, this may have a positive impact on the attitudes towards, or even purchase intentions for a specific brand or product (Chen, Fan, & Sun, 2015; Gunawan & Huarng, 2015; Mislove et al., 2007; Ngai et al., 2015). Another advantage of marketing on SNS is the amplification effect caused by the network structure, which can massively increase the reach of a message when users engage with it. (Kozinets, Valck, Wojnicki, & Wilner, 2010). Amplification occurs as a result of electronic word-of-mouth (e-WOM) communication between consumers, also known as Social Contagion (De Vries, Gensler, & Leeflang, 2012; Libai et al., 2010). In this way, consumers influence each other by talking about and engaging with the branded content (Kotler & Keller, 2012; Kozinets et al., 2010). However word-of-mouth normally is a natural process, the company can facilitate it and implement specific marketing techniques to intentionally trigger the communication flows among consumers (Kotler & Keller, 2012; Kozinets et al., 2010).
Depending on the social media strategy of a company, it can use different approaches to marketing on SNS. Word-of-mouth marketing is an example of earned media that serves awareness raising objectives. It is based on social engagement of consumers and not directly paid for (Campbell et al., 2014; Kotler & Keller, 2012). Other techniques for marketing on SNS are directly paid for, such as advertising or boosted posts, which are posts that look like organic content even though they are sponsored. Paid media can also increase awareness or generate leads and conversions on the branded website. A website is an example of owned media, because the company has full control over it (Kotler & Keller, 2012). The performance of all these techniques can be measured by setting goals for specific metrics, or key performance indicators (KPI’s). In that way, the company can see which of their techniques yields the best results to comply with their social media strategy.
22
2.5
C
ONCEPTUAL FRAMEWORKConsidering the two approaches for online behavioural segmentation, there are substantial differences to be found. Nevertheless, a company could use both in order to find behavioural segments of the consumers that are exposed to branded content. The segments can be formed on the basis of browsing behaviour on websites, for which companies can analyse the clickstreams of visitors. Next to that, companies can use the interactions on SNS to define different behavioural groups. This interaction between company content and users can be extracted and analysed by using SNA techniques. Both these methods lead to insights that can improve the website or communication messages on SNS and identify consumer segments for marketers to more precisely target with specific offers. This conceptual framework is summarized in Figure 1.
23
3.
M
ETHODOLOGY
3.1
R
ESEARCH METHODThe approach used for this dissertation is a descriptive one because it defines behavioural consumer segments of an online audience. To find and characterize these segments, secondary data was analysed first. This data came from both the website of the company and the Facebook page of the company. Several programs were used for the extraction of the online data, which are NodeXL, Gephi, Hotjar and Microsoft Excel. Part of the analysis was done with Gephi, while the statistical analysis was executed in IBM SPSS. Next to analysing secondary data, primary data was collected during a field study. The field study was conducted in order to bridge and test the outcomes of the secondary data analysis. The field study was designed as an online campaign on the Facebook page of the company, which contained posts that directed the user from Facebook to a specific page on the website. In this way, the behavioural data collected from the website could be assumed to come from the same audience as the behavioural data from the Facebook page.
3.2
S
ECONDARY DATAThe dataset created by the interactions between users and branded posts on the Facebook page of the company recorded the interactions between January 1st
and March 31st
2016. An interaction between a user and post means that the user liked, shared or commented to the post. The data was extracted by using NodeXL, which provides this data in an Excel file with several sheets that take out the essence of the network. The two sheets taken into consideration were the sheet with a list of interactions between posts and users and the sheet with a list of the users and posts and additional information, such as the content of the comments or the link to the posts. Gephi was used visualise the structure of the network and to add SNA metrics to the sheet with the information about the users in order to analyse this later in SPSS. In addition to the extraction of interactions between posts and users of the company’s branded page, the same was done for three competitors of the company. This creates a benchmark for the company to see how the interactions were for other branded pages over the same period in time. The competitors were chosen based on the nature of their service, addressing both the touristic and Portuguese market around Lisbon and on the Facebook page popularity (number of likes) and activity (number of posts per week).
24 The dataset created by tracking website behaviour of visitors involved coding the recordings from the tracker Hotjar and directly creating an SPSS file. The data was collected during a week without any specific marketing activity on the social media channels of company (18th
until 24th
of April 2016). Hotjar only records when it is explicitly set to record, which is the main reason for having less extensive data on the website behaviour.
3.2.1FACEBOOK
The dataset with interactions from Facebook contained 45 posts that were uploaded by the company during the first trimester of 2016. These posts included promotions related to special occasions such as Valentine’s Day and Father’s Day. Furthermore, 884 users interacted with these posts, resulting in the extraction of a network with 929 nodes in total. The number of interactions (ties) between the nodes was 1821.
In order to prepare the dataset for further analysis in SPSS, SNA metrics were added, the posts were categorized based on content and the interactions between users and a these post categories were counted. The SNA metrics added to the dataset were the degree per node and the centrality measures per node (closeness, betweenness and eigenvector). The categorization of the posts can be found in Table 1. For all users in the network, it was marked whether they interacted with a post of a certain category or not, creating eight dummy variables.
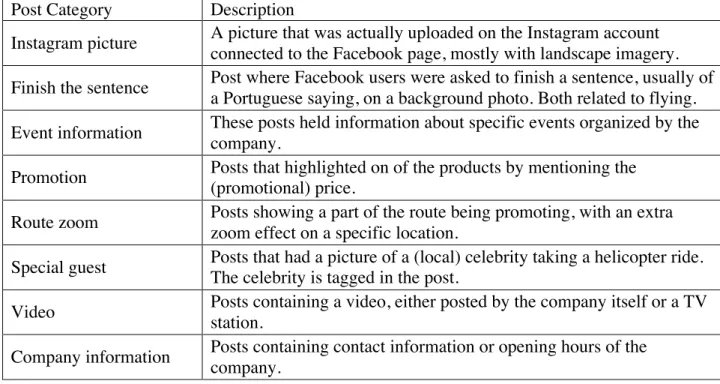
Table 1: Post Categories and Descriptions
Post Category Description
Instagram picture A picture that was actually uploaded on the Instagram account connected to the Facebook page, mostly with landscape imagery. Finish the sentence Post where Facebook users were asked to finish a sentence, usually of
a Portuguese saying, on a background photo. Both related to flying. Event information These posts held information about specific events organized by the
company.
Promotion Posts that highlighted on of the products by mentioning the (promotional) price.
Route zoom Posts showing a part of the route being promoting, with an extra zoom effect on a specific location.
Special guest Posts that had a picture of a (local) celebrity taking a helicopter ride. The celebrity is tagged in the post.
Video Posts containing a video, either posted by the company itself or a TV station.
Company information Posts containing contact information or opening hours of the company.
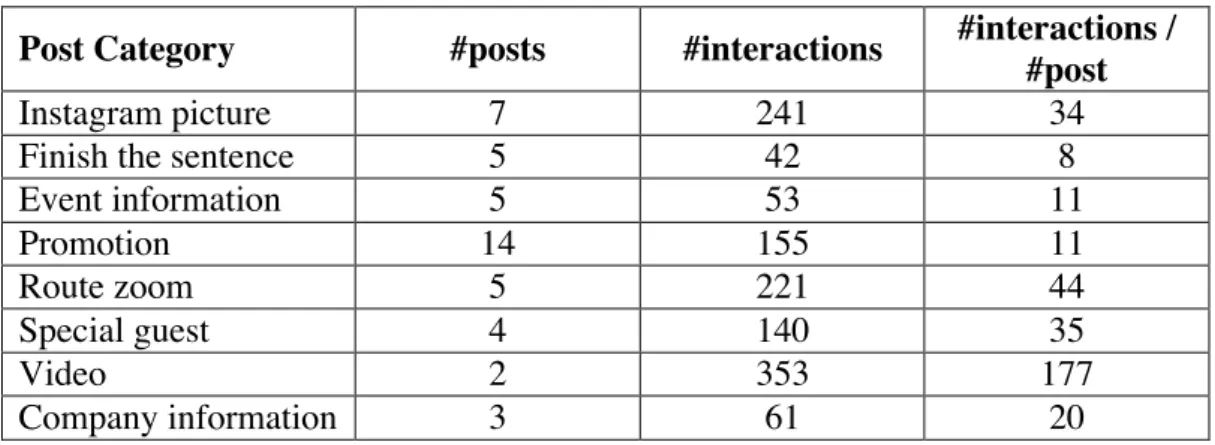
25 Table 2 presents an overview of the number of posts per category, the total number of interactions and the average number of interactions per post category. Over the three months considered, most posts concerned promotions (14 posts), followed by the Instagram posts (7 posts, whereas the videos were the most interactive content, in spite of being just two. The posts that zoomed-in on the routes were also reasonably interactive, with 44 interactions on average.
Table 2: Number of posts and interactions per category
Post Category #posts #interactions #interactions / #post
Instagram picture 7 241 34
Finish the sentence 5 42 8
Event information 5 53 11 Promotion 14 155 11 Route zoom 5 221 44 Special guest 4 140 35 Video 2 353 177 Company information 3 61 20
A two-step cluster analysis (with noise handling of 25%) was used to identify the segments based on node interaction patterns. The two-step cluster analysis has the ability to handle categorical variables such as the dummy variables created to measure the interaction level of each post (Hair, Black, & Babin, 2010). In addition to the segmentation based on behaviour, the SNA metrics added (degree and centrality measures) were used to characterise the segments based on their location in the network. An ANOVA and post-hoc tests (Tukey) assessed the differences between the segments created for these metrics.
3.2.2WEBSITE
The website of the company consists of several elements such as a homepage, side menu that can be used for navigation over the site and contact or reservation forms. From the homepage there is direct access to the pages with the different routes and via the side menu, visitors can access the routes and experiences pages, the ‘about us’ section, the VIP, event and business services and the contact and reservation forms. The routes and experience pages show several pictures, short explanations of the product (the experience) and the price.
The dataset containing the clickstreams of the website visitors entailed 175 observations. The smallest number of valid visits recorded on a weekday was 25; hence the same number of visits was held constant along the remaining weeks. The minimum time spent
26 on the website was set to 20 seconds to prevent coding accidental clicks or robot clicks. Also, there were some visits from the website developer to fix a bug regarding the responsiveness to tablet-size screens. These were excluded from the dataset by not considering visits in which one of the actions was changing the size of the screen.
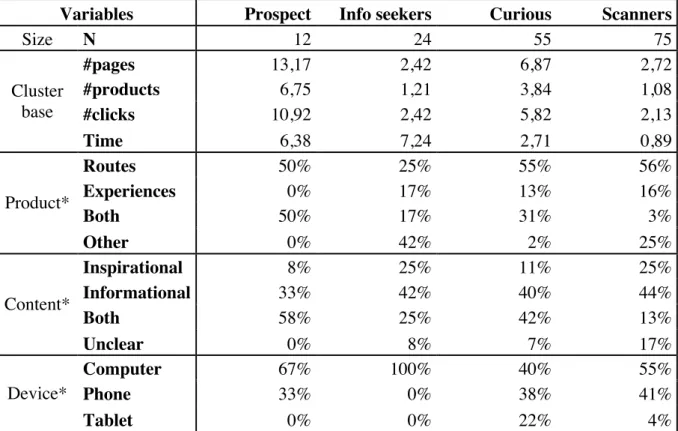
The clickstreams were manually entered in SPSS by following a coding guide when analysing the recordings. The coding guide can be found in Appendix A and provides an overview of the variables and their categories. The variables ID, Date, Time, Device, Country and #pages were given by Hotjar. The other variables, #clicks, Product, #product, Content, Conversion and Other were extracted by watching the recordings. The most important variables for the analysis of the behaviour are Time, which is the time a visitor spent on the page; #page, which is the number of pages a visitors browses during one visit; #clicks, which is the number of clicks a visitors made during the visit; and #product, which is the number of product pages seen during the visit to the website. The other variables were coded as categorical variables, as they are more characterizing the visit than showing actual behaviour. These variables are Date, the day of the week; Device, which could be computer, phone or tablet; Country, which could be Portugal, Europe or World; Product, which could be the routes, experiences, both of these or other content (such as the ‘about us’ or contact information); or Content, the type of content the visitor was looking for which could be inspirational, informational, both or unclear. The other two variables, Conversion and Other, were not considered for further analysis, as they barely appeared in the recordings. The criteria for categorizing the variables that were not given directly by Hotjar are presented in the overview in Appendix A.
On average, visitors saw five different pages during a session on the website, by doing five navigational clicks. Generally, three out of these five pages displayed a product of the company. To prevent influence from outliers during the cluster analysis a Mahalanobis outlier analysis was performed. This analysis involved running a linear regression with the four behavioural variables and saving the Mahalanobis values (Hair et al., 2010). By creating a Chi Square distribution based on those values, the nine observations that had a p-value below 0.001 were considered as outliers in the behavioural patterns and taken out of the dataset for further analysis.
27 Once more, a two-step clustering analysis was used as a method for segmentation. The variables used for this analysis were the behavioural ones (Time, #page, #clicks and #product) (Hair et al., 2010). The other variables were used for the characterization of the segments and the differences between those groups were measured by creating crosstabs in combination with Chi Square tests to assess the significance.
3.3
P
RIMARY DATAThe primary dataset was collected during the week of the 2nd
until the 8th
of May 2016. Data was generated by a field study, in the form of a campaign for two of the flying routes of the company on Facebook. The campaign consisted of two posts, one of the promotional category and one of the route zoom category. They were posted on the Facebook page on Tuesday and Thursday and were boosted (paid) to get a larger reach. The posts led the Facebook users directly to the respective product pages on the website by clicking on the link in the post. During the same week, the company had two other native posts on the Facebook page; one Instagram picture and one special guest post.
3.3.1SOCIAL NETWORK SITE
The data extracted from the Facebook page for the field study analysis was handled the same way as the secondary data earlier extracted from this SNS. It contained 4 posts, 307 other nodes and 367 interactions. The number of interactions per post is presented in Table 3. Gephi was again used to visualise the structure of the network and to add SNA metrics. After that, the data was further analysed in SPSS to assess the differences of the SNA metrics between the users that interacted with the different campaign posts by doing Independent Samples T-tests.
Table 3: Number of interactions per post category
Post Category # interactions
Instagram picture 21
Promotion 115
Route zoom 131
Special guest 100
3.3.2WEBSITE
The clickstream data during the week of the field study was coded in the same way as the clickstream from the secondary dataset, using the coding guide and entering the data directly into SPSS based on the recordings. One more variable was added to the dataset in order to separate the entry page of the visitors. The Facebook posts during the field study
28 linked to two specific route-pages and the assumption was made that the visitors who entered the website via one of these pages, came directly from Facebook (Hotjar does not provide additional information about the source of the visit).
The dataset contained 115 observations; 59 corresponded to users that entered the website via the promotional post and 56 that clicked on the route zoom to enter the website. On average, the visitors browsed 2,9 pages during their visit and spent 1,3 minutes on the site. The average number of clicks was 1,8 and the number of product pages visited was 1,8 on average. The primary data was further analysed in SPSS to test for differences between the visitors based on the entry page they used and their browsing behaviour. The differences were tested for significance by an Independent Samples T-test for the continuous variables and creating crosstabs with Chi Square tests for the categorical variables.
29
4.
R
ESULTS
&
D
ISCUSSION
This chapter presents the results of the data analysis and subsequently discusses them. First, the network of the Facebook page was using SNA tools and metrics. The network was compared with three competitors for a better understanding of the SNA metrics. After that, the results of both the segmentation studies are presented; firstly the users of the Facebook page and secondly the visitors of the website. Lastly, the results of the field study are presented. The discussion directly follows upon the presentation of the results per analysis.
4.1
N
ETWORK STRUCTUREThe visualisation of the network structure of the company’s Facebook page is presented in Figure 2. The blue dots are the posts on the Facebook page and the black dots are Facebook users interacting with the posts. The ties are mainly coloured blue as well, to highlight the interaction between a post and user (and not user to user). There is one user that connects to a large amount of other users (in the right lower corner), which is displayed by the black ties. The centre of the image seems like a dense mass of black and blue dots, implying that users might be connected to several posts. The posts outside of the mass show a more separated audience, for example most of the users interacting with the post on the right upper corner only interact with that specific post.
30 The diameter (longest path between extremes) of this network is 6. The average path length in the network is 3,47 and it has a density of 0,0004. The average degree in the network is 3,94 including both the users and the posts of the Facebook page. When eliminating the posts from this count, the average degree in the network decreases to 0,364. Table 4 presents these metrics of the Facebook pages of the company and the three competitors of the company.
Table 4: Network metrics for the company and competitors
Company Competitor 1 Competitor 2 Competitor 3
Nodes 929 1541 1096 4363 Posts 45 103 96 81 Users 884 1438 1000 4282 Edges 1821 2652 2459 6744 Average Degree 3,92 3,44 4,85 3,09 Diameter 6 6 6 6
Average path length 3,47 3,37 3,70 3,70
Density 0,0004 0,002 0,004 0,001
The network structures of the competitors are presented in Figure 3. Competitor 1 has a similar structure as the network of the company, a centred mass and a few outliers (one of which is far outside of the network on the right side). Competitor 2 seems slightly denser in the middle, but also has small subgroups at the edges of the network. Competitor 3 has a network that is more based on the interactions between users than on the interactions between users and posts (note that only 81 out of the 4363 nodes in the network are posts). Nevertheless, there are some clear subgroups that can be identified in this network, that are interconnected with each other.
31
4.1.1DISCUSSION OF THE NETWORK STRUCTURE
The structure of the network of the company shows that most of the posts and users are creating a more or less cohesive mass in the centre of the network. Nevertheless, there are subgroups located further away from this centre that have fewer connections to other users and posts. Some of these outsider subgroups are formed around posts and show that these particular posts had a high interaction rate. The two the posts with highest number of interactions (top left and top right) are video-posts. One explanation for the popularity and outstanding position for these video posts is that one of the video posts came from the branded page of a TV station that broadcasted a program about spending leisure time and tagged the company in their post. This causes a larger reach and thus more interactions because of the combination of the company network and the network of the TV station. Another explanation is that the algorithm of Facebook gives more weight to videos and therefore they are shown more often on the News Feed of a user (Widman, n.d.). Videos are known in marketing for being the most viral type of content with the highest response rates, and as such being an effective method for engagement, which is confirmed by these findings(Strauss & Frost, 2014). The other large subgroup (bottom right) was built around a user-node. This user was one of the special guests tagged in a photo. These findings are congruent with the number of interactions per post category that were counted in the categorization of the posts.
When considering the SNA metrics and those of the competitors, there are a number of findings that further highlight characteristics of this network structure. The diameter implies that the longest path in the network involves six nodes to get from one extreme to another and can be seen as a general metric for speed in the network (Borgatti et al., 2013). All three competitor networks also have a diameter of six, even though those networks are larger than the network of the company. The average path length is also a measure for speed in the network, as it calculates the average distance a piece of information should travel to make its way through the network. For the company network, this measure is 3,47, slightly lower than the competition. Nevertheless, for a network of only about 900 nodes that share information, this average is not particularly low (in a best case scenario, where everyone is connected to everyone, the average path length would be 1), which means that the nodes are not highly interconnected. The density of the network confirms this finding by showing a very low number, compared to the competition (0,0004 for the company, while the competition shows densities between 0,001 and 0,004). That the network only contains 0,04% of all the
32 possible connections is partially explained by the fact that this network is based on a branded fan page and not a friend-network. Yet, the competitors are also networks based on interactions with branded content and not friends, which could imply that those networks are built on more closed communities. Being a network based on interactions with the posts of the branded page also caused the average degree to decrease from 3,94 to 0,364, when taking out the posts. This implies again that the users are not connected to each other, but merely the posts of the company. This characteristic means that a company could take advantage of many different friend-networks of the users once they interact with the branded content.
4.2
F
ACEBOOK SEGMENTSThe two-step cluster analysis based on the eight post-user interaction variables yielded four clusters. The quality of this cluster solution was good (with average silhouette measure of 0,8) and the ratio between the largest and smallest group size was 2,7 (details are presented in appendix B). In Table 5 the four clusters are presented on the basis of the interaction probability per cluster per content category. The outlier cluster was not presented in the table, as it was not taken into account for further analysis.
The results from the cluster analysis suggest that there is a rather large group of 257 users on Facebook that only interact with the videos (cluster 4). The smaller sized groups interact with the Instagram posts (cluster 1) or with the Route zooms (cluster 2). Lastly, there is a more divided group as 32% of the users interacted with the promotional posts and 20% with the posts that featured special guests (cluster 3). The Facebook users in the clusters hardly ever interacted with the other content types. This could be explained by the size of the outlier cluster, which contained 212 users.
In addition to the cluster analysis, an ANOVA with post-hoc test was conducted to assess the differences between the clusters based on the SNA metrics. The averages on the variables degree, closeness centrality (speed of information), betweenness centrality (control of information) and eigenvector centrality (influence measure) are also presented in Table 5. The tables with the results from the tests can be found in appendix C. The ANOVA suggests that the means of the variables Speed and Influence are statistically different for the four groups (F(3, 667 = 837,0) p = 0.000 and F(3, 667 = 779,0) p = 0.000), while this is not the case for the Degree and Control variables (F(3, 667 =1,3) p = 0.269 and F(3, 667 = 2,5) p = 0.057). However, the post-hoc test found significant differences between cluster 3 and 4 on
33 the Control variable (p = 0.038), but no statistical difference between cluster 1 and 3 on the Speed and Influence variables (p = 0.254 and p = 0.593).
User clusters can be characterized based on the observed interaction behaviour and corresponding social network metrics. The first cluster, which interacts with the Instagram-posts, has a high speed of information diffusion, average control and low influence measure. They can be named the Photo-Fans. The second cluster, interacting with the posts that zoom in on the routes, also has a high speed of diffusion, average control, and a slightly higher influence measure. This group is identified as Route-Lovers. Cluster 3, the only group that does not consist of people that only interact with one specific type of content, but with both the promotion and special guests posts, has a high speed, low control and low influence. It is this named Promo-People. Lastly, there is the cluster that exclusively interacts with the video posts. They have a slower speed of diffusion, high control and high influence. They are called the Video-Viewers. The clusters are named after their interaction patterns with specific content, as this is more intuitive for managerial implications.
Table 5: Summary of Facebook segments
Variables Photo-Fans Route-Lovers Promo-People Video-Viewers
Size N 95 119 200 257 Cluster basis Instagram 100% 0% 0% 0% Sentence 0% 0% 4% 0% Event 0% 0% 4% 0% Promotion 0% 0% 32% 0% Route 0% 100% 0% 0% Guest 0% 0% 20% 0% Video 0% 0% 0% 100% Information 0% 0% 0% 0% Degree (mean ± std.) Average degree 1,13 ± 0,33 1,06 ± 0,33 1,07 ± 0,29 1,06 ± 0,24 Centralities (mean ± std.) Speed* 0,264 ± 0,007 0,271 ± 0,009* 0,266 ± 0,010 0,307 ± 0,11* Control 13,3 ± 39,6 16,3 ± 96,9 5,4 ± 28,8* 30,9 ± 144,8* Influence* 0,0123 ± 0,0071 0,0176 ± 0,0080* 0,0137 ± 0,0088 0,0478 ± 0,0094*
*Statistical difference on a 95% significance level (p < 0.05)
4.2.1DISCUSSION OF THE FACEBOOK SEGMENTS
The segments created based on the interactions with the posts on Facebook include many of the users. Still, the outlier group was also relatively large (212 users). Nevertheless, the company could directly target three of the segments as they interact with content produced
34 and regularly uploaded by the company (or marketing agency). Those are the Photo-Fans, who interact with the Instagram pictures; the Route-Lovers, who interact with the posts that zoom in on a specific part of the routes; or the Promo-People, who either engage with posts that contain special offers or have a VIP tagged in the post.
The differences between the groups on the SNA metrics require careful analysis to in order to fully understand their meaning. To start with, the degree (which was not significantly different between the clusters) is close to one for all the groups, implying that the users have only a single connection in the network. Since the ties are based on user-post interaction this indicates that most of the users interacted with one post only.
The measure for speed of information passing through the nodes calculates the distance from the node to its neighbours. This distance is higher for the segment of Video-Viewers, which relates to the distance that lies between the video-subgroups and the rest of the network (as can be noted in the visualization of the structure). The other groups have a lower score for the closeness centrality, signalling they are closer to the core of the network where the information reaches them faster than on the outskirts.
The control of information is based on the number of shortest paths in the network that pass through the node. For the Video-Viewers, that number is higher because they are located at the borders of the network of the company’s Facebook page. There, they form bridges to other networks and by doing that, these nodes have more control over the information that passes from this network to another (Burt et al., 2013). Comparing to the Promo-People cluster, which has a very low control, it implies that with a video the company could reach more people outside of the network than with a post containing a promotion or VIP. This finding is remarkable, because the special guests that are tagged in the posts also have a substantial amount of followers that could be reached.
Lastly, the measure for influence is based on the eigenvector centrality of the nodes. The eigenvector not only takes the node into account, but also the adjacent nodes in order to assess the chance that a node will get the information (Borgatti, 2005). This explains once more why the Video-Viewers have the highest score, namely; the video seems an extremely important node because there are many interactions with this node. The eigenvector of the users connected to the video posts increases because of that. The Route-Lovers also have more influence than the others, which relates to the higher interaction rate of those posts.