5th
European Conference on African Studies African Dynamics in a Multipolar World
©2014 Centro de Estudos Internacionais do Instituto Universitário de Lisboa (ISCTE-IUL) ISBN: 978-989-732-364-5
ELECTORAL PARTICIPATION AND DEMOCRATIZATION IN ZAMBIA: DO POVERTY LEVELS AFFECT VOTERS' PERSPECTIVES?
Federico Battera University of Trieste – Dept. of Political and Social Sciences
Abstract
By concentrating on electoral participation and poverty levels across provinces, this paper provides an explanation to the fluctuating people attachment to party politics. In particular, since poverty levels were different among rural and urban provinces and governments have displayed different sensibilities towards urban and rural constituencies the paper tries to discover whether such differences do count for political participation. In the 00s, after the formation of the Patriotic Front (PF), a growing interest has been placed on inequalities and on the fight against poverty in electoral programmes of both governing party and the oppositions. However, the results have been ambiguous in terms of participation. Our findings is that participation was rather driven by other factors such as tradeunionism in Copperbelt and ethnicity in the Southern province.
Key words: electoral participation, poverty, ethnicity, party programmes, Zambian politics, government policies
Introduction
Why do actually people vote? As far as ethnically divided countries are concerned two competing explanations concur: still, for Africa the most serious contributions point at ethnicity as the major vote driver (Posner, 2005), however a new trend which rather points at other explanations is gaining ground (Norris & Mattes, 2003; Bratton et al., 2005; Erdmann ,2007). These contributions look at other determinants such as inequality, class or access to labor market and rigorously challenge that elections in divided countries are merely an “ethnic census” (Horowitz ,1985). For example, Youde (2005) demonstrates how economy is taken into consideration by voters when they evaluate Ghana government performances. Similarly, Bratton et al. (2011) found that would-be voters consider policy performances while ethnic considerations rather drive voters’ attitude of the same ethnic group in power. Bossuroy (2007) also on Ghana, finds limited impacts of ethnicity in vote performances while economic determinants should be the most important. Batty (2011) tries to demonstrate that ethnic groups rather split into different parties be their preferences divergent. According to Bannon et al. (2004) indeed, occupation is equally a strong source of identification. Others evoke a combination of factors namely ethnicity and economic interests such as patronage (Lindberg & Morrison, 2008). However, for others (Chandra, 2007), patronage should be more considered as a reinforcing factor of ethnicity. Such view is confirmed by the evidence that rural African voters do vote more than urban ones (Kuenzi & Lambright, 2005). Since, in general, poverty in rural areas are worse, such attitude would diverge with the common assumption that the poor vote less than the middle class or richer people as it happens in developed countries (Almond & Verba, 1965; Rosenstone & Hansen, 1993; Conway, 2000) unless the poorest receive distributive
benefits such as farmer subsidies (Wolfinger & Rosenstone, 1980; Brusco et al., 2002; Nichter, 2008).
The two explanations – party identification through the ethnic background of candidates (Posner’s theory) and rational choices based on material incentives – likely concur to complete the picture. We do not move from this perspective. By concentrating on electoral participation and poverty levels across the 9 provinces of Zambia, this paper tries to provide an explanation to the fluctuating people attachment to party politics recorded in this country. Although ethnicity still remains an important factor for electoral participation, electoral programmes with clear differences have growingly shaped Zambian electoral market. They appeal for the citizens’ vote regardless their ethnic background. In so doing, they have also shaped the policies that governments have enacted to stay in power.
Zambia turned to be a good field for research. Divided among perhaps five big macro-ethnic/regional1 groups, Zambia has been a dominant-party system since the re-establishment of political pluralism in 1991. However, since 2001, opposition parties have started to gain ground by finally defeating the MMD in 2011 elections. Many parties and many ethnic groups therefore compete for power but also a tradition of trade unionism and economic protest that played an important role during independence, has regained ground since multi-partitism was re-established in 1991. Voter turnout (VT) has been chosen as the most important indicator of political participation. Since most of the provinces are dominated by one ethnic group, VT will be analysed at the provincial level, and the connection between poverty levels in the country and participation will, when possible, be explored. In particular, since poverty levels were different !!!!!!!!!!!!!!!!!!!!!!!!!!!!!!!!!!!!!!!!!!!!!!!!!!!!!!!!!!!!!
1!
According to the 1990 census, the main spoken languages are the Bemba (39.7%), the Nyanja (20.1%), the Tonga (14.8%) and the Lozi (7.5%).!
between rural and urban provinces and governments have displayed different sensibilities towards urban and rural constituencies, we would like to discover whether such differences do count for political participation in Zambia as well.
Zambian Contrasting Patterns of Political Participation after 1911
Zambia was ruled by the sole leadership of Kenneth Kaunda and his own party (UNIP) from independence in October 1964 to 1991 elections. In December 1973 a new constitution was adopted and UNIP became the sole legal party in Zambia. Although parliamentary elections continued to be held between 1973 and 1988, this happened under a one-party state where electors were free to choose their candidate from a list that had been previously established by UNIP. Kaunda continued to be formally elected but run unopposed. The only concession to electors was to vote “no” or not voting at all. Between 1973 and 1978, VT ranged between 39.4% and 66.7%. Kaunda was elected with strong majorities (above 80%) despite an important opposition in the Southern province (48.8% voted “no” to his election in 1978). Although he was supposed to be ethnically biased, Kaunda had always strived to be above ethnic factions in the UNIP. Being born in the Northern province (an overwhelmingly Bemba province) from Eastern parents (a Nyanja province) and having spent much of his political life in Lusaka first as Secretary General of ANC and second as President of UNIP and of the country his ethnic background had indeed been mixed. Under Kaunda, Zambia Cabinet was constantly reshuffled in order to balance posts between provinces (i.e. ethnic groups). Graft of state resources helped patronage to thrive and contributed to rule factionalism within the ruling party (Szeftel, 1982: 6). However, moving from a national base to a Bemba-speaking base in the middle of the 60s, at the end of the 80s the Kaunda regime was reputed to mainly rely on a Nyanja-speaking base, though
the Cabinet since independence had always been mixed as far as its ethnic composition was concerned (Posner, 2005: 98). As a result, when new parliamentary and presidential elections were held in 1991, his party managed to retain the sole vote of Eastern province and was heavily defeated by MMD, the party that gathered all the oppositions in the country from inside the UNIP, the civil society and the powerful ZCTU trade union.
Zambia is divided among about 70 tribal groups however, as Posner has efficaciously demonstrated (2004 and 2005), such groups for the purpose of political power more likely gathered around 5 major linguistic/regional groups. According to Posner (2005), such kind of political attachment rather works during presidential elections. On the contrary, despite parliamentary and presidential elections are held together, it only partially counts during the parliamentary ones as intra-ethnic rivalries can likely resurface in the selection of candidatures (Hulterström, 2004). However, to be selected with the “right party” – the one associated to a presidential candidate who has the same ethnic brand of the major ethnic group in the province/constituency – multiplies the chances to be elected as MP, since the electoral system (FPTP) favours such outcome.
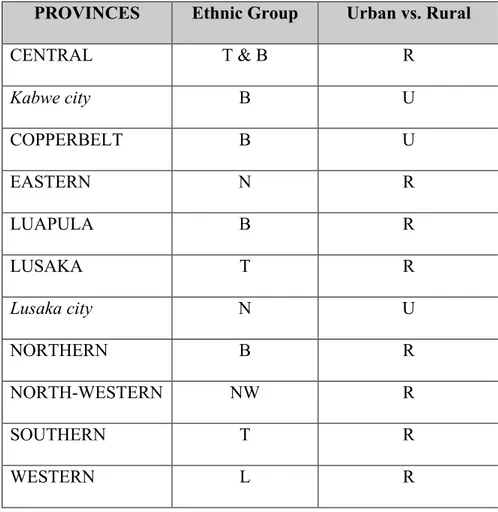
In order to detect ethnic dominance table 1 identifies the main ethnic groups at provincial level. Following Posner (2005), each province has been labelled with a letter according to their ethnic prevalence (B = Bemba, etc.). However, diversely from Posner, Copperbelt has been labeled also as an urban (U) province. Although the language spoken there is Bemba, people of the province is mixed and largely composed by mine workers who have a different approach to politics that is more oriented to the delivery of public goods. Similarly, while Lusaka province is prevalently Tonga (T) the main language of the city of Lusaka is Nyanja (N). However, also Lusaka city could be considered a mixed town. The Central province is mixed with some
districts prevalently Tonga and others Bemba. Similar considerations to that of Lusaka city apply also for Kabwe, the capital of Central province. Contrary to other provinces the North-Western province has not developed a common “lingua franca” however, voters rarely split their vote. Therefore it was labeled as if they had a common ethnic background (NW).
Tab. 1 – Zambia Provinces According to their Social profile PROVINCES Ethnic Group Urban vs. Rural
CENTRAL T & B R Kabwe city B U COPPERBELT B U EASTERN N R LUAPULA B R LUSAKA T R Lusaka city N U NORTHERN B R NORTH-WESTERN NW R SOUTHERN T R WESTERN L R
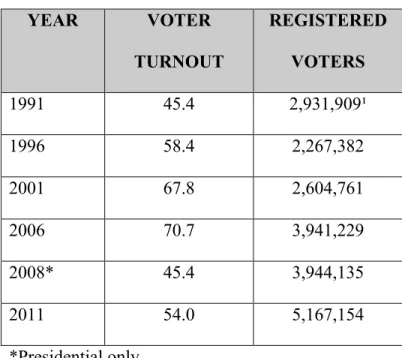
National voter turnout (VT) is represented in table 2. National VT could be a good indicator of voters behaviour and feelings after democracy has been re-established, it however proved to be of scarce help.
Tab. 2 – National Voter Turnout YEAR VOTER TURNOUT REGISTERED VOTERS 1991 45.4 2,931,909¹ 1996 58.4 2,267,382 2001 67.8 2,604,761 2006 70.7 3,941,229 2008* 45.4 3,944,135 2011 54.0 5,167,154 *Presidential only. ¹ Not reliable.
First, Zambia displays a fluctuating VT, which is difficult to explain. For example, 1991 founding elections which marked the regime change recorded a very low VT, quite lower than the last available data for elections held under the one-party regime which recorded a substantial 65.5% (1983). The 1991 data might be altered by two factors: problems around voter registration and probably because of the manipulation of 1983 data by the previous authoritarian regime2. However, by 1991 up to 2006 (included), Zambia recorded an increase of VT followed by a decrease. The latter is probably due to an updated voter registration or, alternatively, an effect of de-politicization that is also common in consolidated democracies. Probably a combination of these two factors. Interestingly, by 2001 MMD hegemony started to be seriously challenged by an increased attention by opposition parties towards poverty and social inequalities.
!!!!!!!!!!!!!!!!!!!!!!!!!!!!!!!!!!!!!!!!!!!!!!!!!!!!!!!!!!!!!
2!The 1983 Presidential elections recorded an improbable 95.4% of a plebiscitary “yes votes” for Kaunda.
Much more interesting is disaggregate VT by province (Tab. 3). VT varies accordingly and we can identify some constant trends.
Tab. 3 – Voter Turnout Disaggregated by Province
PROVINCES VT (2011) VT (2008) VT (2006) VT (2001) VT (1996) VT (1991) VT mean CENTRAL 47.6 40.6 71.1 67.1 56.7 36.9 53.3 COPPERBELT 59.0 52.8 72.2 72.6 71.3 53.8 63.6 EASTERN 50.8 40.5 69.8 65.7 36.9 50.2 52.3 EASTERN* 55.4* LUAPULA 52.4 37.8 64.0 66.2 65.0 46.6 55.3 LUSAKA 54.0 50.7 71.7 64.8 58.6 45.0 57.5 NORTHERN 57.5 44.6 69.2 66.5 64.7 44.0 57.8 NORTH-WESTERN 54.7 42.7 70.2 70.7 67.3 40.3 57.6 SOUTHERN 58.6 49.8 75.7 71.5 57.9 43.6 59.5 WESTERN 49.5 45.4 68.4 62.6 50.0 38.9 52.5 Δmax-min 11.4 15.0 11.7 10.0 34.4 16.9 11.3
*Eastern VT mean without 1996
Copperbelt, which is overwhelmingly urban, always ranks at the top apart in 2006 (scored second). Copperbelt has always been important for electoral changes and during crucial
elections. This province is the venue of copper mines, and since copper is the most important exportation good, the province has always been at the forefront. UNIP started from Copperbelt before independence and also MMD found its home base in the Copperbelt after 1990, as well as the PF after its foundation. Interestingly, also the Southern province, which is rather rural, ranks at the top (in second position). By 2006, Southern province has always been a stronghold of opposition as it had been before the establishment of one-party state (in 1968 was an ANC stronghold) and partially also under authoritarianism. Eastern province ranks the lowest VT mean (52.3%). The reason of such result is however the dramatic decrease of voting in 1996 due to the UNIP boycott after the constitutional amendment which hampered Kaunda to run. At that time and up to 2006, Eastern province was a stronghold of UNIP, which de facto disappeared by 2006. If we therefore omit 1996, the VT mean for the Eastern province increases leaving Central, Western and Luapula at the bottom of mobilization. With the exclusion of Central, such provinces are mainly rural. So, and contrary to other countries (Kuenzi & Lambright, 2005), in Zambia there are no major differences between a rural and an urban vote with the significant exception of the Copperbelt that is always at the top3. Northern and North-Western provinces that are rural rank in the middle.
If we consider the electoral results, Posner (2005) arguments about a prevalence of an ethnic vote seem to be confirmed (see tab. 4). Although provinces are not entirely ethnically homogeneous, winning parties usually ensure strong majorities at provincial level. For example, in the Northern province (a predominantly Bemba-speaking province with the exception of 3 out of 21 constituencies), MMD managed to win 20 out of 21 constituencies in 2001. In 2011, 15 out to 20 went to PF. Only during 2006 the vote of the province split between MMD and PF. But this !!!!!!!!!!!!!!!!!!!!!!!!!!!!!!!!!!!!!!!!!!!!!!!!!!!!!!!!!!!!!
happened after PF started to make inroads into the province. Vote in the Southern province is even more stable. In 1991, MMD won all the constituencies with majorities ranging from about 75% to 89%. In 2001, UPND won 18 out of 19 constituencies, in 2006 17/19, in 2011 17/18. However, others determinants seem also important especially after MMD hegemony started to crumble in 20014. We have first distinguished between Central, rural and urban (Kabwe) districts and Lusaka rural and urban (Lusaka district). The Cobberbelt has also been split in two (urban and rural districts) although only 4 out of 22 constituencies were rural (in the three districts of Masaiti, Lufwanyama and Mpongwe). Such districts are mainly inhabited by Lamba who spoke a language related to Bemba. What emerges is that highly urbanized districts often vote differently from the surrounding rural districts. For example, if by 2006 the Copperbelt shifted towards PF, rural districts in the Copperbelt continued to vote for MMD. The same had happened in Central province (HP won in Kabwe in 2001 and PF in 2008 and 2011 while MMD won in rural areas) and in Lusaka, where by 2001 most of the urban constituencies voted for parties with a more urbanized profile such as FDD and PF while rural constituencies voted for MMD or UPND.
!!!!!!!!!!!!!!!!!!!!!!!!!!!!!!!!!!!!!!!!!!!!!!!!!!!!!!!!!!!!!
Tab. 4 – Electoral Results Disaggregated by Provinces According to their Social profile (Provinces have been allocated to the party which won the majority of seats assigned to the province) PROVINCES Ethnic Group Urban vs. Rural 1991 2001 2006 2008 2011 CENTRAL T & B R MMD MMD MMD MMD MMD Kabwe district B U MMD HP MMD PF PF COPPERBELT B U MMD MMD PF PF PF Copperbelt rural B R MMD MMD MMD MMD MMD
EASTERN N R UNIP UNIP MMD MMD MMD
LUAPULA B R MMD MMD PF PF PF LUSAKA T R MMD UPND MMD MMD MMD Lusaka district N U MMD FDD PF PF PF NORTHERN B R MMD MMD MMD PF PF NORTH-WESTERN NW R MMD UPND MMD MMD MMD
SOUTHERN T R MMD UPND UDA¹ UPND UPND
WESTERN L R MMD UPND MMD MMD MMD
*1996 elections excluded because of UNIP boycott
¹ UDA was a coalition composed by UPND, UNIP and FDD
The point is that all the parties which want to win nationally have to appeal both ethnically in rural areas and non-ethnically by stressing different profiles such as the delivery of public goods in urban ones. Actually, no party in Zambia is strictly ethnic. Since no ethnic group
enjoys an absolute majority, parties rather seek to acquire a ‘congress’ type profile (Gunther & Diamond, 2003), which means being built by coalitions of ethnic groups.
The trajectory of dominant MMD party is quite illuminating. Starting with a national profile, MMD, by 2001, started to lose votes outside Bemba-speaking areas. However, by 2006 and the growth of the rival PF, whose leader is Bemba, and after having the Bemba lost the leadership of the party, MMD started to shift its electoral base from Bemba provinces to the others apart from Southern.
In the meantime, Southern felt under the tight control of UPND (in 2006, UPND joined UNIP and FDD in the UDA coalition). Both its leaders, Anderson Mazoka (up to his death in 2006) and Hakainde Hichilema were born indeed in Monze (Southern province). Monze is renowned for being the venue of a Tonga ceremony which gathers annually people of Tonga. Such spiritual link helped UPND to emerge as the leading force in the area. However, such ‘ethnic’ profile hampered UPND to acquire a more ‘congress’ one. Only recently, by 2011, the party was able to make inroads in Western province where it won 6 out of 17 constituencies (MMD won 7) as it had been in 2001. Such recent developments were probably due to the erosion of MMD authority after 20 uninterrupted years in power, a point which will be explored further on.
In 2001, Michael Sata, a prominent leader of MMD, joined the opposition after failing to win the nomination for the presidency and formed his own party: the PF. The PF gained a poor result in 2001 elections. Sata ranked in seventh position winning only a mere 2.3% nationally. Being from the Northern province (Mpika) and a Bemba-speaker, he however had been MP for Kabwata an urban constituency in Lusaka between 1991 and 1996, becoming minister in Chiluba
governments5. Running also as MP for Kabwata he obtained less than 2% of votes in 2001. But everything changed by 2006. He campaigned against Chinese companies in the Copperbelt winning the confidence of workers and of urban dwellers of Lusaka. He managed to win also 9 out of 14 Luapula constituencies, although Sata is not from Luapula. Luapula is overwhelmingly rural, extremely poor and a Bemba province where much of its unemployed people seek better jobs in Lusaka or in the Copperbelt. But it is only in 2011 that PF emerged as the new national party defeating the MMD hegemony. This happened after PF, though maintaining its urban profile, started to target also Bemba electors in rural constituencies. Voter turnout made the difference in 2011 compared to the presidential elections of 2008 that were held after the death of Mwanawasa. At that time, Rupiah Banda of MMD managed to win the elections (40.1% against Sata 38.1%). However, in 2011 it was the turn of Sata to win 42% against Banda’s 35.4%. Much of the difference was due to a better voter turnout secured in PF constituencies than in MMD constituencies combined with a slight decrease of MMD vote in Western and Eastern.
So if it is true that the ethnic profile of presidential candidates do count as Posner (2005) argues – it is the ethnic profile of the presidential candidate that determines the ethnic profile of the party – most of the stronger presidential candidates in Zambia have always combined their ethnic profile with a urban one. The first president after the return to multipartitism, Frederick Chiluba, a Bemba-speaker born in the Copperbelt, had spent part of his life in Luapula before going back to the Copperbelt and as Secretary of ZCTU his main constituency was initially located in the Copperbelt. The second president, Levy Mwanawasa, was also born in the Copperbelt from a Lenje (Tonga) family of the Central province and had been a former MP of !!!!!!!!!!!!!!!!!!!!!!!!!!!!!!!!!!!!!!!!!!!!!!!!!!!!!!!!!!!!!
Chifubu (Copperbelt). The third president Rupiah Banda, born in Zimbabwe from Eastern parents, served as ambassador during much of his professional life and had been former MP of Munali (Lusaka).
The Political Economy of MMD: The Impact on Poverty Levels
Multipartitism came after almost three decades of state-centered policies6. Relying on copper production and export, Kaunda regime favored urbanization at the expenses of rural areas. However, although Zambia was one of the largest urbanized countries in Sub-Saharan Africa, much of its population remained rural. Starting from the beginning of the 80s, Zambia began to suffer because of its strong dependency from copper exportation and the decrease of the international price paid for it7. State-centered policies were completely reversed when, in 1991, MMD and Frederick Chiluba came to power. Under strict IFIs conditionalities, governments started to pursue political liberalization. As a result, much of the parastatal companies were privatized. Although this policy was only partial and by the end of the 90s unchained great reactions within the government (Rakner, 2003: 173), almost a decade of privatization had worsened the levels of poverty in the urban areas (see tab. 5)8 affecting the initial constituency of MMD. At the beginning of 00s, after more than two decades of economic decline inflation averaged over 50 percent with poverty levels that reached about 73% of the national population (McCulloch et al., 2000)9. Formal sector employment fell by 24% since 1992 (Larmer & Fraser, 2007: 616). Interestingly, although agriculture privatization completely failed, poverty in rural !!!!!!!!!!!!!!!!!!!!!!!!!!!!!!!!!!!!!!!!!!!!!!!!!!!!!!!!!!!!!
6!
In the mid of the 70s 80% of the Zambian economy was estimated to be controlled by the state (Rakner, 2003: 46). 7 Copper earnings fell from USD 1.10 a pound in 1972 to 0.58 in 1978; in 1982 Zambia was dependent on exports of copper and cobalt for 96 percent of its foreign exchange.
8 Maize (the main staple food) subsidies had been removed in December 1991.
9!Poverty line in Zambia was established by the Zambian Consumer Prices Index. This was about 1 USD per day.
areas it had remained much the same, probably because the government was forced to act on the market as the main buyer (Rakner, 2003: 72).
TABLE 5 – Poverty estimates at provincial level
Provinces 1991 1998 Change 91-98 2006 Change 98-06 Change 91-06 Rank 2006 Central 70 77 +7 72 -5 -2 6 Copperbelt 61 65 +4 42 -23 -19 8 Eastern 85 79 -6 79 = -6 2 Luapula 84 82 -2 73 -9 -11 4 Lusaka 31 53 +22 29 -24 -2 9 Northern 84 81 -3 78 -3 -6 3 North-Western 75 77 +2 72 -5 -3 6 Southern 79 75 -4 73 -2 -6 4 Western 84 89 +5 84 -5 = 1
Sources: Central Statistical Office (RoZ), Living Conditions Monitoring (http://www.zamstats.gov.zm); see also CSO (2000)
Notwithstanding, during 2001 elections MMD was able to maintain its dominance also in the Copperbelt but its fortune started to decline in other urban areas such as Lusaka and Kabwe to the advantage of other parties mostly composed by former MMD leaders disaffected by the attempts of Chiluba to pursue a third mandate10. 2001 elections also marked the introduction of party manifestos by all the most important contenders. With few variations, most of them were quite similar with the exception of FDD whose stress on the need of improving small-scale !!!!!!!!!!!!!!!!!!!!!!!!!!!!!!!!!!!!!!!!!!!!!!!!!!!!!!!!!!!!!
manufacturing sector gave it a more urban profile. It did win elections in Lusaka district. Such increased programmatic profile of the parties started to gain ground and this was a crucial factor for the following elections.
While under Chiluba poverty spread out mainly in the cities, under Mwanawasa the urban population was the first to benefit from renewed growth driven by copper production11. The government was able indeed to profit from copper concessions despite the poor royalties. At least, what had been lost in the 90s was recovered (the situation of inequalities in 2006 being mostly the same as that at the beginning of the 90s). By 2003, GDP started to grow and inflation was reduced. However, a report of WB (2004: 3) recognized that such growth was lower than the rates needed to accelerate poverty reduction. The actual spending on that time on a subset of poverty-reducing programs remained about 1 percent of GDP only. Another report by the WB (2013) confirmed the gap between rural and urban areas. In 2010, people in extreme poverty ranged from 18.3% in the Copperbelt and 64.9% in Luapula. Compared to government statistics, the Copperbelt ranked therefore the best ahead of Lusaka, however this was consistent with the degree of urbanization of the Copperbelt compared that of the Lusaka province, where people in extreme poverty were about 22.6%.
Losing its grip on the urban centers, MMD government’s strategy shifted to rural areas. By the middle of the 90s policies of subsidizing agricultural inputs (fertilizers and seeds) for smallholder farmers had been recovered and this remained the core policy of MMD throughout the OOs at the expense of urban development. Such policy completely changed the political landscape, although it poorly impacted on the urban vs. rural gap. This happened when a new powerful challenger appeared on the scene. Michael Sata and his PF.
!!!!!!!!!!!!!!!!!!!!!!!!!!!!!!!!!!!!!!!!!!!!!!!!!!!!!!!!!!!!!
The Turning Point in Zambian Politics: The Birth of PF and 2006 Elections
PF poorly performed during 2001 elections, but by 2006 it had become one of the major player. Sata’s populist approach towards foreign investors (China in particular) won the crucial Copperbelt vote in 2006. Copperbelt remains his core constituency12. Sata, despite his age (about 70), combines charisma and popularity gained with aggressive tones against the declining MMD accused of mismanagement and corruption. In 2008, he became the “man of change”. His popularity was strengthened by the strong support of Guy Scott. Being Scott a Zambian of British origin, his profile was immune of tribalism. Together they led the party up to 2011. By 2006 PF developed an electoral discourse borrowed from urban protest movements (Larmer & Fraser, 2007) with a manifesto tailored on the needs of poor urban people13. PF became an highly centralized machine installed at the ward level especially in urban areas. Wards became instrument of mobilization and propaganda. A quite different structure from the dominating MMD which was mainly a loose structure of provincial politicians tied together by political interests and aspiration to have remunerative governmental jobs. Such higher centralized structure worked so well that, during 2011 elections, the party leadership rejected MP candidates selected in Copperbelt primaries when they were not approved by Sata himself. Notwithstanding this they were able to ensure strong majorities anyway. In 2011 renovated attacks to the MMD corruption and the alleged suspicion that MMD was likely to buy votes was accompanied during the campaign with the efficacious slogan “donchi kubeba” that roughly means “don’t tell them
!!!!!!!!!!!!!!!!!!!!!!!!!!!!!!!!!!!!!!!!!!!!!!!!!!!!!!!!!!!!!
12 In 2011, opposition inside the PF took ground in Copperbelt. Most of these PF members were young and were contesting PF established leadership in the province. However they lacked the endorsement of Michael Sata. They run as independents and they were severely defeated. The authors carried on extensive interviews in the province in the eve of elections.
(that you will vote for the PF)”, leaving unsaid that people were free of accepting money from MMD while voting for the PF.
However, such populist appeal took a long time to produce its effects. In 2006, PF failed to successfully penetrate rural areas that were the main support area of MMD, while it almost everywhere won in urban and multiethnic areas14. Attempts to penetrate in the Bemba speaking area, from which Sata comes from15, generally failed apart from some entries in Luapula because MMD was prompt to promote Northern politicians in leading positions. Turnout rose significantly although the registered voters also increased by more than 1 million. Sata benefitted from the support of the powerful Mineworkers’ Union of Zambia (MUZ) and by taking former MMD branch structures (Larmer & Fraser, 2007: 624-625). This attitude contrasted with that of the leadership of ZCTU of which MUZ belongs to. Still during the 2011 campaign, the leader of ZCTU was considered in MMD pocket16 while MUZ activists campaigned locally for PF.
Therefore, 2006 elections marked a rupture with previous elections. While ethnic appeals continued in rural areas, the main cleavage had become rather a rural vs. urban one. Yet Zambia remains by large a rural country. According to 2000 national census only about a 30% of the population lived in large conurbations as those found in the Copperbelt and Lusaka. While between 2006 and 2011 PF continued to pursue a urban strategy, the party realized that only pursuing a urban appeal was not enough to overthrow MMD government17. Such strategy, became apparent when during the presidential elections of 2008 rural Bemba voted
!!!!!!!!!!!!!!!!!!!!!!!!!!!!!!!!!!!!!!!!!!!!!!!!!!!!!!!!!!!!!
14 During these elections MMD lost partially Luapula but gained Eastern, North-Western and Lusaka rural from UPND and UNIP.
15 Sata’s critics accused him of utilizing a “chauvinistic Bemba-speaking base” (Larmer & Fraser, 2007: 631). 16 “MUZ accuses ZCTU of failing affiliates”, The Post, 2nd Aug. 2013. Local interviews to tradeunionists and politicians in 2010 and 2011.
overwhelmingly for PF. In 2011 a similar configuration granted Sata the presidency and the PF the government.
Main Findings: New Masters, New Policies?
Patterns of vote in Zambian elections demonstrate the growing importance of the urban/rural divide as well as the resilience of the ethnic one. While the urban vote is mainly driven by economic interests (patronage, jobs, etc.) and by expectations about the delivery of public goods (first of all education), rural vote primarily remains attached to ethnicity. However, also in rural areas the lack of attainment of certain primary goals such as development certainly has an impact. In this case, ethnic voters avoid to overtly reject a candidate that belong to the party they collectively perceive as being ‘their’ party (i.e. the party supported by their most important ‘ethnic leaders’) by voting another candidate. Rather, their option is that of not voting at all. The effect is a decline in turnout as already Posner and Simon (2002) pointed out.
If it is certainly true that rural voters still tend to regard politics from a local rather than a national perspective (Bratton, 1999: 582), on the other hand, after six rounds of national elections, voters have become also increasingly strategic (Battera, 2013). Before casting their vote, voters decide whom to vote for – which party and/or candidate – in order to magnify the opportunity to be represented in government. In so doing they have to look at the entire electoral offer and the potential choices of other electors. That’s why, notwithstanding the importance of ethnic vote, elections retain a margin of unpredictability. That’s also why minor party are usually cast out unless they have the opportunity to influence government decisions. Of course major exception could also be possible. In the Southern province voting for the UPND, a party that has been durable in the opposition, had rather been driven by the heart rather than being a rational
choice. However, this preference has so far and to a large extent strengthened UPND as ‘the’ opposition party. A condition that was of PF up to 2011. Since MMD has almost collapsed by 2011, such condition has considerably increased the chances of UPND to become a greater party for the benefit of their patient southerner electors and to consolidate Zambian democracy in a two-party system.
Another important finding is that parties must have a convincing agenda for electors. The PF victory has much to do with its ability and of its leadership to acquire a national status through a tough campaign centered around the need of change and the fight against corruption. However, this still proves not to be enough. Such agenda has probably a poor impact in rural areas if not combined with the covert promise of some ethnic reward. Having a relative majority in the National Assembly (40% of the seats; raised to 42% in March 2013) the PF had to employ the same methods MMD used after 2001 and 2006 elections when it failed to reach an absolute majority in the parliament: co-opting opposition MPs. At the beginning of 2013 about 13 opposition MPs of MMD and UPND had jumped on the PF wagon and were serving government positions. By doing this the PF was able to take more stable roots in provinces where it was weak. However, such strategy has some limits especially when the government takes time to deliver its main promise: more jobs to the people. For instance, in by-elections held in the rural Copperbelt constituency of Mpongwe in February 2013 PF was able to win what was once an MMD stronghold and a personal fief of Gabriel Namulambe (MP from 2006) who was re-elected on a PF ticket this time. But his UPND rival came second with a small difference between the two. The novelty is that if MMD is crumbling UPND is likely to emerge as a credible opposition party as long as PF will fail in delivering its promises. This is a good news for the partisans of a
two-party system. A trend already envisaged by Rakner and Svåsand (2004). At that time it was the turn of PF.
Widespread poverty has proved to be a powerful driver for parties which want to challenge incumbents. However, establishing a correlation between participation and poverty levels proved to be impossible for the author to ascertain, due to the lack of homogeneous data18. It is likely that different factors impacted. If is true that poverty levels are lower in conurbation such as the Copperbelt that exhibited a greater turnout, it is also true that no significant differences in turnout in general between urban and rural districts have been found. The fact is that, the good record of participation in Copperbelt is likely due to other factors such as trade unionism. It remains to see how far in the case of Zambia rural voters are mobilized by patronage and ethnicity. Some indicators suggest that. First of all the dominant role played by certain parties in certain provinces. The identification between UPND and the Southern vote pattern seems to confirm that. Such identification could further be eased by the inclination of the province to vote against the government. Tonga have been almost always at the opposition even during authoritarian times. Such inclination might have contributed to a sort of relative deprivation feeling as some of the kind happened for the Luo in Kenya (Battera, 2013). However, local interviews by the author confirmed that poverty differences between provinces are largely ignored by local voters. Local voters complain about underdevelopment in their own region and may vote accordingly. Differences with the others are simply mirrored by the ethnic/provincial composition of governments: “not to have our own men in government is the first reason for our own underdevelopment”. So it is not really possible to read the synchronic differences of poverty levels data among provinces. The only thing we can do is make use of the !!!!!!!!!!!!!!!!!!!!!!!!!!!!!!!!!!!!!!!!!!!!!!!!!!!!!!!!!!!!!
18 By 2006 the way to define “poverty” has changed. Inconsistencies between the two periods hamper any workable comparison.
diachronic differences regarding single provinces. In other words, to look at poverty reduction in a single province and see if it has an impact on the likeability of its citizens to cast their vote. Generally speaking, poverty in rural provinces lightly decreased between 1991 and 2006 with a significant decrement only in Luapula (- 11%). However, also in so doing, it was impossible to ascertain any strict correlation between participation and poverty. So if it is true that Luapula had one of the lowest turnout in 2006 and 2008 and ranked in the last position as far as the electoral participation is concerned nothing can lead us to conclude that poor people in Zambia cast their votes to a lesser extent than educated and richer ones as it happens in more advanced countries. It is more likely that the poor state of infrastructures in this province prevented people to cast their vote.
A final remarks regard policies enacted by parties in power and their relation with their own constituents. Once in power PF has reduced its tough approach towards Chinese firms in the mining areas. Chinese investments are so important that such approach sounded unrealistic during the last two electoral campaign. However, PF government still maintains its stance in regards to its own agenda and priorities. Worrying about an increase of voices against alleged PF laxities towards the protection of the mine sector, in February 2013 the Zambian government seized control of a Chinese-owned coal mine because of safety lapses. In May, again government stopped an attempt by the Konkola Copper Mines to cut its workforce and tripartite talks between the government, the unions and the firm were announced. Finally, in May Sata’s government announced the removal of fertilizer subsidies. Such measure that was one of the pillars of former MMD policy will certainly have an effect in rural areas and their attitude towards the PF government. Such measure is intended to free resources to improve the living standards of people, especially urban ones. One of the pillars of the PF program.
Bibliography
Almond, G. & Verba, S. (1965). The Civic Culture: Political Attitudes and Democracy in Five Nations. Boston: Little Brown.
Bannon, A., Miguel, E. & Posner, D. N. (2004). Sources of Ethnic Identification in Africa. Afrobarometer paper, No. 44.
Battera, F. (2013). Ethnicity and Degree of Partisan Attachment in Kenyan Politics. Journal of Asian and African Studies, 48, 114-125.
Batty, F. (2011). Do Ethnic Groups Retain Homogenous Preferences in African Politics? Evidence from Sierra Leone and Liberia. African Studies Review, 54, 117-143.
Bossuroy, T. (2007). Voting in an African Democracy: Does Only Ethnicity Rule? An Empirical
Assessment on Contemporary Ghana. (
http://www.csae.ox.ac.uk/conferences/2008-EdiA/papers/305-Bossuroy.pdf).
Bratton, M. (1999). Political Participation in a New Democracy. Institutional Considerations From Zambia. Comparative Political Studies, 32, 549-588.
Bratton, M., Mattes, R. & Gyimah-Boadi, E. (2005). Public Opinion, Democracy, and Market Reform in Africa. Cambridge: Cambridge University Press.
Bratton, M., Bhavnani, R. & Tse-Hsin Chen (2011). Voting Intentions in Africa: Ethnic, Economic or Partisan?. Afrobarometer paper, No. 127.
Brusco, V., Nazareno, M. & Stokes, S. (2002). Selective Incentives and Electoral Mobilization. Chicago Center on Democracy Working Paper, No. 26.
Chandra, K.. (2007). Counting Heads: A Theory of Voter and Elite Behavior in Patronage Democracies. In Kitschelt, H. & Wilkinson, S. I. (eds.) Patrons, Clients, and Policies: Patterns of Democratic Accountability and Political Competition. Cambridge: Cambridge University Press, 84–109.
Conway, M. M. (2000). Political Participation in the United States. 3rd ed. Washington, DC: CQ Press.
Erdmann, G. (2007). Ethnicity, Voter Alignment and Political Party Affiliation - an African Case: Zambia. Giga Working Papers, n. 45.
Gunther, R. &Diamond, L. (2003). Species of Political Parties. A New Typology. Party Politics, 9, 167-99.
Horowitz, D. L. (1985). Ethnic Groups in Conflict. Berkeley, CA: University of California Press. Hulterström, K. (2004). In Pursuit of Ethnic Politics: Voters, Parties and Policies in Kenya and
Kuenzi, M. & Lambright, G. (2005). Party System and Democratic Consolidation in Africa’s Electoral Regimes. Party Politics, 11, 423–446.
Larmer, M. & Fraser, A. (2007). Of Cabbages and King Cobra: Populist Politics and Zambia’s 2006 Election. African Affairs, 106, 611-637.
Lindberg, S. I. & Morrison, M. K. C. (2008). Are African Voters Really Ethnic or Clientelistic? Survey Evidence from Ghana. Political Science Quarterly, 123, 95-122.
McCulloch, N., Baulch, B. & Cherel-Robson, M. (2000). Poverty, Inequality and Growth in Zambia During the 1990s. Paper Prepared for the 26th General Conference of The
International Association for Research in Income and Wealth. Cracow, Poland, 27 August – 2 September 2000.
Nichter, S. (2008). Vote Buying or Turnout Buying? Machine Politics and the Secret Ballot. American Political Science Review, 102, 19-31.
Norris, P. & Mattes, R. (2003). Does Ethnicity Determine Support for the Governing Party?. Afrobarometer Paper, no.26.
Posner, D. N. (2005). Institutions and Ethnic Politics in Africa. Cambridge: Cambridge University Press.
Posner, D. N. (2004). The Political Salience of Cultural Difference: Why Chewas and Tumbukas Are Allies in Zambia and Adversaries in Malawi. American Political Science Review, 98, 529-545.
Posner, D. N. & Simon, D. J. (2002). Economic Conditions and Incumbent Support in Africa’s New Democracies. Evidence from Zambia. Comparative Political Studies, 35, 313-336. Rakner, L. (2003). Political and Economic Liberalisation in Zambia 1991-2001. Stockholm:
The Nordic Africa Institute.
Rakner, L. & Svåsand, L. (2004). From Dominant to Competitive Party System. The Zambian Experience 1991-2001. Party Politics, 10, 49-68.
Rosenstone, S. J. & Hansen, J. M. (1993). Mobilization, Participation, and Democracy in America. New York: Macmillan.
Scarritt, J. R. (2006). The Strategic Choice of Multiethnic Parties in Zambia's Dominant and Personalist Party System. Commonwealth and Comparative Politics, 44, 234-256.
Szeftel, M. (1982). Political Graft and the Spoils System in Zambia: The State as a Resource in itself. Review of African Political Economy, 24, 4-21.
Wolfinger, R. E., & Rosenstone, S. J. (1980). Who Votes? New Haven, CT: Yale University Press.
World Bank (2004). The Republic of Zambia. Poverty Reduction Strategy Paper – Progress Report Joint Staff Assessment. Report No. 29048-ZA. Washington.
World Bank (2013). Using Social Safety Nets to Accelerate Poverty Reduction and Share Prosperity in Zambia. Washington.