of Brazil
Andréa Ferreira da Silva
Universidade Federal da Paraíba / Programa de Pós-Graduação em Economia Paraíba — PB / Brazil
Janaildo Soares de Sousa
Universidade Federal do Ceará / Programa de Pós-Graduação em Desenvolvimento e Meio Ambiente Fortaleza — CE / Brazil
Jair Andrade Araujo
Universidade Federal do Ceará / Pós-Graduação em Economia Rural Fortaleza — CE / Brazil
his paper aims to present new perspectives for the understanding on multidimensional poverty in northern Brazil in the years 2006-13, in order to assist the government in developing policies focused on ighting poverty and advancing the development process. he study used a methodology built by Bourguignon and Chakravarty (2003), which presents an alternative way of measuring the multidimensionality of poverty. he data was collec-ted from the National Household Sample Survey (PNAD) and the results of six dimensions analyzed revealed a reduction in the proportion of multidimensional poor of the northern population, from 30.71% in 2006 to 25.79% in 2013. As for isolated analysis of metropolitan regions in urban and rural areas, it was found that poverty was more intense in rural areas.
Keywords: multidimensional poverty; deprivation; gap.
Evidências sobre a pobreza multidimensional na região Norte do Brasil
O presente artigo tem como objetivo apresentar novas perspectivas para a compreensão da pobreza multidimen-sional na região Norte do Brasil nos anos de 2006 a 2013, com a inalidade de auxiliar a administração pública no desenvolvimento de políticas focadas no combate à pobreza e na aceleração do processo de desenvolvimento. Foi utilizada uma metodologia construída por Bourguignon e Chakravarty (2003), que apresenta uma forma alter-nativa de medir a multidimensionalidade da pobreza. Por meio de dados construídos da Pesquisa Nacional por Amostra de Domicílio (PNAD), os resultados das seis dimensões analisadas revelaram uma redução da proporção de pobres multidimensionais da população nortista, de 30,71% em 2006, para 25,79% em 2013. Para as análises isoladas das regiões metropolitana, urbana e rural, veriicou-se que a pobreza foi mais intensa na região rural. Palavras-chave: pobreza multidimensional; privação; gap.
Pruebas en pobreza multidimensional del norte de Brasil
Este artículo tiene como objetivo presentar nuevas perspectivas para la comprensión de la pobreza multidimensional en el norte de Brasil, en los años 2006-13, con el in de ayudar al gobierno en el desarrollo de políticas centradas en la lucha contra la pobreza y la aceleración del proceso de desarrollo. Se utilizó una metodología construida por Bourguignon y Chakravarty (2003), que presenta una forma alternativa de medir la multidimensionalidad de la pobreza. Construido a partir de datos de la Encuesta Nacional de Hogares por Muestreo (PNAD), los resultados de las seis dimensiones analizadas revelaron una reducción en la proporción de pobres multidimensionales de la población del norte, 30,71% en 2006 a 25,79% en 2013. Para el análisis aislado de las regiones metropolitanas, urbanas y rurales, se encontró que la pobreza es más intensa en el campo.
Palabras clave: pobreza multidimensional; la privación; gap.
DOI: http://dx.doi.org/10.1590/0034-7612160773
1. INTRODUCTION
Since the start of the years 2000 some Brazilian regions have revealed an increasing rise in the Gross Domestic Product (GDP). he Southeast, South, Midwest and Northeast regions of Brazil were out-standing in the participation of the Brazilian GDP formation in 2000, while the North only contrib-uted with 4.6% (Ipea, 2014). It was noted that the Northern region’s small share relects its economic and social reality.
According to Silva and partners (2014), the regions with the highest percentage of multidimen-sional poor are North and Northeast Brazil for the period 2006-12. In 2012, North Brazil had 26.2% of its population in a state of multidimensional poverty, even when this region showed the highest reduction rate of 4.51% over this period. Lacerda (2009) states that in Brazil the poverty rate has a strong regional component since, regardless of the indicators used, poverty is worst in the North and Northeast.
Since the mid-1980s, having as a reference the economist Amartya Sen, poverty is regarded as a multidimensional phenomenon; in other words, it deines who are the poor of a certain population or region. In addition to analyzing data revealed by the income of those people, cultural, political and social characteristics that inluence the individuals’ wellbeing should also be considered. he need now arises to extend the scope of the analyses of poverty in the North region, not only from the income viewpoint, but also focusing on the study of the basic needs and increasing the deinition of the multidimensional nature of poverty.
he methodology addressed herein is originally found in Bourguignon and Chakravarty (2003) and detailed by Mideros (2012). It is an alternative for measuring poverty specifying a poverty line for each dimension. he diferential of this study is that it considers — in addition to the various indica-tors measuring multidimensional poverty, for example the education dimension — the prerogatives of the Education Guidelines and Framework Act (Law no 9.394/1996), which determines a period of minimum number of years of study for each age group. he study also updates the longstanding discussion on poverty in the North region, but from a fresh original viewpoint.
With regard to the database, the data was taken from the National Household Sample Survey (PNAD) for the years 2006 to 2013. he reason for choosing this period was because of the data published by the Institute for Applied Economic Research (Ipea), which revealed that in 2013 the proportion of individuals in dire poverty in Brazil increased for the irst time in 10 years, estimating that more than 10 million people lived in a situation of abject misery, although in recent decades the Brazilian public administration has designed and implemented diferent anti-poverty programs in Brazil, with emphasis on formulating and implementing policies to redistribute income.
he main purpose of this article is to evidence the current levels of multidimensional poverty in North Brazil for the years 2006-13, while the study is designed as a tool to assist public administration to develop policies focusing on ighting poverty and advancing the development process.
he article is divided into ive sections. First, in addition to this introduction, section 2 will address the concepts of multidimensional poverty and approaches to it. he third section provides the database, construction of the dimensions used and speciication of the methodology. In the fourth section the results of the model are analyzed and inally, the last section addresses the inal main considerations.
2. MULTIDIMENSIONAL POVERTY: ADDRESSING THE BASIC NEEDS AND CAPABILITIES
Poverty is a topic that has been increasingly discussed in social sciences and particularly in eco-nomic science. Its study, linked to the question of ecoeco-nomic development, has advanced towards a more complex view of the concept and measurement of methods. All deinitions of poverty contain some discretionary and subjective element. Diferent concepts require diferent methods and measurement indicators and, therefore, result in identifying diferent individuals as poor. It is based on the principle that the idea of poverty refers to some kind of deprivation, which could only be material or include cultural and social elements, in terms of a person or household’s available resources.
hus, since the 1970s investigations have proliferated on the adoption of the one-dimensional attitude to the study of poverty. Since then the idea was to incorporate non-monetary and particularly political and social dimensions to poverty to its measurement methods (Salama and Destremau, 1999). his shit intensiied, which naturally permitted the multidimensional focus on poverty to gain space in the debate, albeit not predominant.
Bourguignon and Chakravarty (2003) say that the concept of multidimensional poverty came into being, in fact, when the individuals, social observers and policymakers intend to deine a limit of poverty in each dimension, such as, for example, income, health, education and so on. herefore, poverty may be considered a failure in achieving an acceptable minimum level of diferent monetary and non-monetary attributes essential for a sustainable standard of living.
In the multidimensional study of poverty, it is worth stressing the importance of two approaches, namely: addressing the basic requirements and capabilities. he irst came to the fore in the mid-1970s, showing diferent concepts in a wide variety of areas, meaning not only the idea of hardship or shortage, but also what is indispensible or inevitable.
In the concept of Gough and Doyal (1991), the approach to the basic needs is consolidated in the occurrence of serious harm to the material life of humans. “Serious harm” is understood to be the possibility that it is an impediment to human beings both in their physical life and social participation.
Likewise, Max-Neef (1998) states that the basic need is an essential condition in the natural functioning of life and what happens around it. he author claims that human beings share the same needs, both material and immaterial, but each in their own culture or diferent historic pe-riod. hus, it is necessary to diferentiate the basic requirements of the strategies adopted in order to fulill them.
would be unable to enjoy a remotely decent life, namely: drinking water, sewage network, garbage collection, access to public transportation and education, which are indispensable commodities for individuals to be able to lead a healthy life and have chances to be included in society.
Rocha (2006) states that this approach involves going beyond those deinitions of food or nutrition to, thus, include a more widespread notion of human needs, such as education, sewage and housing, for example. his idea of poverty covers other aspects of individuals’ daily lives by the mere fact that they not only feed but also relate and work, having therefore a social life.
In relation to the approach to capabilities, the 1980s marks the start of this discussion. Lacerda (2009) highlights the works by economist Amartya Sen, which are a point of inlection in formu-lating this theory. Sen (1993) explores a particular line of welfare, demonstrating its advantages for human beings to accomplish valuable actions or perform appropriate states of existence, being evident the concern of this approach against poverty. It therefore brings major contributions to the theory of social wellbeing and socioeconomic development, based on the principles of free-dom and equality.
Since it is emphasized as a non-utilitarian approach to poverty, the approach to capabilities is a particular angle of development, according to which freedom is a basic substantive element in people’s lives. It is understood that individuals have the right to practice their freedom and make their rights respected, and it looks to analyze the diferent forms of access to private and collective resources; in other words, emphasis is not only on social rights but also on civil and political rights (Silva, 2009).
According to Kuklys and Robeyns (2005), the approach to capabilities clearly operates at two levels. he irst concerns achieving wellbeing, which is measured in terms of “functionings”. Func-tionings relect a variety of happenings or commodities that an individual may consider valuable to do or have. he latter concerns the potential of wellbeing that is estimated in terms of “capabil-ities”. he target must be the capability of individuals to fulill minimally appropriate important functionings to a certain level, and also to meet the human needs beyond the historical cultural diferences (Silva, 2009). Bourguignon and Chakravarty (2003) believe that wellbeing is intrinsically multidimensional from the viewpoint of capabilities and functionings. his is because functionings are precisely motivated by attributes such as the capability to read and write, life expectancy, and so on, and not only by income.
he approach to capabilities is nothing but an approach regarding development, which transfers the focus of analyzing accumulation of capital to the analysis of individuals and their set of capabilities. And income is now only one of the means and not the end of development.
Continue
In this context and considering the importance of the approaches to basic human needs and capa-bilities to eliminate poverty and advance the development process, this study will address a number of indicators to deine multidimensional poverty in North Brazil in the period 2006-13.
3. METHODOLOGY
3.1 DATABASE AND BUILDING DIMENSIONS
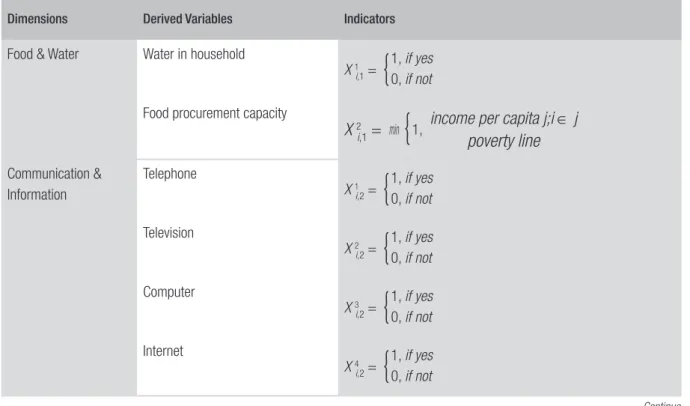
he source of data used for building the indicators and compound dimensions in multidimensional poverty was PNAD for the years 2006 to 2013, except 2010, a census year. his paper considers six dimensions in the preparation of a multidimensional indicator, as shown in table 1. Added to the six dimensions are are 22 variables derived from the original variables taken from the PNAD. hey were chosen based on the review of the literature on the subject of poverty.
Table 1 shows the indicators Xl
i,k constructed for i={1,2,...,n} people, j={1,2,...,h} households and
k={1,2,...,m} dimensions. All indicators have a maximum value of 1 (not deprived) and a minimum of 0 (total deprivation). he indicators are deined between 0 and 1 to reduce the problems of discon-tinuity, but are restricted by the available information. In order to obtain diferent sets of categorical data diferent equidistant levels are established (that is, the indicators are ordinal).
TABLE 1 DIMENSIONS AND INDICATORS OF MULTIDIMENSIONAL POVERTY
Dimensions Derived Variables Indicators
Food & Water Water in household
X 1
i,1 =
{
1, if yes 0, if notFood procurement capacity
X 2
i,1 = min
{
1,income per capita j;i ∈ j
poverty line
Communication & Information
Telephone
X 1
i,2 =
{
1, if yes 0, if notTelevision
X 2
i,2 =
{
1, if yes 0, if notComputer
X 3
i,2 =
{
1, if yes 0, if notInternet
X 4
Dimensions Derived Variables Indicators
Education Primary Education
X 1
i,3 =
{
1, if 1 – 5 years schooling at the proper age 0, if not
Incomplete Elementary Education X 2
i,3 =
{
1, if 4 – 9 years schooling at the proper age 0, if not
Complete Elementary Education X 3
i,3 =
{
1, if 8 – 14 years schooling at the proper age 0, if not
Incomplete Secondary Education X 4
i,3 =
{
1, if 12 – 15 years schooling at the proper age 0, if not
Complete Secondary Education X 5
i,3 =
{
1, if over 15 years schooling at the proper age 0, if not
Proportion of children in school
X 6
i,3 =
{
1, se proporção > 1 0, if not
Living Conditions Type of dwelling
X 1
i,4 =
{
1, if own house
0,5, if still paying for own house 0, if other
Lighting
X 2
i,4 =
{
1, if adequate 0, if not
Wall material
X 3
i,4 =
{
1, if adequate 0, if not
Roof material
X 4
i,4 =
{
1, if adequate 0, if not
No, people per bedroom
X 5
i,4 =
{
1, if > 3 0, if notHealth Sewage system
X 1
i,5 =
{
1, if adequate 0, if not
Sanitary condition
X 2
i,5 =
{
1, if adequate 0, if not
Waste disposal
X 3
i,5 =
{
1, if adequate 0, if not
Labor and Demography Casual labor
X 1
i,6 =
{
1, if not 0, if yesDependency ratio per household X 2
i,6 =
{
1, if proportion < 1 0, if not
Dimension 1 — Food and water: the water variable measures if the home has a proper water supply. he second, however, indicates the food purchasing power,1 using the monetary conditions, making a ratio of the individual’s per capita income with the income poverty line. he poverty lines used were from the Institute for Labor and Society Studies (Iets), prepared by Sonia Rocha based on the National Household Budget Survey (POF).
Dimension 2 — Communication and information: considers as private individuals those with-out information media for life in today’s society. he variables adopted in the study are telephone, television, computer and Internet.
Dimension 3 — Education: is addressed as an innovation for measuring multidimensional poverty in North Brazil. It takes into consideration the Education Guidelines and Framework Act (Law no 9.394/1996), providing the guidelines and framework of national education, in which it states that there is a minimum schooling level required for a certain age group.
he education dimension is divided into six variables, referring to the appropriate age for each learning stage: primary education, incomplete and complete elementary education, and incomplete and complete secondary education. hese categories took into account the minimum number of years required to complete the levels of education. When including this variable in the indicator the idea was to record not only the average school year per student but also the “educational context” in which the student is included. he proportion of children at school refers to the total number of children in the household attending school. According to art. 2, Law no 8.069/1990, someone not yet 12 years old is considered a child and someone between 12 and 18 years of age is an adolescent.
Dimension 4 — Living conditions: in its analysis the following variables were used: type of dwelling, lighting, wall material, roof material and number of people per bedroom. Although these variables may be discussed regarding their use in the poverty analysis, it is found that the absence of proper living conditions is conigured as an important deprivation type, as well as abusing the social rights guaranteed by the Brazilian Constitution.
Another relevant point of the study raised in this section is dimension 5 — Health. Since there are no speciic variables able to provide information regarding this dimension. Proxies will be used to study it, as follows: sewage system, sanitary condition and waste disposal. he reason for this choice was to understand that the lack of access or inappropriate access to any of these variables could cause serious harm to the individual’s health, especially with regard to basic health.
Lastly, dimension 6 — Labor and demography: analyzes casual labor and dependency ratio per household. he status of casual labor was classiied when the worker was not insured under social security or contributed to another social security institute and, for this reason, had no protection against so-called social risks (unable to work).
3.2 SPECIFICATION OF METHODOLOGY
According to Bourguignon and Chakravarty (2003), a simple way of deining poverty and count-ing the number of poor is to consider the possibility of becount-ing poor in any dimension of poverty. A multidimensional focus deines poverty through a vector of particular characteristics (Tsui, 2002).
1 However, this indicator has some restrictions, namely: it does not guarantee measuring the access to suicient quality food, since the
Broadly speaking, an index of multidimensional poverty can be addressed as a function:
P (X,z): M×z→R1
+ (1)
where X ∈M is a matrix of attributes, such as income, education, health, (n x m), for i = {1,2, ..., m} people and k = {1,2, ... . m} dimensions, and z∈Z is a vector of limits or “minimally acceptable levels” for diferent attributes (Bourguignon and Chakravarty, 2003).
An index can be built using at least three diferent methodological approaches: the axiomatic approach, the fuzzy group theory and the theory of information (Maasoumi and Lugo, 2008).
Based on Bourguignon and Chakravarty (2003), a general multidimensional index can be broken down and fulills the necessary axioms; it can be deined as P (X, z) = 1n
S
ni=1f (Xî,1, ..., Xî,m).By a bindingapproach to deine f (∙) and using a variation in the index of Foster, Greer and horbecke (1984) to capture the severity of poverty, multidimensional poverty can be measured as follows:
P (X,z) = 1
n
∑
i = 1
f
[
1n
∑
i = 1
Xî,k2
]
(2)n m
In (2) it is assumed that the dimensions are not replaceable but interrelate with the general level of poverty, which is consistent with an approach based on dimensions of wellbeing. At the individual level, more weight is given to the dimensions that show a wider deprivation gap and, subsequently, more weight is attributed to people with higher levels of deprivation. his causes the index to be
sensitive to the distribution of poverty. Poverty at an individual level is deined by: Pi 1
n
∑
i = 1
Xî,k2,
m ,
with a maximum value of 1 (total poverty) and a minimum of 0 (no poverty).
For each dimension the incidence indices (proportion of poor) and the deprivation levels for diferent regions and demographic groups can be estimated. For the incidence index it is considered that anyone below the limit in at least one variable endures deprivation (focus of unity), based on the following rule:
Endures deprivation =
{
Yes;if Xî,k > 0No; if Xî,k = 0 (3)
he deprivation level for each person in each indicator is measured directly by Xî
i,k, although the
individual deprivation level in each dimension is determined by the function of aggregation gk as follows:
Xi,k =1
p
∑
l = 1
Xl i,k
p (4)
where the indicators cluster for each dimension with the following function: Xi,k = gk (Xl
i,k, ..., Xip,k) for
variables l = {1, ..., p}, where function gk (.) is speciic for each dimension k. All indicators have the maximum value of 1 (achieved level) and a minimum value of 0 (total deprivation), this deinition being used to reduce the problems of discontinuity.
X^
k =
1
∑
ni = 1
Xî,k
n (5)
he level of overall deprivation (Xî,k) is measured using (4) in each dimension and is deined as the level of average deprivation between the variables. To identify the level of deprivation of each di-mension, the indices are reformulated using the formula: Xî,k = 1 – Xi,k, where the level of deprivation
Xî,kis interpreted as the relative diference between the individual level of Xi,k and the limit of depri-vation Zk = 1, with a maximum value of 1 (total deprivation) and a minimum of 0 (no deprivation). By using (5) it is possible to break down the deprivation level per region and demographic group.
4. RESULTS AND DISCUSSION
At irst, the results of the degrees of deprivation in each indicator and respective dimensions are an-alyzed from 2006 to 2013. he gaps, meaning how far the poor are from a poverty limit, will also be addressed for each dimension in North Brazil, between the areas (metropolitan, urban and rural) and groups: gender, age group and race. hen, multidimensional poverty is analyzed within the region and the groups in the study.
4.1 INCIDENCE OF DEPRIVATION IN NORTH BRAZIL: INDICATORS AND THEIR DIMENSIONS
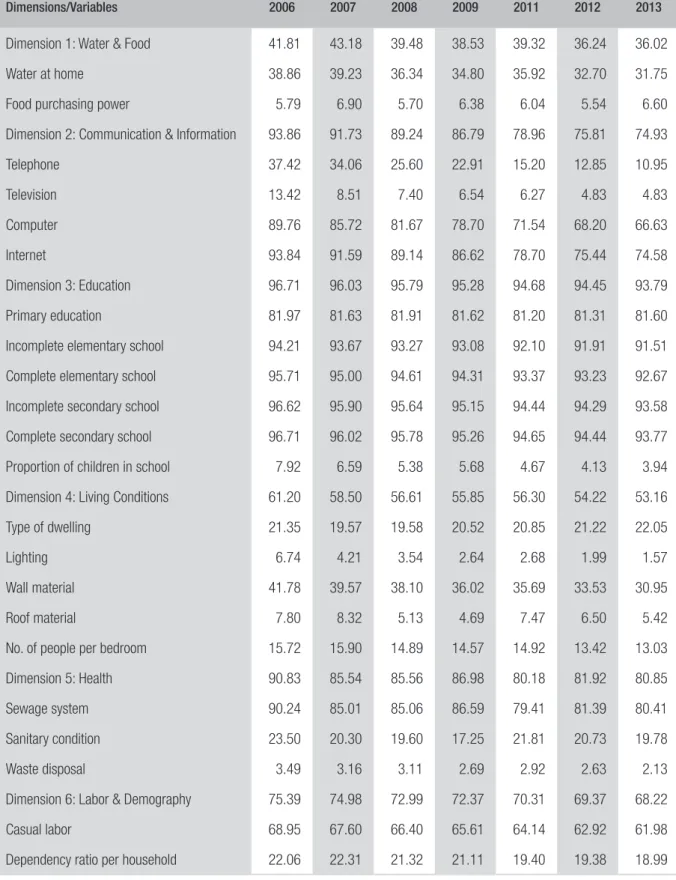
Table 2 shows the incidence of deprivation in the northern region of Brazil, from 2006 to 2013, among the indicators and dimensions. he water and food dimension is deined by two variables: water in the home and food purchasing power. Considering that water in the home is deined as a basic need for human survival, its provenance in households measures the deprivation, or otherwise, of the population. If the supply is from the general distribution network, the household is considered not deprived. However, if it comes from a well or spring, or other source, it is called asset-deprived. he percentage of people who do not have a drinking water supply from the general distribution network in their homes has dropped from 38.86% in 2006 to 31.75% in 2013.
On the other hand, the food purchasing power variable measures the monetary deprivation (that is, income) as a substitute for food deprivation. Households, with a per capita income below the pov-erty line, are considered deprived since they are unable to consume the minimum nutritional needs. hus, the percentage of people with monetary deprivation rose from 5.79% to 6.6% over the same period. It is worth noting that, in the dimension as a whole, the impact of the reduction was greater altogether than when the indicators are analyzed separately. here was a 5.79% drop from 41.81% in 2006 to 36.02% in 2013 in multidimensional poverty in North Brazil in the water and food dimension.
his trend towards poverty in the above dimension was also veriied in Brandolini and D’Alessio (1998), Carvalho, Kerstenetzky and Del-Vecchio (2007), Ottonelli and Silva (2014). So, even when the results difer by adopting diferent methodologies, they corroborate with the study to the extent that they reached the conclusion that the lack of access to water and income is one of the main causes of poverty, while income is the worst deprivation sufered by the people.
deprivation, nor inform anything about the quality of data that the households access. Although a full analysis of these criteria is necessary, it is beyond the scope of this investigation.
Table 2 shows that, between 2006 and 2013, the poverty incidence trended downward in all indi-cators. hose showing the highest downward impacts of deprivation were: telephone with a 26.47% drop from 2006 to 2013; computer, a 23.13% drop for the same period; and Internet access down 19.26%. In 2013, the highest indices of deprivation recorded were for Internet access (74.58%) and computer (66.63%), while the lowest levels of deprivation are the telephone (10.95%) and television (4.83%). As can be seen, when addressing deprivation of Internet and computers, although the de-grees of both have shown a fall in the period, even so they are still considerably high. It is, therefore, possible that the drop in deprivation is correlated to the technology spread in recent years, which made it easier to access new communication technologies.
he highest deprivation indicators concentrate on the education dimension. Precisely because the survey takes into consideration the adoption of the Education Guidelines and Framework Act (Law no 9.394/1996), which provides the guidelines and framework of national education. In prima-ry school, as the Act determines, children under ive years old could attend ive years maximum of preschool attendance. In incomplete elementary education, children in the 6-10 age group should have four to nine years attendance in order not to be considered deprived. In complete elementary education, 11 to 14-year olds would be completing elementary school ater around eight to 14 years’ attendance. However, in incomplete secondary education pre-adolescents around 15-17 years old would be completing secondary school with 12-15 years attendance. Lastly, in complete secondary education young adults over 18 years old should have at least 15 years schooling to be able to achieve a good education and skills to enter the labor market and not be considered education-deprived. Finally, the proportion of children at school refers to all children in the household attending school.
In the education dimension, as can be seen in table 2, there is a slight drop in deprivation: it dropped from 84.93% in 2006 to 83.10% in 2013. he schooling that dropped most in deprivation was complete elementary education, 3.04% down from 2006 to 2013. Close behind was incomplete and complete secondary education with 3.04% and 2.94%, respectively.
his evidence corroborates the analyses by Sousa (2015), Ottonelli and Silva (2014) and Silva (2015), who studied multidimensional poverty in the Northeast, Paraíba state and Brazil, respec-tively. he above studies found that education is one of the dimensions that most contribute to the propensity of poverty. hus, according to Sen (2000), people need relevant functionings and these do not happen only at the income level but rather through access to health, education, living conditions and other relevant aspects.
TABLE 2 INCIDENCE OF DEPRIVATION IN NORTH BRAIL, 2006-13 (%)
Dimensions/Variables 2006 2007 2008 2009 2011 2012 2013
Dimension 1: Water & Food 41.81 43.18 39.48 38.53 39.32 36.24 36.02
Water at home 38.86 39.23 36.34 34.80 35.92 32.70 31.75
Food purchasing power 5.79 6.90 5.70 6.38 6.04 5.54 6.60
Dimension 2: Communication & Information 93.86 91.73 89.24 86.79 78.96 75.81 74.93
Telephone 37.42 34.06 25.60 22.91 15.20 12.85 10.95
Television 13.42 8.51 7.40 6.54 6.27 4.83 4.83
Computer 89.76 85.72 81.67 78.70 71.54 68.20 66.63
Internet 93.84 91.59 89.14 86.62 78.70 75.44 74.58
Dimension 3: Education 96.71 96.03 95.79 95.28 94.68 94.45 93.79
Primary education 81.97 81.63 81.91 81.62 81.20 81.31 81.60
Incomplete elementary school 94.21 93.67 93.27 93.08 92.10 91.91 91.51
Complete elementary school 95.71 95.00 94.61 94.31 93.37 93.23 92.67
Incomplete secondary school 96.62 95.90 95.64 95.15 94.44 94.29 93.58
Complete secondary school 96.71 96.02 95.78 95.26 94.65 94.44 93.77
Proportion of children in school 7.92 6.59 5.38 5.68 4.67 4.13 3.94
Dimension 4: Living Conditions 61.20 58.50 56.61 55.85 56.30 54.22 53.16
Type of dwelling 21.35 19.57 19.58 20.52 20.85 21.22 22.05
Lighting 6.74 4.21 3.54 2.64 2.68 1.99 1.57
Wall material 41.78 39.57 38.10 36.02 35.69 33.53 30.95
Roof material 7.80 8.32 5.13 4.69 7.47 6.50 5.42
No. of people per bedroom 15.72 15.90 14.89 14.57 14.92 13.42 13.03
Dimension 5: Health 90.83 85.54 85.56 86.98 80.18 81.92 80.85
Sewage system 90.24 85.01 85.06 86.59 79.41 81.39 80.41
Sanitary condition 23.50 20.30 19.60 17.25 21.81 20.73 19.78
Waste disposal 3.49 3.16 3.11 2.69 2.92 2.63 2.13
Dimension 6: Labor & Demography 75.39 74.98 72.99 72.37 70.31 69.37 68.22
Casual labor 68.95 67.60 66.40 65.61 64.14 62.92 61.98
Dependency ratio per household 22.06 22.31 21.32 21.11 19.40 19.38 18.99
An interesting aspect in the next dimension to be analyzed is that the basic sanitation conditions were used as proxy to analyze the health dimension. he reason was that the lack of access, or in-appropriate access, to any of these sanitary variables could cause serious harm to a person’s health, especially concerning basic health. Table 2 shows that this dimension decreased in its deprivation from 90.83% in 2006 to 80.85% in 2013, that is, a 9.98% drop in the period analyzed. his decrease can, therefore, be explained because there was also a drop in all indicators of the dimension. In sewage, the indicator with the highest impact on the reduced deprivation was 9.83% down. Moreover, the sanitary condition and waste disposal showed a drop of 3.72% and 1.36%, respectively, from 2006 to 2013. Studies by Brandolini and D’Alessio (1998), Carvalho, Kerstenetzky and Del-Vecchio (2007), Diniz and Diniz (2009) also conirm these results.
Lastly, in the labor and demography dimension casual labor was described for the worker not insured under social security or not contributing to another social security institute. De-mography refers to the dependency ratio of members of a household, namely those under 14 and over 60 years old. Table 2 shows the deprivation rate for each indicator. When analyzing the dimension in general, more than 50% of the population suffers deprivation of a decent job, that is, 61.98% in 2013 worked as casual laborers. Although there has been a 6.97% decrease from 2006 to 2013, quite a high deprivation rate still remains. On the other hand, the dependency ratio shows a deprivation rate considered low, 18.99% of the population in 2013 showing some dependency ratio.
Along the same lines, Souza, Salvato and França (2013) studied income inequality among the groups in Brazil and regions. However, they used PNAD data for the period 2001-2011. he results showed that, in fact, there is still wage discrimination between gender and ethnicities. With regard to the age group, children and the elderly were also included, with a higher level of deprivation in this dimension. When race is analyzed there was greater exclusion from the labor market in the non-white population.
4.2 DEPRIVATION GAPS
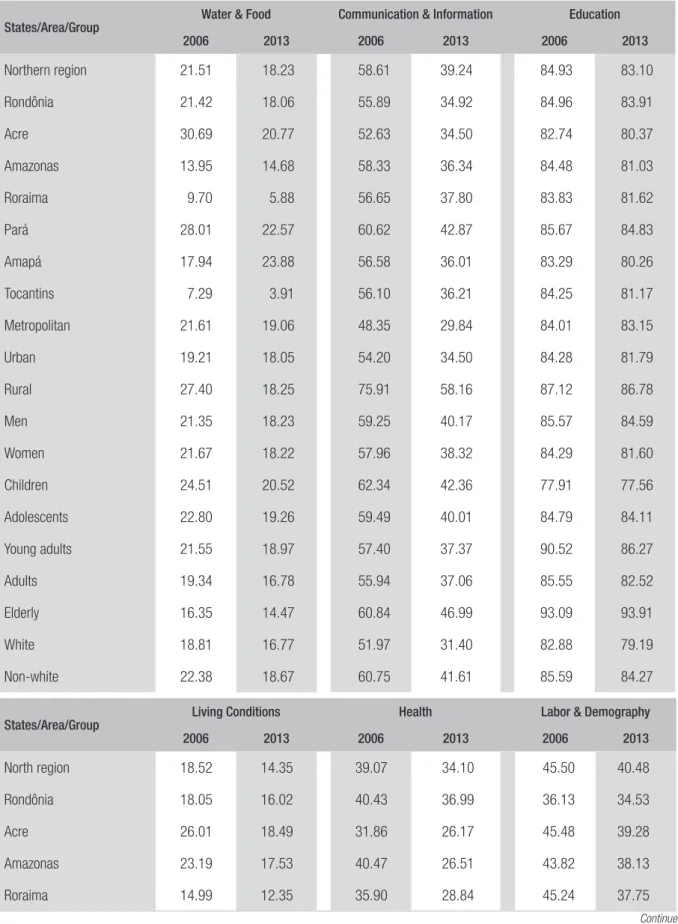
he deprivation gap is shown in table 3 by dimensions and demographic groups. Figures show the average diference for diferent areas and population groups. As discussed in section 4, which ad-dressed methodology, the deprivation gaps represent the distance between the poor and a certain limit of total poverty, varying between 0 and 1 and calculated for each dimension.
It is noticeable that poverty in the food and water dimension (table 3) is a problem, especially in the metropolitan areas of North Brazil. In 2013, the deprivation gap in the metropolitan area was 19.06%, and even wider when compared to the rural and urban regions, in which there was a gap in deprivation records of 18.25% and 18.05%, respectively, for the same period.
population groups, the gap in relation to poverty was not so signiicant. However, there was a decrease in all groups studied, from 2006 to 2013.
In the communication and information dimension in table 3, the gap was narrowed in all states, areas and groups between 2006 and 2013. Concerning the states, Pará, Roraima and Amazonas showed the widest deprivation gaps for communication and information in 2013 — 42.87%, 37.8% and 36.34%, respectively, and the state of Acre highlighted with the smallest deprivation gap of 34.5%. Similarly, both in 2006 and 2013, the deprivation gap of the rural population in North Brazil was much wider than in the metropolitan and urban regions. In 2013, the rural area had a deprivation gap of 58.16%, while the metropolitan and urban regions had 29.84% and 34.5%, respectively. It is also found that deprivation among men is greater than among women in relation to this dimension. Looking at the age group, deprivation was highest among the elderly and children, 46.99% and 42.36%, respectively in 2013. he deprivation gap in relation to the race group was 41.61% in 2013, and wider for the non-whites.
In relation to the education dimension, as shown in table 3, concerning the northern states, emphasis was on Pará, 84.83%, Rondônia, 83.91%, and Roraima, 81.62%, with the highest deprivation rates in 2013, and Amapá with the smallest deprivation gap (80.26%). In terms of areas, a wider gap is found in the rural area, when compared to the metropolitan and urban areas, no different from what was stressed in the other dimensions. It showed a deprivation gap from 87.12% in 2006 to 86.78% in 2013. And in the metropolitan and urban areas a decrease in deprivation was also observed in education, over the period under study. There was also a decrease in the number of men and women: women showed a smaller deprivation of 81.6% in 2013 compared to the men at 84.59%. It is noted that the average deprivation gap in education is 2.99 times higher for men than for women. With regard to the age groups, they all decreased in deprivation, and the young adult group having the greatest decrease of 4.25% from 2006 to 2013, and the children’s group with the smallest gap. In the race group, deprivation among whites was 79.19%, and among non-whites 84.27%. It is found that the impact of the drop from 2006 to 2013 also occurred in the white race group, with 3.69% down compared to only 1.32% in the non-white race.
TABLE 3 NORTH: DEPRIVATION GAP PER DIMENSION, 2006 AND 2013 (%)
States/Area/Group
Water & Food Communication & Information Education
2006 2013 2006 2013 2006 2013
Northern region 21.51 18.23 58.61 39.24 84.93 83.10
Rondônia 21.42 18.06 55.89 34.92 84.96 83.91
Acre 30.69 20.77 52.63 34.50 82.74 80.37
Amazonas 13.95 14.68 58.33 36.34 84.48 81.03
Roraima 9.70 5.88 56.65 37.80 83.83 81.62
Pará 28.01 22.57 60.62 42.87 85.67 84.83
Amapá 17.94 23.88 56.58 36.01 83.29 80.26
Tocantins 7.29 3.91 56.10 36.21 84.25 81.17
Metropolitan 21.61 19.06 48.35 29.84 84.01 83.15
Urban 19.21 18.05 54.20 34.50 84.28 81.79
Rural 27.40 18.25 75.91 58.16 87.12 86.78
Men 21.35 18.23 59.25 40.17 85.57 84.59
Women 21.67 18.22 57.96 38.32 84.29 81.60
Children 24.51 20.52 62.34 42.36 77.91 77.56
Adolescents 22.80 19.26 59.49 40.01 84.79 84.11
Young adults 21.55 18.97 57.40 37.37 90.52 86.27
Adults 19.34 16.78 55.94 37.06 85.55 82.52
Elderly 16.35 14.47 60.84 46.99 93.09 93.91
White 18.81 16.77 51.97 31.40 82.88 79.19
Non-white 22.38 18.67 60.75 41.61 85.59 84.27
States/Area/Group
Living Conditions Health Labor & Demography
2006 2013 2006 2013 2006 2013
North region 18.52 14.35 39.07 34.10 45.50 40.48
Rondônia 18.05 16.02 40.43 36.99 36.13 34.53
Acre 26.01 18.49 31.86 26.17 45.48 39.28
Amazonas 23.19 17.53 40.47 26.51 43.82 38.13
States/Area/Group
Living Conditions Health Labor & Demography
2006 2013 2006 2013 2006 2013
Pará 17.55 13.25 39.49 38.07 48.41 43.45
Amapá 17.49 15.23 36.33 36.10 44.51 40.54
Tocantins 9.63 8.49 37.07 32.61 46.60 38.90
Metropolitan 10.60 7.84 25.26 20.64 43.76 37.28
Urban 16.05 13.35 34.22 27.78 45.40 39.84
Rural 29.46 20.94 59.57 59.86 46.75 44.13
Men 18.87 14.68 39.76 34.94 45.25 40.33
Women 15.17 14.01 38.38 33.26 45.75 40.62
Children 22.41 18.25 41.01 35.83 53.77 47.26
Adolescents 19.39 15.68 40.61 35.77 43.81 39.79
Young adults 18.43 14.76 38.07 32.80 40.33 34.79
Adults 16.02 12.24 37.79 33.23 41.02 36.34
Elderly 12.62 9.52 38.02 34.40 63.65 64.04
White 15.19 11.98 36.14 29.88 41.68 37.02
Non-white 19.60 15.06 40.02 35.37 46.74 41.52
Source: Elaborated by the authors based on PNAD data.
Lastly, considering the deprivation gap in the labor and demography dimension, every state in North Brazil showed decreases in the deprivation gap in table 3. However, the data also point to a high percentage of workers who do not have a decent job. he states of Pará, Amapá and Tocantins had the highest deprivation gap in the labor and demography dimension. Rondônia and Roraima, on the other hand, are those with the lowest rates in the analysis. he rural area was highlighted among the others for having increased the labor and demography gap from 46.75% in 2006 to 44.13% in 2013, showing a 2.62% drop in the period in question. he metropolitan area also had a 6.48% drop between 2006 and 2013. Likewise, the urban area dropped from 45.4% in 2006 to 39.84% in 2013. In contrast to all other dimensions, in the labor and demography dimension, women this time around presented a larger deprivation gap than the men, evidencing moreover the diference in the labor market between men and women. Despite the decrease, the deprivation among men and women in 2013 is still considered high at 40.62% for women and 40.33% for men. In the age group dimension, the results were expected, the largest deprivation for children and the elderly, since they are dependents and do not work; children with a 47.26% deprivation and the elderly with 64.04%. he group of young adults had the smallest gap, with 34.79% in 2013. he white population has a smaller deprivation gap compared to the non-whites, and has a 4.5% smaller gap, while both groups had a drop in the period 2006-13.
5.3 MULTIDIMENSIONAL POVERTY
In general, the data taken from the PNAD survey shows an improvement in the living conditions of the population in North Brazil in the period 2006-13. his improvement, however, did not occur homogeneously among the states in the region, or among the area, gender, age and race groups.
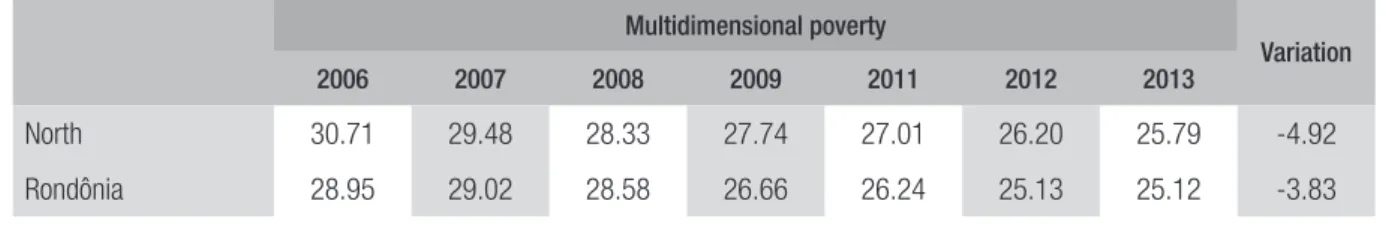
Table 4 addresses the multidimensional poverty by states and groups in North Brazil (2006-13). he results suggest a reduction in multidimensional poverty in the North from 30.71% in 2006 to 25.79% in 2013, depending on the adopted methodology, with a variation of 4.92%. In the period in question, the level of multidimensional poverty declined at an annual average rate of 0.7%. his behavior relects the recent dynamics of the poverty indices nationwide. According to Silva (2015), between 2006 and 2012, the observed reduction in the levels of multidimensional poverty was 3.01% and 4.51% for Brazil and the South, respectively. In particular, North Brazil may be worth mentioning as one of the regions where poverty had the sharpest drop during this period, although it is still the region with the highest proportion of multidimensional poor in Brazil for the period analyzed.
TABLE 4 MULTIDIMENSIONAL POVERTY PER STATE AND GROUP IN NORTH BRAZIL, 2006-13 (%)
Multidimensional poverty
Variation
2006 2007 2008 2009 2011 2012 2013
North 30.71 29.48 28.33 27.74 27.01 26.20 25.79 -4.92
Multidimensional poverty
Variation
2006 2007 2008 2009 2011 2012 2013
Acre 30.52 28.33 28.50 27.01 25.71 25.53 24.36 -6.16
Amazonas 30.18 28.41 26.86 26.17 26.68 24.87 24.02 -6.16
Roraima 28.22 27.68 25.74 25.62 22.86 22.17 23.09 -5.13
Pará 32.23 30.88 29.91 29.63 28.37 28.00 27.64 -4.59
Amapá 28.41 28.06 25.72 26.35 26.15 24.96 25.26 -3.15
Tocantins 28.08 26.92 25.20 24.47 23.80 23.18 22.79 -5.29
Metropolitan 26.09 25.22 24.61 24.80 22.49 22.61 22.60 -3.49
Urban 28.21 27.29 26.22 25.60 25.01 24.07 23.65 -4.56
Rural 39.86 37.91 36.19 35.42 35.74 34.90 33.71 -6.15
Men 30.96 29.87 28.73 28.06 27.42 26.59 26.26 -4.70
Women 30.47 29.09 27.93 27.42 26.61 25.80 25.32 -5.15
Children 31.58 30.26 28.89 28.28 27.49 26.47 25.78 -5.80
Adolescents 30.59 29.38 27.87 27.65 26.77 25.78 25.69 -4.89
Young adults 30.87 29.46 28.33 27.59 26.85 26.19 25.54 -5.05
Adults 29.36 28.14 27.27 26.53 25.92 25.20 24.79 -4.57
Elderly 35.77 35.42 34.71 34.77 33.65 33.05 33.50 -2.27
White 27.87 26.64 25.75 25.42 24.65 23.85 23.03 -4.84
Non-white 31.64 30.43 29.11 28.47 27.77 26.88 26.62 -5.02
Source: Elaborated by the authors based on PNAD data.
With regard to the states in the region, the results of the proportion of multidimensional poor in North Brazilian states have shown a decrease over the period in question. Acre and Amazonas were the states that obtained the widest variation, 6.16% down from 2006 to 2013. Amapá state, however, has the lowest variation rate (-3.15%). And is also the Northern state with the highest proportion of multidimensional poor in 2013, afecting 25.26% of its population, while the states of Amazonas (24.02%), Roraima (23.09%) and Tocantins (22.79%) had the lowest proportional rates of multidi-mensional poor in North Brazil.
According to the study by Silva and partners (2014), the Northern region had 26.2% of the pop-ulation in a situation of poverty, followed by the Northeast with 24.18%, and the Southeast, South and Midwest regions with smaller proportions. herefore, Silva and partners (2014) corroborate the results of this study herein.
he aforementioned authors stress the importance of measuring poverty taking not only income into consideration, but also housing, water supply, basic sanitation, education and the labor market. Nationwide, the proportion of poor in the rural zone in 2004 was 25.45% while in the urban zone had 19.41%. his convergence suggests that the population living in this area improved the levels of wellbeing associated with the multi-dimensions relecting the degree of poverty. Nonetheless, even with better living conditions, the disparities still remain between the areas, although to a lesser extent, since the dynamics of distributing the efects on poverty occurred heterogeneously in the timeframe.
On average, there is no major diference in poverty between the gender and age group dimensions. However, there has been a decrease in every group. Multidimensional poverty among men in 2013 was 26.26%, compared to women with 25.32%, there being a wider variation (drop) between women of 5.15% (table 4), and a largely unnoticed diference between children, adolescents, young adults and adults. he children’s group had a stronger impact on the decrease with a 5.8% drop from 2006 to 2013. he group of the elderly, however, had a small decrease of 2.27% in proportion, and was the group with the highest multidimensional poverty of 33.5% in 2013. he non-white populations had the highest levels of multidimensional poverty, 26.62%, in 2013, despite presenting the highest variation rate of 5.02% from 2006 to 2013.
5. FINAL CONSIDERATIONS
his article intends to portray the current levels of multidimensional poverty in North Brazil between 2006 and 2013. he purpose of the study is for it to act as a tool to assist public administration in de-veloping policies focusing on ighting poverty and advancing the development process in the region. herefore, the study has shown that, when considering the measurement of multidimensional poverty from the viewpoint of the six dimensions analyzed, it was found that it revealed a downward trend over the period in question. he results of the study suggest a drop in multidimensional poverty from 30.71% in 2006 to 25.79% in 2013. In view of the above, it is believed that this scenario occurred due to the growing investment in public policies to redistribute income, implemented by the federal government in that period.
For the separate analyses of the metropolitan, urban and rural areas, the poverty level was more intense in the rural region, where the intensities of poverty were considerably greater. here are sev-eral hypotheses for this conclusion, such as: existence of the elderly in the household, but without a pension at all; and although it is in the rural area, the household may not have land for its subsistence; or perhaps the households may receive from some federal government program, but not enough to take them out of poverty. On the other hand, this situation is less serious in the metropolitan area of North Brazil. In the analysis of poverty in the group there is almost no diference between men and women, but it is worth mentioning that the persistent deprivation is concentrated more among men.
he strongest impact on poverty would be on the elderly group; they are considered the most deprived compared to the other age groups. In contrast, ongoing inequalities continue for the white and non-white populations, thereby showing a signiicant diference in comparing multidimensional poverty, since that of non-whites is shown to have a higher rate of deprivation.
herefore, this study, measuring the multidimensionality of poverty in North Brazil, evidenced the dimensions that cause this population to lead a more deprived life. But the information presented herein is not a rigid condition to be adopted, but rather seeks to highlight this problem more and somehow demonstrate to policymakers the diferent needs of the Northern population.
hus, the conclusion is that in order to reduce multidimensional poverty, public administration must adopt public policies directed speciically to the dimensions that most strongly impact poverty in the northern region, namely: education, labor and demography, communication and information, and health, and to distribute these resources between the states in that region, seeking better living conditions and social inclusion, and thereby reduce regional disparities.
Lastly, for further analyses it is believed that studies should be carried out on poverty in North Brazil, seeking to investigate the particularities of each state in the region. For example: why are there difering degrees of poor within the state itself? What is the particular feature of each state whose population is in better situations compared to the other states in the same region? Which policies or public actions difer from state to state?
REFERENCES
ANAND, Sudhir; SEN, Amartya. Concepts of hu-man development and poverty: a multidimensional perspective. Human Development Papers. New York: UNDP, 1997.
ARAUJO, Jair A.; MORAIS, Gabriel; CRUZ, Mércia. Estudo da pobreza multidimensional no Estado do Ceará. Revista Ciências Administrativas, v. 19, n. 1, p. 85-120, 2013.
BOURGUIGNON, François; CHAKRAVARTY, Satya. he measurement of multidimensional po-verty. he Journal of Economic Inequality, v. 1, p. 25-49, 2003.
BRANDOLINI, Andrea; D’ALESSIO, Giovanni.
Measuring well-being in the functioning space. Roma: Banca d’Italia, 1998.
CARVALHO, Maristela; KERSTENETZKY, Celia L.; DEL-VECCHIO, Renata. Uma aplicação da teoria dos conjuntos fuzzy na pobreza: o caso das Regiões Metropolitanas do Sudeste brasileiro — 2000. In: EN-CONTRO NACIONAL DE ECONOMIA (ANPEC), 35., 2007, Recife. Anais... Recife: Anpec, 2007. Avai-lable at: <www.anpec.org.br/encontro2007/artigos/ A07A001.pdf>. Accessed on: 1 Aug. 2016.
DINIZ, Marcelo B.; DINIZ, Marcos M. Um indi-cador comparativo de pobreza multidimensional a partir dos objetivos do desenvolvimento do milênio.
Economia Aplicada, Ribeirão Preto, v. 13, n. 3, p. 399-423, July/Sept. 2009.
FOSTER, James; GREER, Joel; THORBECKE, Erik. A class of decomposable poverty measures. Econo-metrica, São Paulo, v. 52, n. 3, p. 761-766, May 1984. GOUGH, Ian; DOYAL, Len. Macmillan Press Ltd., 1991.
IPEA. Instituto de Pesquisa Econômica Aplicada. Available at: <www.ipea.gov.br/portal/>. Accessed on: 11 Aug. 2014.
KUKLYS, Wiebke; ROBEYNS, Ingrid. Amartya Sen’s capability approach: theoretical insights and empirical applications. New York: Springer Berlin Heidelberg, 2005.
LACERDA, Fernanda C. C. A pobreza na Bahia sob o prisma multidimensional: uma análise baseada na abordagem das necessidades básicas e na
abor-em economia) — Programa de Pós-Graduação abor-em Economia, Universidade Federal de Uberlândia, Uberlândia, 2009.
MAASOUMI, Esfandiar; LUGO, Maria. he infor-mation basis of multivariate poverty assessments. In: KAKWANI, Nank; SILVER, Jacques (Ed.). Quantita-tive approaches to multidimensional poverty measure-ment. New York: Palgrave Macmillan, 2008. p. 1-29.
MAX-NEFF, Manfred. Desarrolo a escala humana. Barcelona: Içaria, 1998.
MIDEROS, Andrés M. Ecuador: deinición y me-dición multidimensional de la pobreza, 2006-2010.
Revista de la Cepal, n. 108, p. 51-70, 2012.
OTTONELLI, Janaina et al. A importância das medidas multidimensionais de pobreza para a administração pública: um exercício em Palmeira das Missões (RS). Rev. Adm. Pública, v. 45, n. 2, p. 837-862, Mar./Apr. 2011.
OTTONELLI, Janaina; SILVA, Mariano J. L. Pobreza multidimensional nos municípios da região Nor-deste. Rev. Adm. Pública, v. 48, n. 5, p. 1253-1279, Sept./Oct. 2014.
ROCHA, Sônia. Alguns aspectos relativos à evolução 2003-2004 da pobreza e da indigência no Brasil. Rio de Janeiro: Iets, jan. 2006. Available at: <www.direito. usp.br/faculdade/eventos/evolucao_pobreza.pdf>. Accessed on: 23 Mar. 2014.
SALAMA, Pierre; DESTREMAU, Blandine. O tama-nho da pobreza: economia política da distribuição de renda. Rio de Janeiro: Garamond, 1999.
SEN, Amartya. Capability and well-being. In: SEN, Amartya; NUSSBAUM, Martha. (Ed.). he quality of life. Oxford: Clarendon Press, 1993. p. 30-55.
SEN, Amartya. Desenvolvimento como liberdades. São Paulo: Companhia das Letras, 2000.
SEN, Amartya. Poverty in the human development perspective: concept and measurement. Chapter, v. 1, p. 15-23, 1997.
SILVA, Ana M. R. Um estudo sobre a pobreza multi-dimensional na região Nordeste do Brasil. Dissertação (mestrado) — Universidade Federal de Uberlândia, Uberlândia, 2009.
pobreza multidimensional no Brasil. In: CONFE-RÊNCIA LATINO-AMERICANA E CARIBENHA SOBRE ABORDAGEM DAS CAPACITAÇÕES E DESENVOLVIMENTO HUMANO, III, 2010, Porto Alegre.
SILVA, Andréa F. da. Ensaios sobre a pobreza no Brasil. Dissertação (mestrado) — Programa de Pós-Graduação em Economia Rural, Faculdade de Ciências Econômicas, Universidade Federal do Ceará, Fortaleza, 2015. Available at: <www.teses. ufc.br/tde_busca/processaPesquisa.php?listaDeta-lhes[]=9110&processar=Processar>. Accessed on: 1 Aug. 2016.
SILVA, Andréa F. et al. Análise da pobreza multidi-mensional no Brasil. In: ENCONTRO NACIONAL DE ECONOMIA, 42., 2014, Natal, RN. Anais… Natal: Anpec, 2014.
SILVA, Mirela C. P. S.; BARROS, Ricardo P. Pobreza multidimensional no Brasil. Rio de Janeiro: Ipea, 2006. (Texto para discussão; n. 1227). Available at: <www.ipea.gov.br/portal/index.php?option=-com_content&view=article&id=4372>. Accessed on: 1o Aug. 2016.
SOUSA, Janaildo S. Pobreza multidimensional no estado da Paraíba. In: CONGRESSO DA
SOCIEDA-DE BRASILEIRA SOCIEDA-DE ECONOMIA, ADMINISTRA-ÇÃO E SOCIOLOGIA RURAL — SOBER, 53., 2015, João Pessoa, PB. Anais... João Pessoa: Congresso da Sociedade Brasileira de Economia, Administração e Sociologia Rural, 2015.
SOUZA, Paola F. L.; SALVATO, Márcio A.; FRAN-ÇA, João M. S. Ser mulher e negro no Brasil ainda leva a menores salários? Uma análise de discrimi-nação para Brasil e regiões: 2001 e 2011. In: EN-CONTRO NACIONAL DE ECONOMIA, 42., 2013, Foz de Iguaçu, PR. Anais... Foz de Iguaçu: Encontro Nacional de Economia, 2013.
STEWART, Frances. Basic needs approach. In: CLARK, David (Org.). he Elgar companion to de-velopment studies. Cheltenham, UK: Edward Elgar Pressing, 2006. cap. 5.
THORBECKE, Erik. Multidimensional poverty: conceptual and measurement issues. In: KAKWA-NI, N.; SILBER, J. (Ed.). he many dimensions of poverty. New York: Palgrave Macmillan, 2008. p. 3-19. Available at: <http://link.springer.com/ book/10.1057/9780230592407>. Accessed on: 1 Aug. 2016.
TSUI, Kaiyuen. Multidimensional poverty indices. So-cial Choice and Welfare, v. 19, n. 1, p. 69-93, Spring 2002.
Andréa Ferreira da Silva
Doctorate student in the Post-graduate Economics Program at the Federal University of Paraíba (PPGE/UFPB). Is Master in Rural Economics from the Federal University of Ceará (Maer/UFC). Economics graduate from the Regional University of Cariri (Urca). E-mail: [email protected].
Janaildo Soares de Sousa
Doctorate student in the Post-graduate Program on Development and Environment at the Federal University of Ceará (Prodema/UFC). Is Master in Rural Economics from the Federal University of Ceará (Maer/UFC). Specializes in social public and housing policies (Uniara). E-mail: [email protected].
Jair Andrade Araujo