BJRS
RADIATION SCIENCES
Evaluation of glasses containing cadmium for high dose
dosimetry by the thermoluminescence technique
G. S. M. Carvalho
a; P.Z. Ferreira
a; N. O. Dantas
a; A. C. A. Silva
a; A. P. Perini
a;
L. V. E. Caldas
b; B. N. S. Carrera
c; S. Watanabe
c; L. P. Neves
a,baInstituto de Física, Universidade Federal de Uberlândia (INFIS/UFU), Caixa Postal 593, 38400-902, Uberlândia,
MG, Brasil; bInstituto de Pesquisas Energéticas e Nucleares – Comissão Nacional de Energia Nuclear
(IPEN/CNEN-SP), 05508-000, São Paulo, SP, Brasil; cInstituto de Física da Universidade de São Paulo (IFUSP), 05508-090, São
Paulo, SP, Brasil [email protected]
ABSTRACT
New glass matrices were evaluated for high dose dosimetry by the thermoluminescence technique. Their nominal com-position are 20Li2CO3.10Al2O3.15CdO.55B2O3 and 20Li2CO3.10Al2O3.20CdO.50B2O3 (mol%). The glass matrices
were irradiated with different doses: 50, 100, 200, 500, 700 and 900 Gy, and the thermoluminescence emission curves were obtained for each of these values. The results show a great potential of using these matrices in high dose dosime-try.
Keywords: dosimetry, termoluminescence, glass matrix, high doses, radiologic protection.
1. INTRODUCTION
The usage of high doses of radiation is becoming a field with promising growth. The processes which involve doses in the range of 10 Gy to 100 kGy are characterized as high doses and are be-coming more common.
High doses of radiation are used in a variety of processes, for example: gammagraphy, curable inks and varnishes, polymerization of wires and cables, irradiation of semiprecious stones and food, ster-ilization of surgical materials, among others [OKUNO et al., 2010].
In these processes, it is necessary the implementation of an efficient quality control to ensure that the correct amount of dose is delivered to the product. Usually, for high dose dosimetry, glass ma-trices are used and the reading process is made via the thermoluminescence technique [McLAUGHLIN et al., 1989].
The thermoluminescence (TL) process is a phosphorescence emission after a thermal stimulation. In an ideal insulating, the electrons host the valence band, the conducting band is empty and the sepa-ration between then is called forbidden band, where there are no energy levels [McKEEVER et al., 1995].
When the material is irradiated, if the photon's energy is enough to overcome the energy difference between the valence and conducting bands, the electrons will absorb that energy and be transfered to the conducting band leaving holes (vacancy spaces) in the valence band.
If the material has a dopant - in our case CdO - there will appear energy levels within the forbidden band. These energy levels function as traps for the electrons and holes. The charge carriers will re-main trapped until a stimulation - in this case thermal - release then. When the electrons are back again to the conducting band, there is the probability of occurring recombination with holes and the consequent emission of photons, the denominated TL photons.
As the light emitted by the material turns more intense it means that there are more recombination of electron-holes pairs. As the material is heated, it is possible to obtain a curve relating the TL light intensity with the temperature. This is the so called TL emission curve.
The population of electrons that were trapped and then released represents the radiation dose that this material received. Therefore, there is a direct relation between the emission curve and the dose absorbed by the material [McKEEVER, 1988].
Several glasses have the potential to be applied as high-dose dosimeters, due to its small size, low production cost and dosimetry properties [TEIXEIRA, 2004]. Glasses containing Cadmium (Cd) have been evaluated and showed promising results of being used as dosimeters [MANOHARA et al., 2015; ANJAIAH et al. 2014]. However, it is necessary more research to evaluate how the modi-fication on the concentration of Cadmium affects the dosimeter response, justifying this work.
2. MATERIALS AND METHODS
The glass matrices were synthesized by the fusion method in a silicon carbide furnace at 1350ºC for 15 minutes over carbon atmosphere. The cooling process was made between two plates of copper-brass at 0ºC, and the samples were thermally treated at 350ºC for 12 hours. The irradiation took place in a Gamma Cell-220 equipment that uses a 60Co source with a dose rate of 1.38 kGy/h. The samples were positioned at room temperature 10 cm far from the source. The irradiation equipment used is located at Centro de Tecnologia das Radiações, Instituto de Pesquisas Ener-géticas e Nucleares (IPEN/CNEN/SP) at room temperature. In order to guarantee electronic equilib-rium during the irradiation, the samples were covered with a 3 mm layer of polymethylmethacry-late.
After irradiation the thermoluminescence emission curves were obtained in a Harshaw TLD 4500 reader, coupled to a computer for data acquisition. The measurements were done from room tem-perature until 400ºC using a constant flow of N2 of 2,5 L/min, and a heating rate of 10ºC/min.
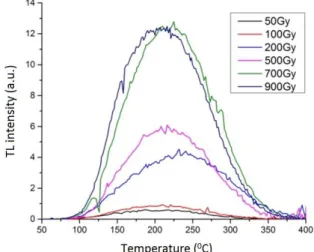
The first glass matrix composition used was 20Li2CO3.10Al2O3.15CdO.55B2O3 (mol%). This
ma-trix was irradiated with the following radiation doses: 50, 100, 200, 500, 700 and 900 Gy. After the reading process, it was obtained the TL emission curves showed in Figure 1.
The TL curve has an increasing response as doses increases, but there is an indicative of saturation at 700 Gy. For 700 and 900 Gy there is e a single defined peak located at 225ºC and 200ºC, respec-tively.
Figure 1: TL emission curve of glass matrix of composition
20Li2CO3.10Al2O3.15CdO.55B2O3 (mol%) for high doses.
The next glass matrix analyzed had composition 20Li2CO3.10Al2O3.20CdO.50B2O3 (mol%). It was
irradiated with the same doses as the first matrix, and the TL emission curve is available in Fig-ure 2.
Figure 2: TL emission curve of glass matrix of composition
20Li2CO3.10Al2O3.20CdO.50B2O3 (mol%) for high doses.
In this case, there is a more uniform growth response than the previous matrix. The main dosimetry peak is located at 175ºC and it shows a slight saturation for 900 Gy that must be investigated through more tests.
4. CONCLUSION
It was observed that the matrix with a greater concentration of Cadmium (20 Cd) has a better TL response, that is easier to be treated quantitatively than the first matrix (15 Cd). Both of them pre-sented their TL peaks above 150ºC. More tests will be made in order to fully characterize the dosi-metric properties of these materials, but these results demonstrate their potential for high dose do-simetry.
5. ACKNOWLEDGMENT
This paper was also presented at the Congresso Brasileiro de Metrologia das Radiações Ionizantes 2016. The authors thank the Brazilian funding agencies: CAPES (Pró-Estratégia 1999/2012),
Con-selho Nacional de Desenvolvimento Científico e Tecnológico (CNPq Grants 421603/2016-0, 157593/2015-0 and 420699/2016-3), MCT: Projeto INCT Metrologia das Radiações em Medicina and Fundação de Amparo à Pesquisa de Minas Gerais – FAPEMIG (Project APQ-02934-15).
REFERENCES
ANJAIAH, J.; LAXMIKANTH, C.; KISTAIAH, P.; VEERAIAH, N. Dosimetric and kinetic pa-rameters of lithium cadmium borate glasses doped with rare earth ions. Journal of Radiation Re-search and Applied Sciences, v. 7, n. 4, p. 519-525, 2014.
MANOHARA, B.M.; NAGABHUSHANA, H.; THYAGARAJAN, K.; DARUKA PRASAD, B.; PRASHANTHA, S.C.; SHARMA, S.C.; NAGABHUSHANA, B.M. Cadmium silicate nanopow-ders for radiation dosimetry applications: Luminescence and dielectric studies. Journal of Asian Ceramic Societies, v. 3, n. 2, p. 188-197, 2015.
McKEEVER, S.W.S. Thermoluminescence of solids. Cambridge University Press, 1988.
McKEEVER, S.W.S.; MOSCOVITCH, M.; TOWNSEND, P.D. Thermoluminescence dosimetry materials: properties and uses. Nuclear Technology Publishing, England, 1995.
McLAUGHLIN, W.L.; BOYD, A.W.; CHADWICK, K.H.; McDONALD, J.C.; MILLER, A.; Do-simetry for radiation processing. London (UK): Taylor and Francis, 1989.
OKUNO, E.; YOSHIMURA, E. Física das Radiações. Oficina de Textos, 2010.
TEIXEIRA, M. I. Propriedades dosimétricas de vidros comerciais e de areia para doses altas. Tese de Doutorado. Universidade de São Paulo, São Paulo, 2004.