BJRS
RADIATION SCIENCES
07-02A (2019) 01-11ISSN: 2319-0612
Accept Submission 2018-08-17
Computational model of a 3D dosimetry system -
ArcCHECK
®A. C. Mazer
a; M. V. N. Nakandakari
b; V. A. B. Ribeiro
c; P. T. D. Siqueira
a; J. M.
B. Shorto
a; H. Yoriyaz
aaInstituto de Pesquisas Energéticas e Nucleares (IPEN / CNEN - SP), 05508-000, São Paulo, SP, Brasil bBeneficência Portuguesa de São Paulo, 01323-001, São Paulo, SP, Brasil
cInstituto de Radiologia do Hospital das Clínicas da Faculdade de Medicina da Universidade de São Paulo
(InRad-HCFMUSP), 05403-010, São Paulo, SP, Brasil [email protected] / [email protected]
ABSTRACT
Ionizing radiation therapies have been improving over the years, becoming more specific for each patient. Thereby, as the treatment planning system (TPS) complexities increases, the quality assurance (QA) methods have to be in constant evolution. One of the techniques that demand great complexity is the Volumetric Modu-lated Arc Therapy (VMAT), and one possible way to VMAT commissioning is using 3D dosimetry systems. Re-cently a new 3D dosimetry system called ArcCHECK had been developed and commercialized mainly for VMAT quality assurance. It is water-equivalent and composed by an array of 1386 diodes arranged in a helical pattern. Since simulation methods, like Monte Carlo method, ensure highly accurate results, MCNP (A General Monte Carlo N-Particle Transport Code System) is totally reliable for problems that involve radiation transport. This work presents two computational models for Monte Carlo simulations to predict detection responses in the QA procedure using the ArcCHECK. The computational models were validated comparing the system responses obtained from MCNP6 simulations against measured responses due to a 6 MeV clinical photon beam from a Linear Accelerator. 2D dose maps were reported here with good agreement between simulated and measured values.
1. INTRODUCTION
Over the years, ionizing radiation therapies, as Radiotherapy, have largely improved the machine and equipment technologies as well as the daily procedures, so that, treatment planning systems (TPS) are becoming more complex and specific for each patient. Thereby, as the TPS complexities increase, the Quality Assurance (QA) methods have to be in constant evolution to ensure the proper functioning of the dose delivery system [1]. One of the techniques that demand great complexity and attention in QA is the Volumetric Modulated Arc Therapy (VMAT). VMAT is a technique that attempts to optimize the 3D dose distribution by modulation of beam intensity, in one or various rotations, using any arc length around the patient [2], in order to try to save significantly the adja-cent healthy tissues in an extremely fast treatment [3].
This technique attempts to be as close as possible to an exact treatment due to a planning algorithm, where three parameters vary simultaneously during the treatment [3]. Since it is quite complex, there are not official reports of commissioning procedures of machines in VMAT mode yet. One possible way to commissioning it is the planar dose verification, by the use of films or a matrix de-tector between a simulator object, where all parameters of the treatment are varied at the same time - the machine rotation velocity, the movement of multileaf collimators and the dose rate released [4]. However, a more suitable procedure for commissioning VMAT machines is using three-dimensional (3D) dosimetry systems, since their implementation is more feasible and their use im-proves the accuracy in QA procedures when compared to a two-dimensional system. In order to investigate more appropriate QA procedures, some studies with 3D dosimetry systems have been carried out by several authors [1].
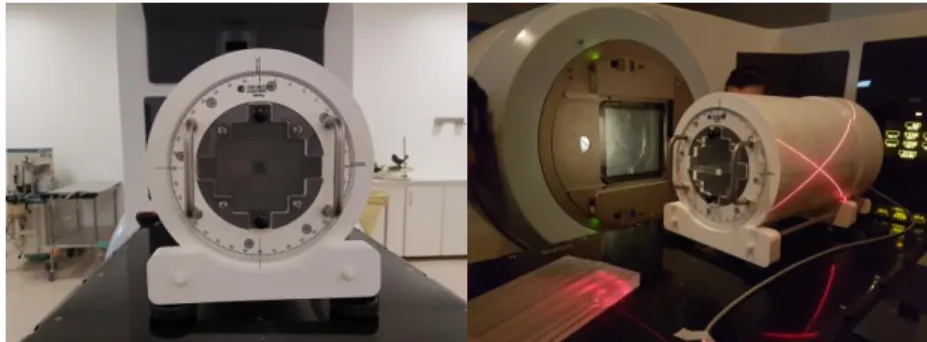
Recently a new 3D dosimetry system called ArcCHECK (Sun Nuclear Corporation) had been de-veloped and commercialized mainly for VMAT quality assurance. It is water-equivalent and com-posed by an array of 1386 fixed SunPoint® diodes (size 0.8 x 0.8 mm) arranged in a helical pattern inside a cylindrical structure, forming a helical detector mesh. The central cavity, Figure 1, is de-signed to insert several accessories, like a homogeneous solid core as well as a dosimetry core with ionization chambers [5]. Currently, this system has been object of dosimetry studies for routine use in QA procedures of Radiotherapy clinics. With the purpose of performing dosimetry studies for
commissioning and implementation of a dosimetry system, it is possible to create a virtual model that represents the real system, by the use of the tools of a Monte Carlo code.
Figure 1: ArcCHECK with a water-equivalent solid acrylic inserted
2. MATERIALS AND METHODS
2.1.
Monte Carlo Code MCNP6
Monte Carlo method (MCM) is a widely used tool to solve problems involving stochastic processes. Since simulation methods like this ensure highly accurate results, their use is totally reliable for many knowledge areas [6]. MCNP (A General Monte Carlo N-Particle Transport Code System) is a general-purpose code based on Monte Carlo method and designed especially to represent systems that involve radiation transport. The version 6 of MCNP (MCNP6) is much more than the merger of previous versions capabilities (MCNP5 and MCNPX). Among other tools, MCNP6 allows the user to generate or read mesh geometries, for example, and allows obtaining a track-length tally over a 3D mesh [7].
This work presents two computational models of the 3D dosimetry system ArcCHECK developed for simulation using MCNP6. These models will contribute for dosimetry studies in QA procedures in radiation therapy, mainly in therapies that use volumetric dynamic arc (VMAT).
2.2.
LINAC Virtual Source Model And Simulation
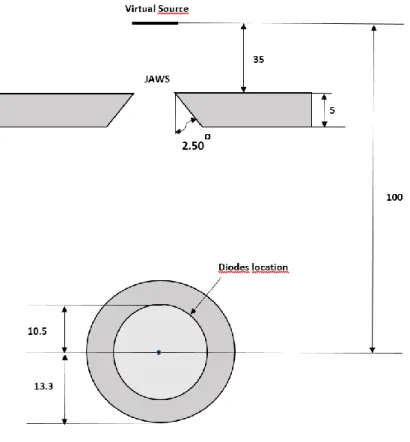
Virtual source model of a 6 MeV Linear Accelerator was used as the radiation source. The file was created following the methodology presented by Rucci et. al. [2014, 2016]. The primary photon source was represented by a square surface area of 0.215x0.215 cm2 located at 100 cm from the center of the ArcCHECK system. The photon energy spectrum is composed by energies of 1 MeV, 3 MeV and 5 MeV, with respective probabilities of 68.4 %, 25% and 6.7%. The photon emission aperture angle considered was 4.54 degrees. In this work, it was considered a radiation field size of 10 x10 cm2, so that, jaws were added on the X and Y axes to the model to shape the radiation field. The jaw was modelled as a 5 cm thick Tungsten with a square aperture of 3.3 cm located at a dis-tance of 35 cm from source. The lateral X and Y faces of the jaws were inclined 2.50 degrees to conform the beam aperture.
The use of the virtual source model in the present work was validated reproducing the percentage depth dose (PDD) and dose profiles (DP) in different depths measured in a water phantom using a Varian Unique accelerator of the radiotherapy service of the Hospital Beneficencia Portuguesa of São Paulo, where actually the experimental measures used for validation in the present work has been done. It was observed that the simulated data reproduces very well the experimental data. Fig-ure 2 shows the simulation setup that followed the experimental setup where the source to the center of ArcCHECK was fixed in 100 cm.
Figure 2: Simulation setup: The virtual source is 100 cm from the center of the ArcCHECK.
The external radius of the ArcCHECK is 13.3 cm and the diodes are located in a surface with radius of 10.5 cm
2.3.
Simple Model
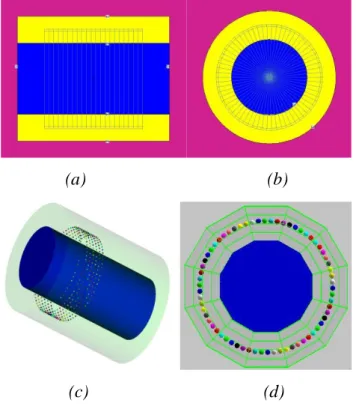
The first computational model of the ArcCHECK system is represented by a cylinder with 13.3 cm radius and 32.4 cm height, as shown in Figure 3a and 3b. Bi-dimensional dose map was obtained using the MCNP6 FMESH tally in which a cylindrical grid is constructed over the cylindrical shell with a radius of 10.5 cm where the diodes are located. The grid in the cylindrical shell is composed by 66 x 21 elements with a shell thickness of 0.4 cm, each element representing one diode in the system. The whole system is assumed to be composed by water. In each diode, it is assumed that the electronic equilibrium is stablished, so that, the dose is obtained using the particles track-length estimation, convolved with the mass-energy absorption coefficient of water.
2.4.
Detailed Model
In this model the 1386 diodes present in the system were explicitly modeled as spheres of 0.4 cm radius. The spatial position of each diode, which is arranged in helical format with 10.5 cm radius, was extracted from the measurement output file (filename.acm) provided by the detector system. There are 66 diodes in a helical roll with a total of 21 helical rolls. For simulations, the diodes were assumed to be composed by water so as the entire cylinder, which represents the whole system. Figures 3c and 3d show the computational model. Dose calculation in each diode was done using the *F8 tally which gives the energy deposition transferred to the diode volume in each particle col-lision.
Figure 3: Computational models of the ArcCHECK system: simple model (a and b);
de-tailed model (c and d)
(a) (b)
2.5.
Experiments
The measurements were obtained using a Varian Unique Linear Accelerator of the radiotherapy service at the Hospital Beneficência Portuguesa of São Paulo. A 6 MeV photon beam with 10 x 10 cm2 field was used to irradiate the ArcCHECK detector system. The measured data was collected through the acquisition software displaying a 2D dose map in a rectangular format. The display is a rolled-out array of 66 x 21 dose points graphical representation of the diodes responses with X axis (radial) representing the number of diodes in a helical roll (66) and the Y axis (height) representing the number of helical rolls (21).
3. RESULTS AND DISCUSSION
For all simulations, a number of particle histories (nps) of 109 was simulated. This value was chosen so that the results of the simulations always generated relative errors less than 1.5% for all points requested. After the simulations, the MATLAB [10] software was then used to process the outputs of the models and generate dose map images of the results (dose unit given in MeV/g). Also, the experimental data obtained from the ArcCHECK irradiation under a 6 MeV, 10x10 cm² field beam was processed to allow data comparisons between simulation and experimental data.
3.1.
Simple Model
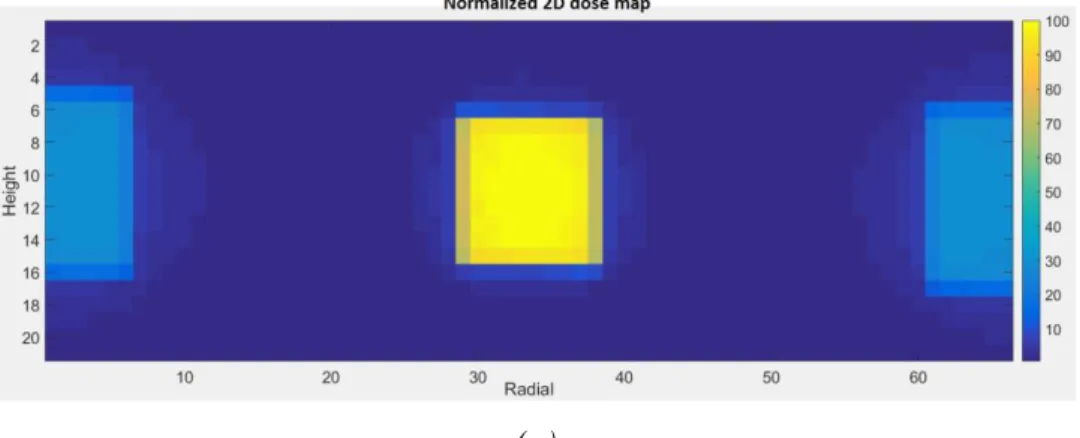
Figure 4a shows the normalized 2D dose map obtained from simulation and Figure 4b presents the percentage difference compared to the experimental 2D dose map. Considering that this dose map represents a cylindrical rolled-out view of dose distribution, the central region represents the top of the cylinder that receives the direct exposition of radiation beam, consequently receiving higher dose levels. The lateral dose in the map represents the doses received in the opposite side of the cylinder but still inside the radiation field.
One can observe that regions inside the radiation field area (front and opposite side of the cylinder) a very good agreement has been found comparing both experimental and simulated dose
distribu-tion. However, dose gradients in regions of the detector in the interface between the radiation field area and out are very high, provoking great dose differences as shown in the figure 4b. The results in these high gradient dose regions from the computational model are also susceptible to any shift (rotation or translation) of the detector system contributing for the discrepancies in dose in those regions.
Figure 4: a) 2D normalized dose map obtained from simple model and; b) 2D percentage
difference map compared to experimental data
(a)
3.2.
Detailed Model
In this model, the dose was calculated using *F8 Tally, scoring the energy deposition in each sphere detector representing the diodes. 2D dose map is shown in Figure 5a and the percentage difference as a result of the comparison with the experimental data is shown in Figure 5b. As in the previous case, very good agreement has been obtained in the region inside the radiation field area in both (front and opposite) sides of the cylinder relative to the radiation beam. Differences in the lateral region are smaller than those observed in the previous model, but still high in some diodes caused by high dose gradients, which are very sensitive to small shifts in the detector system positioning. This fact were checked with the realization of several experimental tests, where small shifts in dif-ferent directions were provoked and the differences in the system response where registered. Con-siderable percentage differences in response have been observed in regions of high dose gradient as predicted in the simulations. Fortunately, high dose differences occur in regions where the relative dose values are lower than 10% of the maximum.
Figure 5: a) 2D dose map obtained from detailed model and; b) Percentage difference
be-tween simulation and experimental dose data
(b)
4. CONCLUSION
A simple computational model of the ArcCHECK 3D dosimetry system has been modelled for MCNP6 Monte Carlo simulations. 2D dose map generated from simulations have been compared to experimental data obtained from measurements performed in a 10x10 cm2, 6MeV photon beam delivered by Varian Unique Linear Accelerator. In regions of high dose gradients considerable dose differences have been found, however, in those regions the relative dose values are lower as 10% of the maximum. On the other hand, very good agreement has been achieved in regions of high dose levels demonstrating the validity of the computational model.
We concluded that within the uncertainties and discrepancies found, this simple computational model is capable of detect differences in dose caused by accelerator malfunctioning, so that, it can be used to predict any failure during the irradiation process in IMRT or VMAT therapies.
REFERENCES
1. FEYGELMAN, V.; ZHANG, G.; STEVENS, C.; NELMS, B. E. Evaluation of a new VMAT QA device, or the “X” and “O” array geometries. Journal of Applied Clinical Medical Physics, v. 12, n. 2, 2011.
2. OTTO, K. Volumetric modulated arc therapy: IMRT in a single gantry arc. Med. Phys., 35(1), p. 310 – 317, 2008.
3. SURUCU, M.; YEGINER, M.; KAVAK, G. O.; FAN, J.; RADOSEVICH, J. A. ; AY-DOGAN, B. Verification of dose distribution for volumetric modulated arc therapy total marrow irradiation in a humanlike phantom, Med. Phys., v. 39, p. 281 – 288, 2012.
4. GONÇALVES, L. R.; SANTOS, G. R.; MENEGUSSI, G.; SILVA, M. A.; PÁSSARO, A. M.; RODRIGUES, L. N. Comissionamento de um acelerador linear para realização da radioterapia em arco modulada volumetricamente, Revista Brasileira de Física Médica, 7(2), p. 65 – 70, 2013.
5. Sun Nuclear Corporation. ArcCHECK Reference Guide: The Ultimate 4D QA Solution. Melbourne, Florida, United States, 2012.
6. YORIYAZ, H. Método de Monte Carlo: princípios e aplicações em Física Médica. Revista Brasileira de Física Médica, 3(1), p. 141 – 149, 2009.
7. Pelowitz, D. B. MCNP6 User’s Manual. Version 1.0, LA-CP-13-00634, Los Alamos Nati-onal Laboratory, 2013.
8. RUCCI, A.; CARLETTI, C.; CRAVERO, W.; STRBAC, B. Use of IAEA’s phase-space files for the implementation of a clinical accelerator virtual source model. Physica Medica, v. 30, p. 242 – 248, 2014.
9. RUCCI, A.; CARLETTI, C.; CRAVERO, W.; STRBAC, B. Use of IAEA’s phase-space files for virtual source model implementation: Extension to large fields. Physica Medica, v. 32, p. 1030 – 1033, 2016.
10. The MathWorks Inc. MATLAB and Statistics Toolbox Release R2015a. Natick, Massa-chusetts, United States, 2015.