BJRS
RADIATION SCIENCES
07-01A (2019) 01-17ISSN: 2319-0612 Accepted 2018-12-03
Acceptance testing of a CT scanner with a
knowledge-based iterative reconstruction algorithm
Medina
aM.J., Funes
aF.J, Palau
bA., Sanz
a,cV.M.,
Osorio
aA.R,. and Namías
bM.
a
Comisión Nacional de Energía Atómica,1429, Buenos Aires, Argentina
b
Fundación Centro Diagnóstico Nuclear/Departamento de Física Médica, 1417, Buenos Aires, Argentina
c
Facultad de Ciencias Exactas/National University of La Plata, 1900, La Plata, Buenos Aires, Argentina maryangelmedina@cnea.gov.ar
ABSTRACT
In this paper we present the results obtained during the acceptance tests of a Philips iCT Elite scanner with the iterative model-based IMR reconstruction algorithm. We also analyze the impact on image quality of different reconstruction algorithms available on the scanner (IMR, iDose4, FBP) for different dose levels. A Catphan® 500 phantom was used for this purpose. RESULTS: The laser positioning system was misaligned, while the gantry and table were aligned. The high-contrast spatial resolution (HCSR) was 21 lp/cm. Regarding low contrast resolution, a 3 mm pin with 0.3% contrast was observed using IMR for CTDIvol = 10.4 mGy, while a 5mm pin was observed using filtered back projection (FBP). Average uniformity was ± 3 Hounsfield Units (HU) and noise was <0.5%. Nominal and measured slice thicknesses were compared, obtaining very similar results. At 120 kVp, the effective energy was 70 keV. CT numbers were measured for different materials, with results in accordance with expected values.IMR reconstructions, when compared with FBP and iDose4, achieved noise reduction up to 75% and improved low contrast detectability up to 50% without affecting HSCR significantly. CONCLUSIONS: Image quality and general system’s functionality were evaluated, with satisfactory results. The results were taken as a reference for routine quality controls. The IMR reconstruction algorithm resulted in significantly improved low-contrast resolution and lower noise at low doses when compared with FBP. The impact of IMR technology on clinical images remains to be assessed.
1. INTRODUCTION
During the last decade, the range of computed tomography (CT) clinical applications has been growing constantly, as well as the number of CT procedures carried out annually. This has raised concerns about the increasing radiation dose delivered to the patients. Currently, there is a desire on the part of the medical community to employ doses that are as low as possible while simultaneously maintaining image quality (ALARA principle). For this reason, manufacturers have been developing technological improvements that allow the doses delivered to the patient to be optimized. Examples of these technological advances include the introduction of more efficient detection systems with higher signal-to-noise ratios (eg: Gemstone Clarity from General Electric, PureVision from Toshiba, Stellar from Siemens, NanoPanel Prism from Philips [1]), automatic exposure control systems and iterative reconstruction algorithms such as ASIR from General Electric, ADIR from Toshiba, IRIS from Siemens, and iDose4 [2] and IMR from Philips [3].
The Philips iCT Elite is a 256-slice CT scanner that incorporates three different reconstruction algorithms: the standard filtered back projection (FBP) algorithm, iDose4 (image-space noise reduction based on projection statistics) and IMR (iterative model-based reconstruction). iDose4 [2] is a reconstruction algorithm in which iterative processing is performed in both the projection and image domains. As a first step, each projection is examined for points that have likely resulted from very noisy measurements using a model that includes the true photon detection statistics. Through an iterative process, noise is suppressed while edges are preserved. The image is then reconstructed and the noise that remains after the first stage is propagated to the image space. The second step of the iDose4 algorithm deals with noise reduction in image space while preserving the underlying edges associated with true anatomy or pathology. This is achieved by selecting a noiseless structural model that fits the local topology of the image volume. Once the best model is chosen, it is used to reduce the noise in the image volume. The noise reduction strength is adjustable by selecting one of seven levels. Theoretically, level one corresponds to 11 % noise reduction, while level 7 corresponds to 55 % noise reduction. The vendor states that iDose4 level 4 can achieve dose reductions of up to 80 %.
In IMR [3], image reconstruction is formulated as the optimization of a cost function that incorporates knowledge of the system geometry, a noise model that includes the true photon detection statistics and a regularization term that penalizes noisy solutions of the iterative process, allowing to control the degree of smoothness in the final solution. The image that minimizes the cost function is found through an iterative process. According to the manufacturer, IMR can achieve a 60%-80% dose reduction while improving low contrast detectability in up to 40%-80% and reducing noise between 70% to 83%, depending on the clinical task, patient size, anatomical location and clinical practice.
After the installation of medical equipment, acceptance testing must be performed before its clinical use. Our main objectives were to perform acceptance testing of the CT scanner and to compare the results obtained with the manufacturer's specifications. These tests are described in section 2.3.
In addition, the performance of the IMR reconstruction algorithm was evaluated against iDose and FBP. These tests are described in section 2.4
2. MATERIALS AND METHODS
2.1. Quality control protocols used
In order to carry out the acceptance tests, the quality control protocols established by the equipment manufacturer [4], as well as those described in the IAEA [5], ACR [6] and AAPM [7] technical reports for CT scanners were used as references. The image quality tests were performed using a Catphan® 500 phantom (Figure 1) [8]. This allowed us to evaluate the image quality parameters specified in the literature and by the scanner manufacturer. The phantom acquisition protocols [8] were adapted to correctly display the parameters of interest, following the literature and manufacturer’s recommendations.
2.2. Catphan® 500 Phantom
The Catphan® 500 phantom has 4 sections, which can be used to evaluate the tomographic image quality (figure 1). These are: CTP401, for measuring geometric parameters and CT number linearity (sensitometry), CTP528 for high resolution performance, CTP515 for evaluation of low contrast resolution and CTP486, which allows us to evaluate image uniformity, average CT number, noise value and the presence and severity of artifacts.
Figure 1: Phantom Catphan® 500.
2.3. Image acquisition and analysis for acceptance testing
To obtain the images, the Catphan® 500 phantom was placed in the scanner’s FOV and aligned using the laser positioning system and a spirit level to check its horizontality. Each section was acquired serially, from section CTP 401 to section CTP 486.
Acquisition and reconstruction parameters were selected according to the manufacturer’s indications for each test and are summarized in Table 1. All images for the acceptance test were acquired in axial mode, using 120 kVp, with detector configuration 64 x 0.625 mm. As the tests in this section are designed only for acceptance testing, no additional scans or reconstruction were carried out besides those indicated by the manufacturer.
2.3.1 Positioning and alignment system
The aim of this test is to check whether the laser positioning system is correctly aligned with the axial scan plane. The phantom was placed on the patient's table and aligned so that the lasers matched the marks in the phantom. Then an axial scan was performed over the CTP 401 section. If the alignment is correct, the wire ramps present in the images must appear centered and symmetrical in the central slice.
2.3.2 High contrast spatial resolution (HCSR)
To evaluate the HCSR, images of the CTP528 section were obtained for all resolution modes (standard, high and ultra high) [4]. In each image, the maximum number of line pairs per centimeter (lp/cm) was visually evaluated [8] and compared to the manufacturer´s specifications.
2.3.3 Low contrast resolution (LCR)
For LCR evaluation, the CTP 515 section has a collection of pins with different diameters (2 mm to 15 mm), contrast levels (0.3%, 0.5% and 1%) and axial length (supra-slices pins with 40 mm and sub-slice pins with 3 mm to 7 mm). The LCR was evaluated for three different CTDIvol levels, using two separate reconstruction methods (FBP, IMR) [4]. Axial slices of the CTP515 module were visually assessed by a group of 6 independent observers who reported the size of the smallest visible pin. The smallest detectable pin between all observers was kept as the final result. In this way, the test was considered unsatisfactory if none of the observers detected the specified pin. As the manufacturer’s specification refers only to 0.3% supraslice pins [4], the visual analysis was carried out over these pins.
2.3.4 CT number uniformity and noise.
For this test, an acquisition of the CTP module 486 was performed. To determine the CT number accuracy, a central ROI with a diameter of 20 mm (10% of the diameter of the image of the phantom) [5] was drawn in each slice and the average CT number (CTm) over the slices was calculated. The absolute difference (ΔCT)
between CTm and the nominal value reported by the phantom manufacturer (CTn = 11.5 UH) was calculated. [4].
To evaluate CT number uniformity, four ROIs (20 mm diameter) were drawn at 10 mm from the edge of the phantom and the absolute difference between the mean CT value in these ROIs and CTm was calculated. Using the previous 5 ROIs, noise was determined in each ROI as the coefficient of variation (CV) of the CT number, expressed as a percentage [4,9,10].
2.3.5 Slice thickness (ST)
For measuring ST, the CTP 401 section has two pairs of wire ramps oriented along the x and y-axis. The thicknesses evaluated were: 0.8, 1.0, 2.5 and 5.0 mm. The ST was calculated by manually measuring the FWHM of the projection of any of the four ramps in the indicated image slice, following the procedure described in the Catphan® 500 manual [8].
2.3.6 CT number linearity (sensitometry) and contrast scale
To determine the CT number accuracy, a ROI with a fixed diameter was made for each insert of the different materials present in section CTP401 (air, LDPE, acrylic and teflon). The measured values were compared with the nominal values reported by the manufacturer of the phantom.
The linear attenuation coefficient was plotted as a function of the CT number for the materials present in the phantom. The contrast scale was determined as the slope of a linear fit of the relationship obtained [8].
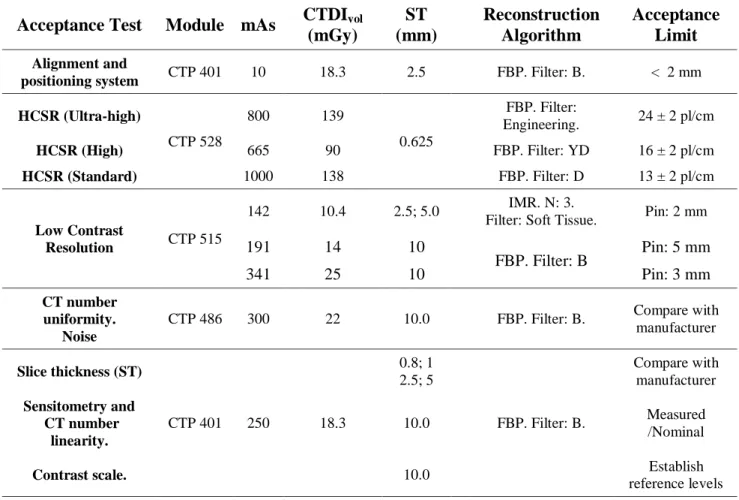
Table 1: Acquisition protocols for acceptance testing.
Acceptance Test Module mAs CTDIvol (mGy) ST (mm) Reconstruction Algorithm Acceptance Limit Alignment and
positioning system CTP 401 10 18.3 2.5 FBP. Filter: B. < 2 mm HCSR (Ultra-high) CTP 528 800 139 0.625 FBP. Filter: Engineering. 24 ± 2 pl/cm HCSR (High) 665 90 FBP. Filter: YD 16 ± 2 pl/cm HCSR (Standard) 1000 138 FBP. Filter: D 13 ± 2 pl/cm Low Contrast Resolution CTP 515 142 10.4 2.5; 5.0 IMR. N: 3.
Filter: Soft Tissue. Pin: 2 mm
191 14 10 FBP. Filter: B Pin: 5 mm 341 25 10 Pin: 3 mm CT number uniformity. Noise
CTP 486 300 22 10.0 FBP. Filter: B. Compare with manufacturer Slice thickness (ST) CTP 401 250 18.3 0.8; 1 2.5; 5 FBP. Filter: B. Compare with manufacturer Sensitometry and CT number linearity. 10.0 Measured /Nominal
Contrast scale. 10.0 Establish
reference levels
2.4. Performance evaluation for different reconstruction algorithms
In addition to standard acceptance testing, a series of scans were performed to assess the performance of the IMR reconstruction algorithm against FBP and iDose4 in relation to their CT number accuracy, HCSR, LCR and noise characteristics, and its dependence with CTDIvol. The acquisition and reconstruction parameters for these scans are summarized in Table 2.
For the evaluation of CT number accuracy, the procedure described in section 2.3.6 where repeated using different reconstruction algorithms (FBP, iDose4 level 6, IMR level 3).
For the evaluation of HCSR, ten scans of the CTP528 section were performed in helical mode with different exposure levels. These are summarized in Table 2. Each scan was then reconstructed using FBP, iDose4 (level 7) and IMR (level 1). The maximum number of lp/cm was visually evaluated for each exposure level and reconstruction algorithm, and then plotted against CTDIvol
values. To evaluate the noise dependence with the CTDIvol (for each reconstruction algorithm) an ROI was drawn in the center of the image and the coefficient of variation of the CT number within the ROI was measured.
For the evaluation of LCR, scans of the CTP528 section were performed in helical mode for a range of dose levels (500 to 20 mAs, CTDIvol 36.6 to 1.5 mGy respectively) and were reconstructed using FBP, iDose4 level 6 and IMR level 3. Each dataset was visually assessed by a group of 7 independent observers, who reported the smallest visible pin for each contrast and exposure level. Non-parametric ANOVA tests were performed to compare the results for the three reconstructions algorithms in the extreme of the range exposures to determine if there exists a statistically significative difference in the number of visible pins.
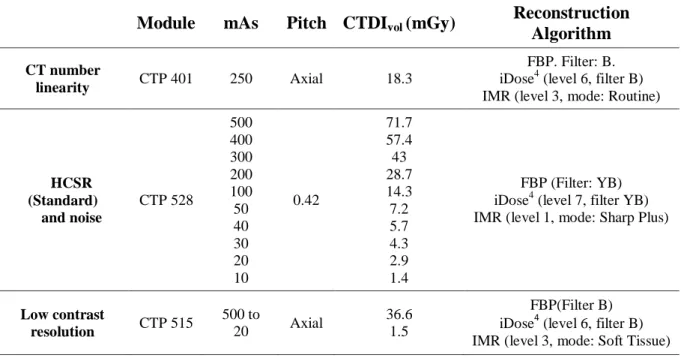
Table 2: Acquisition parameters for testing of reconstruction algorithms.
Module mAs Pitch CTDIvol (mGy)
Reconstruction Algorithm
CT number
linearity CTP 401 250 Axial 18.3
FBP. Filter: B. iDose4 (level 6, filter B) IMR (level 3, mode: Routine)
HCSR (Standard) and noise CTP 528 500 400 300 200 100 50 40 30 20 10 0.42 71.7 57.4 43 28.7 14.3 7.2 5.7 4.3 2.9 1.4 FBP (Filter: YB) iDose4 (level 7, filter YB) IMR (level 1, mode: Sharp Plus)
Low contrast resolution CTP 515 500 to 20 Axial 36.6 1.5 FBP(Filter B) iDose4 (level 6, filter B) IMR (level 3, mode: Soft Tissue)
3. RESULTS AND DISCUSSION
3.1. Positioning and alignment system
When the phantom was placed in the scanner for the first time, it was not possible to match the alignment dots on the phantom body with the laser positioning system. The deviation was greater than 2 mm. This could indicate that the laser lights were not orthogonal to each other. A scan taken over the CTP 401 section showed the wire ramps counter-clockwise skewed. This indicated that the axial laser did not match the actual scan plane.
The alignment of the laser system was corrected and checked again by scanning several aluminum pins placed over the field of view, matching axial and sagittal laser lights. In the resulting image it was verified that each pin lied in a single slice (axial, sagittal or coronal) and that their misalignment with respect to the axial and sagittal axes was less than 2 mm [4,8].
3.2. High contrast spatial resolution
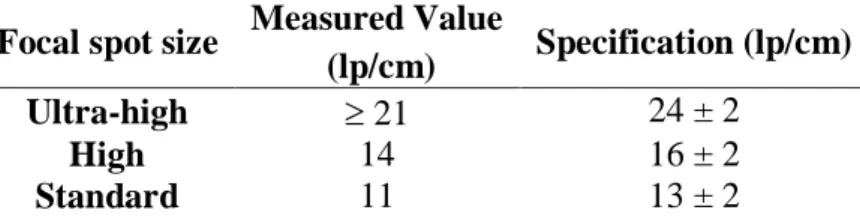
Axial slices of phantom over the CTP 528 section were visually assessed to find the maximum number of lp/cm distinguishable for each focal spot size. The results obtained are shown in Table 3. It was observed that, for all focal spot sizes, the measured value exactly matched the lower limit established by the manufacturer. This may be due to the reconstruction filter used in each case (not specified by the manufacturer). We selected the filters that maximized the number of pairs of observable lines (Table 1).
Table 3: High contrast spatial resolution
Focal spot size Measured Value
(lp/cm) Specification (lp/cm) Ultra-high 21 24 ± 2
High 14 16 ± 2
Standard 11 13 ± 2
For ultra-high mode (smaller focal point), the specification is 24 lp/cm. Since the Catphan® 500 contains only up to 21 lp/cm bar patterns, this test could not be performed.
A phantom with at least 24 lp / cm would be necessary to carry out this test correctly (i.e.: Catphan® 700).
3.3. Low contrast resolution (LCR)
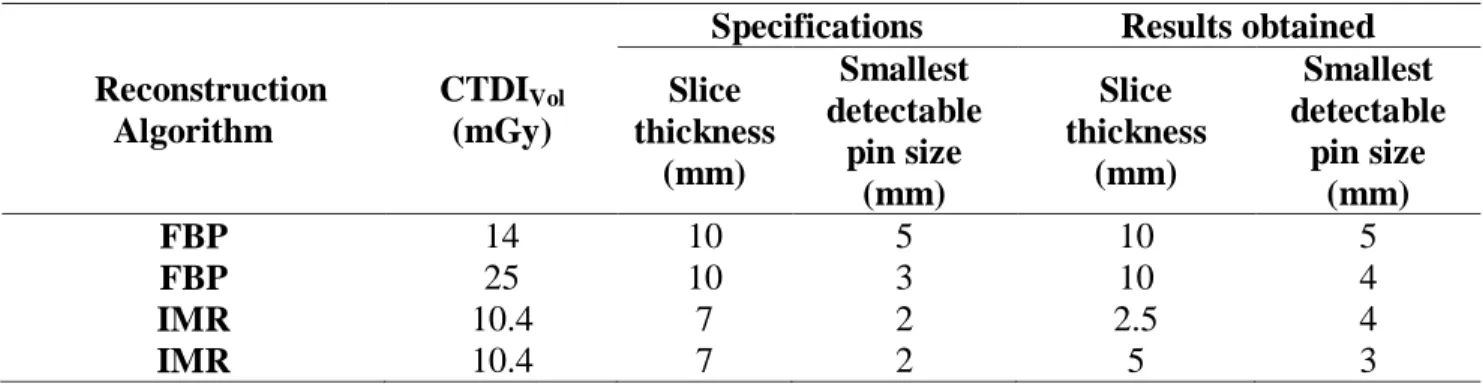
Table 4 shows the smallest pin distinguishable for any of the 6 independent observers. According to the manufacturer, the IMR image must be reconstructed with a slice thickness of 7 mm. Nevertheless, this slice thickness was not available in the reconstruction software. Instead, two different reconstructions were chosen (5 mm and 2.5 mm) and then axially resampled to obtain an equivalent slice thickness of 6.67 and 8 mm (table 5).
Table 4: Low contrast resolution (0.3%).
Reconstruction Algorithm
CTDIVol
(mGy)
Specifications Results obtained Slice thickness (mm) Smallest detectable pin size (mm) Slice thickness (mm) Smallest detectable pin size (mm) FBP 14 10 5 10 5 FBP 25 10 3 10 4 IMR 10.4 7 2 2.5 4 IMR 10.4 7 2 5 3
Table 5: Low contrast resolution (0.3%) with IMR and resampled data. Reconstructed slice thickness (mm) Resampled slice thickness (mm) Smallest detectable pin size
(mm)
5 6.67 4
2.5 6.67 4
5 8 4
2.5 8 3
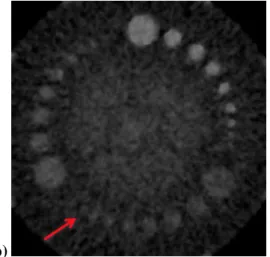
The 2 mm pin could not be distinguished and therefore the result did not comply with the specifications. To some extent, this could be due to the slice thickness not being exactly 7 mm. Since the result was only slightly below specification, this was not considered as a major problem in the system’s performance. Figure 3 shows the same data reconstructed with two different
algorithms: FBP (a) and IMR (b). The improvement in low contrast resolution and noise reduction is clear when using IMR compared to FBP.
Figure 3: Comparison of low contrast resolution for: a) FBP and b) IMR, both with 10.4 mGy. The
arrows show the smallest detectable pin in each case (15mm and 3mm respectively, 0.3% contrast).
a) b)
3.4.CT number, Noise and Uniformity
Table 6 shows the CT number measured in the central part of the uniformity section of the phantom (CTm), along with the absolute difference between central and peripheral ROIs (ΔCT). The values are within specifications. No artifacts were observed in the analyzed images. The test was satisfactory.
Table 6: CTm and noise values obtained for each ROI.
ROI CTm (UH) ΔCT (UH) Specification CV (%) Specification
Central 14.27 2.77 ± 5 0.31 0.20 < N < 0.34 Superior 13.29 -0.99 ± 10 0.30 Inferior 13.18 -1.09 ± 10 0.30 Left 13.27 -1.00 ± 10 0.30 Right 13.30 -0.97 ± 10 0.30
3.5.Slice thickness
The results obtained for this test were (Measured / Nominal): 4.82 / 5; 2.52 / 2.5; 1.24 / 1; 1.09 / 0.8. The smallest percentage difference (0.8%) with respect to the real value was found for 2.5 mm. The test was satisfactory.
3.6.CT number linearity (sensitometry) and contrast scale
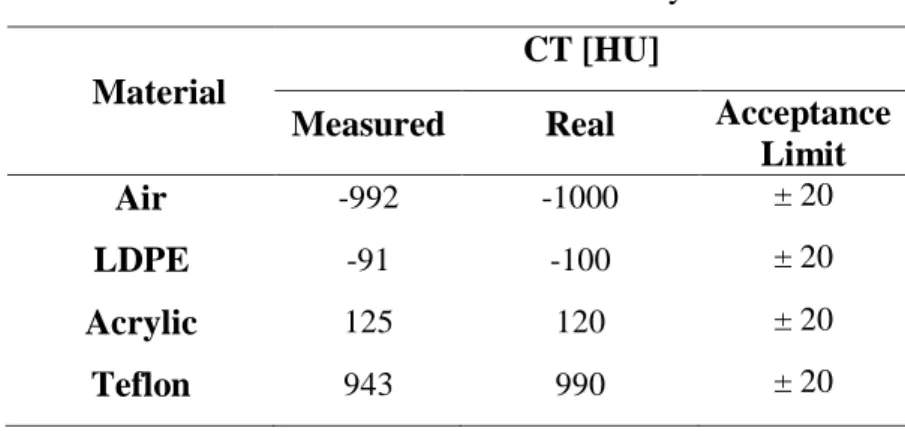
Table 7 shows the CT number obtained for each material present in the CTP401 section, along with the nominal value indicated by the phantom manufacturer. The values for Air, LDPE and acrylic were within the range indicated by the phantom manufacturer and recommended by the literature, while the value for teflon was not. As CT numbers are not universal and may depend on factors like the actual energy spectrum, applied filters and object composition, this does not represent a problem in system’s performance [8].
Table 7: Results of the sensitometry test.
Material
CT [HU]
Measured Real Acceptance Limit
Air -992 -1000 ± 20
LDPE -91 -100 ± 20
Acrylic 125 120 ± 20
Teflon 943 990 ± 20
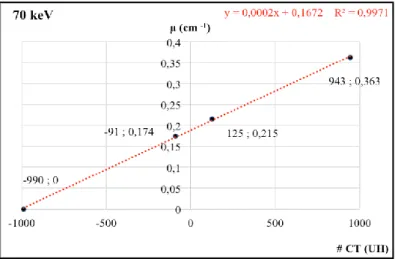
Figure 5 shows, for each material present in the phantom inserts, the relationship between the CT number and the linear attenuation coefficient. The latter are those reported by the phantom manufacturer for each material and for a 70 keV effective energy spectrum [8]. A linear fit was performed to obtain the contrast scale value as the slope of this linear relationship [9]. The value obtained for the contrast scale was 2·10-4 cm-1 HU-1. The tests were satisfactory.
Figure 5: Linear attenuation coefficient Vs CT Number
3.7.Performance evaluation for different reconstruction algorithms
3.7.1. CT number accuracy
Table 8 shows the CT number measured for each material present in the phantom inserts and for each reconstruction algorithm. In all cases the differences are less than the standard deviation within each ROI. The conclusion is that reconstruction algorithm has no significant impact on CT number.
Table 8: CT number dependence on reconstruction algorithm (mean SD).
Material Reconstruction algorithm
FBP iDose4 IMR (3) Air -975 55 -975 56 -995 24 LDPE -92 3 -91 2 -92 2 Acrylic 126 3 125 2 124 2 Teflon 934 50 934 50 951 25
#
CT
(HU
)
3.7.2. High-contrast spatial resolution
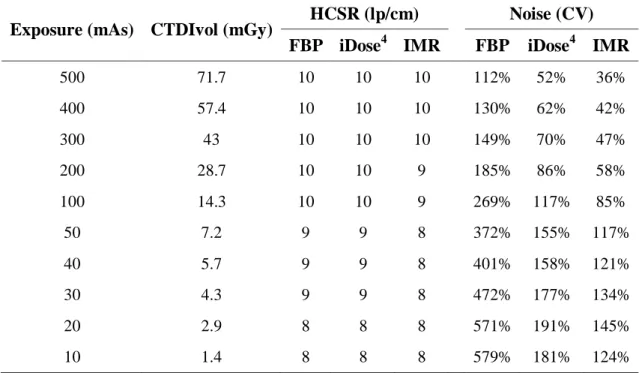
Table 9 shows the HCSR (measured in lp/cm) and noise dependence on CTDIvol for different reconstruction algorithms. It can be seen that using IMR the noise remains relatively constant when the CTDIvol is varied, while it grows exponentially for FBP and iDose4. For CTDIvol below 10 mGy the use of the IMR achieved a noise reduction greater than 80% with respect to FBP. This reduction is achieved with a minimal loss in resolution in some cases (e.g. between 200 and 30 mAs, where the HCSR is 1 lp/cm poorer with IMR than with other algorithms) and with no resolution loss in other cases.
Table 9: Noise and HCSR dependence on CTDIvol for different reconstructions.
Exposure (mAs) CTDIvol (mGy) HCSR (lp/cm) Noise (CV) FBP iDose4 IMR FBP iDose4 IMR
500 71.7 10 10 10 112% 52% 36% 400 57.4 10 10 10 130% 62% 42% 300 43 10 10 10 149% 70% 47% 200 28.7 10 10 9 185% 86% 58% 100 14.3 10 10 9 269% 117% 85% 50 7.2 9 9 8 372% 155% 117% 40 5.7 9 9 8 401% 158% 121% 30 4.3 9 9 8 472% 177% 134% 20 2.9 8 8 8 571% 191% 145% 10 1.4 8 8 8 579% 181% 124%
3.7.3. Low contrast resolution
The number of visible low-contrast pins as a function of CTDIvol is shown in figure 6 for FBP, iDose and IMR. The IMR algorithm achieved a better detection performance at low dose levels when compared with iDose and FBP since the number of visible pins remained almost constant for CTDIvol values down to 4 mGy.
Figure 6: Number of visible pins (Mean and SD) Vs. CTDIvol
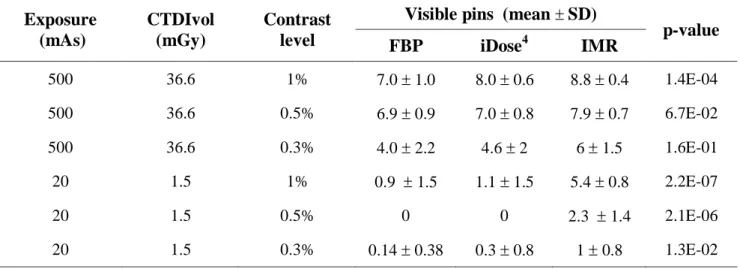
Table 10 shows the mean and standard deviation of the number of visible pins for the extreme values of the exposure range (500 mAs and 20 mAs), contrast level and reconstruction algorithm. In all cases, IMR achieved the best performance, followed by iDose4 and FBP. The p–values indicate that this difference is more significant with higher contrast levels and lower exposure. The standard deviation was in most cases lower when using IMR (i.e. there was lower inter-observer variability.
Table 10: Visible low contrast pins for different exposure levels and reconstruction algorithms
(mean and std for all observers) and p-value for the ANOVA test.
Exposure (mAs) CTDIvol (mGy) Contrast level
Visible pins (mean SD)
p-value FBP iDose4 IMR 500 36.6 1% 7.0 1.0 8.0 0.6 8.8 0.4 1.4E-04 500 36.6 0.5% 6.9 0.9 7.0 0.8 7.9 0.7 6.7E-02 500 36.6 0.3% 4.0 2.2 4.6 2 6 1.5 1.6E-01 20 1.5 1% 0.9 1.5 1.1 1.5 5.4 0.8 2.2E-07 20 1.5 0.5% 0 0 2.3 1.4 2.1E-06 20 1.5 0.3% 0.14 0.38 0.3 0.8 1 0.8 1.3E-02
4.
CONCLUSION
Acceptance testing of a Philips iCT Elite scanner was performed using the Catphan® 500 phantom. Manuals published by phantom and scanner manufacturers were used as references, as well as IAEA, ACR, and AAPM quality control protocols. Image quality and general functionality were evaluated and found to be appropriate for clinical applications. While some parameters were marginally satisfactory (LCR), the overall performance was satisfactory and the results were set as a reference for subsequent quality controls.
In addition, the performance of the different reconstruction algorithms available in the system was evaluated in relation to their CT number accuracy, HCSR, LCR and noise characteristics, and its dependence with CTDIvol. From this evaluation, it can be concluded that the CT number for a set of materials with different densities did not change for different reconstruction algorithms. The images acquired with a CTDIvol of 20 mGy, as shown in table 9, obtained noise values for FBP: 571%, iDose4: 191% and IMR: 145%; which proves that the reconstruction with IMR and iDose4 achieved a significant reduction in noise levels (up to 75% and 65% respectively) in comparison with FBP reconstruction, to low CTDIvol without affecting high contrast resolution (8 lp/cm for all reconstructions). In addition, IMR had a better performance in LCR than iDose4 and FBP, increasing the number of detectable pins and reducing the interobserver variability. For the most critical case (CTDIvol = 1.5 mGy and contrast level = 1%) eight independent observers were able to detect the following average number of pins: FBP = 0.9 1.5, iDose4 = 1.1 1.5 and IMR = 5.4 0.8. This means that low contrast detectability (LCR) is improved with IMR, with lower interobserver variability when compared with other reconstruction algorithms. These results are in accordance with other studies evaluating the effect of IMR on LCR which reported similar conclusions [11]. The real clinical impact of this technology should be assessed, though.
The dosimetric aspects of acceptance testing (i.e. CTDIvol indicator accuracy) where not covered during this test since an appropriate CT dosimetry system was not available but will be performed in the near future.
The Catphan® 500 phantom allowed us to perform acceptance testing, independently of the tools provided by the manufacturer. This is important for comparison between different scanners models and manufacturers.
Overall, we found acceptance testing to be satisfactory. The IMR reconstruction algorithm could be useful to improve low contrast detectability in clinical applications, especially in low-dose settings.
REFERENCES
1. SEERAM, E., Computed Tomography: Physical Principles, Clinical Applications, and
Quality Control, 4th Edition. Philadelphia, EE.UU, 2016.
2. SCIBELLI, A., iDose4 iterative reconstruction technique, Philips Healthcare White Paper, 2011.
3. MEHTA, D; THOMPSON, R; MORTON, T; DHANANTWARI, A; SHEFER, E. Iterative model reconstruction: simultaneously lowered computed tomography radiation dose and improved image quality.Med Phys Int J, v. 1, p. 147-155, 2013.
4. Philips Healthcare. Philips iCT Elite Specifications, 2014.
5. IAEA. Human Health Series, Quality Assurance Programme for Computed Tomography:
Diagnostic and Therapy Applications. Vienna, 2012.
6. ACR. Computed Tomography, Quality Control Manual, 2012.
7. AAPM – American Association of physicists in Medicine. Specification and acceptance
testing of computed tomography scanners. AAPM Report 39, New York, 1993.
8. The Phantom Laboratory, Catphan® 500 and 600 Manual. Salem, NY 2013.
9. JOSINP, N; KEITH, I and RICHARD, A. Linearity and contrast scale control in computed tomography. Med Phys. v. 16 , p. 110-113, 1989.
10. SEFM – Sociedad Español de Física Médica. Protocolo Español de Control de Calidad en
Radiodiagnóstico, Madrid: SEFM, 2011.
11. AURUMSKJÖLD, M; YDSTRÖM, K; TINGBERG A; and SÖDERBERG, M. Improvements to image quality using hybrid and model-based iterative reconstructions: a phantom study. Acta Radiologica. P. 1-9, 2016.