Adaptation of fluorescent technique for genotyping
with new microsatellite markers in common bean
Paula Rodrigues Oblessuc(1), Tatiana de Campos(2), Juliana Morini Kupper Cardoso(1), Danilo Augusto Sforça(2),
Renata Moro Baroni(1), Anete Pereira de Souza(2) and Luciana Lasry Benchimol(1)
(1)Instituto Agronômico, Centro de Pesquisa e Desenvolvimento de Recursos Genéticos Vegetais, Fazenda Santa Elisa, Caixa Postal 28,
CEP 13001-970 Campinas, SP, Brazil. E-mail: parobl@gmail.com, julianamorini@hotmail.com, renatabaroni19@gmail.com, llasry@iac.sp.gov.br
(2)Universidade Estadual de Campinas, Departamento de Genética e Evolução, Instituto de Biologia, CEP 13083-970 Campinas, SP, Brazil.
E-mail: tatyuni@unicamp.br, obelix_mail@yahoo.com.br, anete@unicamp.br
Abstract – The objectives of this work were to adapt the fluorescent labeling polymerase chain reaction (PCR) technique using M13 universal primer for genotyping purposes, and to present a new set of microsatellite markers for common bean (Phaseolus vulgaris L.). A large population (380 common bean lines) was used
for microsatellite genotyping. PCR fluorescent labeling method showed to be very efficient for multiplex analysis, providing lower costs and saving time, thus increasing the quality of genotyping analysis. A new set of 50 microsatellites developed from an enriched library derived from cultivar IAC‑UNA was presented. This study provides better tools for assisting common bean breeding programs.
Index terms:Phaseolus vulgaris, fluorescence, molecular marker, multiplex analysis.
Adaptação da técnica de fluorescência para fins de genotipagem
com novos marcadores microssatélite em feijoeiro
Resumo – Os objetivosdeste trabalho foram adaptar a técnica de marcação fluorescente de produtos da reação em cadeia da polimerase (PCR) com uso do iniciador universal M13, para aplicação em genotipagem, e apresentar novos marcadores microssatélite para o feijoeiro (Phaseolus vulgaris L.). Uma população de grande tamanho
amostral (380 linhagens) foi utilizada para genotipagem dos microssatélites. O método de PCR marcado por fluorescência demonstrou ser muito eficiente para a análise “multiplex” e proporcionou a redução de custos e ganho de tempo, aumentando a qualidade de análise da genotipagem. Foram apresentados 50 novos locos de microssatélites, desenvolvidos a partir de biblioteca enriquecida a partir da cultivar IAC‑UNA. Este estudo fornece ferramentas melhores para assistir aos programas de melhoramento do feijoeiro.
Termos para indexação:Phaseolus vulgaris, fluorescência, marcador molecular, análise multiplex.
Microsatellite genotyping is widely used nowadays for different goals, such as diversity studies and genetic mapping. Microsatellites (Simple Sequence Repeats – SSRs) are molecular markers characterized as small DNA sequences of one to six base pairs tandemly repeated, spread all over the genome of plants and animals (Li et al., 2002; Varshney et al., 2005). They are multiallelic, codominant and have Mendelian inheritance. Moreover, they are easy to assay and are reproducible by polymerase chain reaction (PCR). Currently, the most used technique for SSR genotyping is the 6% polyacrylamide gel electrophoresis stained with silver nitrate (Creste et al., 2001). However, this method is time consuming and costly, especially when working with a large amount of individuals.
M13 universal primer is a sequence derived from a bacterial vector (David et al., 1993). This primer is fluorescent‑labeled for genotyping in high performance sequencing procedures. The forward SSR primer should contain a tail sequence complementary to the M13 in its 5’ region, allowing the annealing of the M13 fluorescent‑ labeled primer to the PCR products generated in each cycle. Consequently, this method confers fluorescence to the final PCR products (Schuelke, 2000). The reverse SSR primer is maintained unaltered.
Alternatively, Missiaggia & Grattapaglia (2006) reported the use of three human sequences of 20 bp without significant complementarities to plant genome for microsatellite genotyping in Eucalyptus. These sequences were used as labeled primers. They
performed multiplex genotyping by labeling each primer with different fluorophores and were able to differentiate the three SSRs in a single run.
M13 primer has advantages over other techniques because it provides the ability of working with a unique tail sequence and avoids the need for using several different microsatellites. Thus, for multiplex purpose, the only necessary condition is to change the fluorescent colors to label different PCR products of each microsatellite. Moreover, scoring patterns are performed totally by automation using a software that allows the interaction between the generated peak files and the genotyping per se. This technique is indicated when a large amount of data has to be analyzed at the same time. Until now, there has been no report of the use of fluorescent‑labeled microsatellite primers for genetic mapping purposes in common bean (Phaseolus
vulgaris L.). In fact, beans are a good model to work
with due to their diploid nature (2n = 22) and small genome (Broughton et al., 2003; Schlueter et al., 2008). Microsatellite markers have been developed for beans from published sequences and from microsatellite‑enriched libraries (Gepts et al., 2008). A large number of microsatellites for common bean are already available, some of them with known map positions. However, the amount of microsatellite markers is not enough to support neither QTL mapping nor diversity studies, once there are lot gaps on common bean genetic maps to be solved and, consequently, new agronomically important loci could still be found. Likewise, there is the need for developing and releasing additional markers, together
with enhancing the microsatellite genotyping process for large based populations.
The objectives of this work were to describe the adaptation of genotyping processes with increased efficiency for mapping purposes through fluorescent‑ labeling PCR products using M13 universal primer, and to present a new set of microsatellite markers for common bean. In order to adapt this approach for common bean, 50 new SSRs (Table 1) were used. These SSRs were developed from an IAC‑UNA microsatellite‑enriched library according to Benchimol et al. (2007) and have never been published. Each forward SSR primer had an 18 bp tail added (5’‑TGT AAA ACG ACG GCC AGT‑3’) complementary to M13 primer. Two different fluorescences were used to label the M13 primer: 6‑FAM (blue) and HEX (green), with a multiplex goal. The amplicons were sequenced with a 3730 DNA sequencer (Applied Biosystems) and analyzed with GeneMapper v.3.7 software. The first step in a genotyping process with fluorescent‑ labeled microsatellites is to optimize PCR reactions. In this study, SSR‑specific annealing temperatures have already been determined (56 or 60ºC). When starting the fluorescent‑labeled PCR optimization, it was decided not to alter each primer‑specific annealing temperature (SSRs have been previously optimized without the tag) for speeding up the process of genotyping in the high performance sequencer. Since the M13 primer needs a 53ºC annealing temperature, eight final cycles were added at the end of PCR cycles to allow the annealing of the M13 labeled with the previously formed amplicons. For that reason, at the end of the PCR, a satisfactory amount of amplicons labeled with fluorescence could be generated, once the reaction is exponential.
Based on the procedures described above, amplification reactions were performed in the following conditions: 94ºC (1 min), then 30 cycles at 94ºC (1 min)/specific annealing temperature (56 or 60ºC) for each SSR (1 min)/72ºC (1 min), followed by 8 cycles at 94ºC (1 min)/53ºC (1 min)/72ºC (1 min), and a final extension at 72°C for 10 min.
This result was expected, since the forward primer cannot compete with the labeled M13, as it is necessary only in the first cycles. Therefore, the amplicons were produced with a smaller concentration of the forward primer in comparison to the labelled M13, so as to guarantee that the PCR products become fluorescent in the sequencer.
This way, in order to guarantee a good amplification of every microsatellite product, it was established that reaction should contain 30 ng DNA, 1U Taq‑DNA
polymerase, 1.5 mmol L-1 magnesium chloride,
0.15 mmol L-1 of each dNTP, 1x buffer, 0.8 pmol μL-1
reverse primer and labeled M13 and 0.2 pmol μL-1
forward primer, with a final volume of 15 μL.
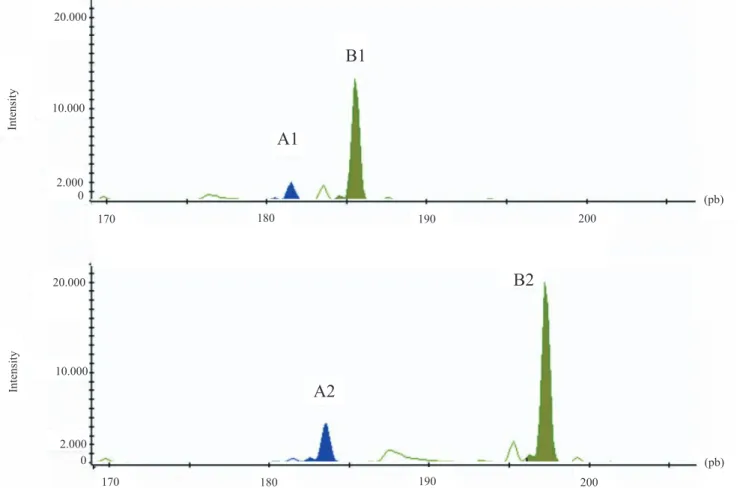
The samples were prepared for sequencing based on the conditions recommended by Applied Biosystems, with variations regarding the quantity of PCR product and of GeneScan ROX 500 (Applied Biosystems). However, peaks with higher intensity were obtained with 1.5 μL of the product from
Table 1. A set of 50 new microsatellite markers obtained from an enriched library from the common bean cultivar IAC‑UNA.
each PCR, since the analyses were performed in multiplex, with 9 μL formamide and 0.4 μL ROX 500 standard (Figure 1). It was possible to obtain great differentiation of analyzed SSRs in the multiplex process, even for those amplicons with similar sizes, since the software enables independent visualization of different fluorescences for allele identification with a precision of 1 bp.
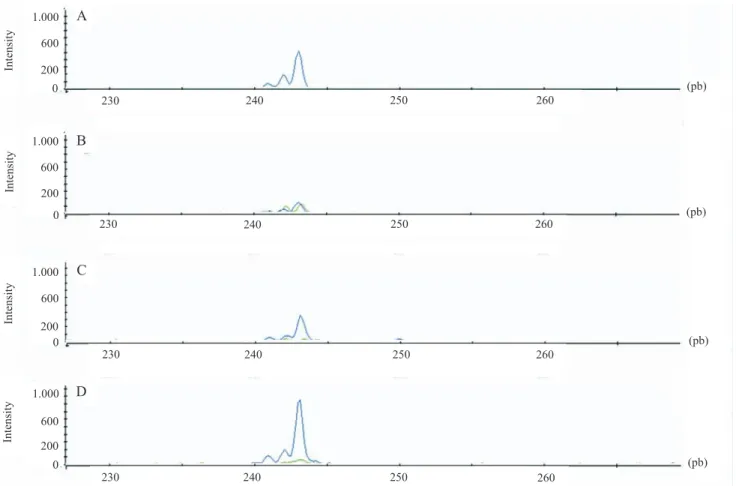
In order to optimize allele identification, PCR sample purification was also tested before being submitted to the sequencer. The hypothesis was that this step could possibly eliminate salt contamination present in the PCR and optimize the results. Purification was performed using isopropanol. After drying, samples were resuspended in pure water, re‑establishing the final volume of 15 μL per sample. Similar to what was done
previously, different volumes of PCR products were tested along with size standard, and the best result was found for approximately 1.5 μL of each PCR product, 9 μL formamide and 0.4 μL size standard (Figure 2).
The best optimization condition for fluorescent‑ labeled microsatellite PCR (Table 2 – condition 1) was used for microsatellite genotyping of 380 common bean lines for genetic mapping purposes towards
reducing general costs and time expenses. In fact, all 50 microsatellites presented a satisfactory signal on DNA sequencer in multiplex analyses, allowing the genotyping of all lines quickly and accurately. Even so, same amplicons showed better signals then others.
Fluorescence PCR‑labeled technique using the M13 universal primer is an easy method to assay and very interesting to speed up data scoring, producing
high-Table 2. Four polymerase chain reaction (PCR) conditions tested for genotyping by fluorescent‑labeled microsatellite in common bean. Each amplification condition involves only different concentrations of the three primers involved in PCR (M13 primer, reverse and forward‑tail). Other reagents were kept in fixed concentrations.
Primers Condition 1 Condition 2 Condition 3 Condition 4
M13 primer 0.8 pmol μ L-1 0.16 pmol μ L-1 0.08 pmol μ L-1 0.8 pmol μ L-1 Reverse primer 0.8 pmol μ L-1 0.16 pmol μ L-1 0.8 pmol μ L-1 0.8 pmol μ L-1 Forward-tail primer 0.2 pmol μ L-1 0.04 pmol μ L-1 0.8 pmol μ L-1 0.8 pmol μ L-1
throughput genotyping, especially for the purpose of mapping large segregant populations with a huge number of markers. This fluorescent‑based genotyping showed to be faster than the silver staining genotyping method with polyacrylamide gels. It was also more practical to use universal M13 primers than labeling each microsatellite primer with a specific fluorescence. These results reinforce the high analysis capacity of this method, reducing time, costs and labor.
Acknowledgements
To Dr. Marcos Antônio Machado and Dr. Marcos Takita at Centro de Citricultura Sylvio Moreira, Instituto Agronômico, Cordeirópolis, SP, Brazil, who kindly provided the 3730 DNA analyzer (Applied Biosystems); to Fundação de Amparo à Pesquisa do Estado de São Paulo, for the financial support and the scholarship granted.
References
BENCHIMOL, L.L.; CAMPOS, T. de; CARBONELL, S.A.M.; COLOMBO, C.A.; CHIORATTO, A.F.; FORMIGHIERI, E.F.; GOUVÊA, L.R.L.; SOUZA, A.P. de. Structure of genetic diversity among common bean (Phaseolus vulgaris L.) varieties of Mesoamerican and Andean origins using new developed microsatellite markers.
Genetic Resources and Crop Evolution,v.54, p.1747‑1762, 2007.
BROUGHTON, W.J.; HERNÁNDEZ, G.; BLAIR, M.; BEEBE, S.; GEPTS, P.; VANDERLEYDEN, J. Beans (Phaseolus spp.) ‑ model food legumes. Plant and Soil, v.252, p.55-128, 2003.
CRESTE, S.; TULMANN NETO, A.; FIGUEIRA, A. Detection of single sequence repeat polymorphisms in denaturing polyacrylamide sequencing gels by silver staining. Plant Molecular Biology Reporter, v.19, p.299-306, 2001.
DAVID, L.S.; SCOTT, L.S.; STEPHEN, C.R. An alternate universal forward primer for improved automated DNA sequencing of M13.
BioTechniques, v.15, p.580-582, 1993.
GEPTS, P.; ARAGãO, F.J.L.; BARROS, E. de; BLAIR, M.W.; BRONDANI, R.; BROUGHTON, W.; GALASSO, I.; HERNÁNDEZ, G.; KAMI, J.; LARIGUET, P.; MCCLEAN, P.; MELOTTO, M.; MIKLAS, P.; PAULS, P.; PEDROSA
-Intensity 1.000 600 200 Intensity A
230 240 250 260
(pb) (pb) (pb) (pb) 0 0 1.000 200 600 Intensity
230 240 250 260
B 1.000 200 600 0 Intensity
230 240 250 260
C 1.000 200 600 0 D
230 240 250 260
Intensity
HARAND, A.; PORCH, T.; SÁNCHEZ, F.; SPARVOLI, F.; YU, K. Genomics of Phaseolus beans, a major source of dietary protein and micronutrients in the tropics. In:Genomics of Tropical Crop
Plants. New York: Springer Press, 2008. v.1. p.113‑143.
LI, Y.C.; KOROL, A.B.; FAHIMA, T.; BEILES, A.; NEVO, E. Microsatellites: genomic distribution, putative functions and mutational mechanisms: a review. Molecular Ecology, v.11, p.2453-2465, 2002.
MISSIAGGIA, A.; GRATTAPAGLIA, D. Plant microsatellite genotyping with 4‑color fluorescent detection using multiple‑ tailed primers. Genetics and Molecular Research, v.5, p.72‑78,
2006.
OETTING, W.S.; LEE, H.K.; FLANDERS, D.J.; WIESNER, G.L.; SELLERS, T.A.; KING, R.A. Linkage analysis with multiplexed
Received on February 10, 2009 and accepted on May 25, 2009
short tandem repeat polymorphisms using infrared fluorescence and M13 tailed primers. Genomics,v.30, p.450-458, 1995. SCHLUETER, J.A.; GOICOECHEA, J.L.; COLLURA, K.; GILL, N.; LIN, J.Y.; YU, Y.; KUDRNA, D.; ZUCCOLO, A.; VALLEJOS, C.E.; MUÑOZ‑TORRES, M.; BLAIR, M.W.; TOHME, J.; TOMKINS, J.; MCCLEAN, P.; WING, R.A.; JACKSON, S.A. BAC‑end sequence analysis and a draft physical map of the common bean (Phaseolus vulgaris L.) genome.
Tropical Plant Biology, v.1, p.40-48, 2008.
SCHUELKE, M. An economic method for the fluorescent labeling of PCR fragments. Nature Biotechnology, v.18, p.233-234, 2000. VARSHNEY, R.K.; GRANER, A.; SORRELLS, M.E. Genic microsatellite markers in plants: features and applications. Trends