Development and characterizaion of
microsatellite loci for the Neotropical orchid
Trichocentrum pumilum
Lia Maris Orth Riter Aniqueira
1, Gabriel Dequigiovanni
2, Evan
-dro Vagner Tambarussi
3, Jucelene Fernandes Rodrigues
2and
Elizabeth Ann Veasey
2*Abstract: Studies of geneic diversity and structure are key elements in de -signing efecive in situ and ex situ management plans, especially for species experiencing forest fragmentaion. To invesigate the level of geneic diversity in populaions of Trichocentrum pumilum, eight polymorphic microsatellite loci were developed and used for genotyping 96 specimens from four disturbed populaions. Low geneic diversity within populaions was found (average number of alleles per locus ranging from 3.75 to 4.25, observed and expected heterozygosiies from 0.238 to 0.333 and from 0.450 to 0.482, respecively). The ixaion index (FIS) ranged from 0.35 to 0.47, with signiicant values for
all populaions. No genotypic disequilibrium was detected. A mixed breeding system was found through an apparent outcrossing rate esimate. Our results suggest that these microsatellite loci are suitable for geneic studies of this spe -cies, showing low within populaion geneic diversity and moderate structure for T. pumilum populaions.
Key words: Conservaion geneics, geneic diversity, Orchidaceae, populaion geneics, tropical orchid species.
Crop Breeding and Applied Biotechnology 16: 355-360, 2016
Brazilian Society of Plant Breeding. Printed in Brazil
htp://dx.doi.org/10.1590/1984-70332016v16n4n52 NOTE
*Corresponding author:
E-mail: [email protected]
Received: 13 May 2016 Accepted: 01 September 2016
1 Federal University of Technology - Paraná,
Av Monteiro Lobato, km 4, 84.021-216, Ponta Grossa, PR, Brazil
2 University of São Paulo, Luiz de Queiroz Col
-lege of Agriculture, Av. Padua Dias, 11, PO Box 9, 13418-900, Piracicaba, SP, Brazil
3 State University of Central West, PR 153, km
7, 84.500-000, Irai, PR, Brazil
INTRODUCTION
The orchid family is one of the largest groups among vascular plants, corresponding to 10% of all flowering plants (Otero and Flanagan 2006).
Trichocentrum pumilum (Lindl.) M. W. Chase & N.H. Williams is an epiphyic
orchid with common occurrence in Brazil (Barros et al. 2013). This species is oten found in gallery forest between the vegetaion of semi-deciduous forest. It is considered to be self-incompaible and pollinator-limited, being exclusively visited and pollinated by two bee species (Tetrapedia diversipes and Lophopedia nigrispinis) (Pansarin and Pansarin 2011). The lowers are yellowish or greenish yellow with brown spots. In January, during fruit development, each plant produces a new pseudobulb, which someimes produces a new lateral inlorescence for the next lowering season. The fruits come into dehiscence from June/July (Pansarin and Pansarin 2011).
(Almeida et al. 2013, Novello et al. 2013, Tambarussi et al. 2016), among others. However, there are no previous reports of geneic studies for T. pumilum and no informaion on the level of geneic diversity of its populaions. Thus, this study aimed at the development of microsatellite markers and geneic characterizaion of four disturbed T. pumilum
populaions in order to generate useful informaion aiming at conservaion strategies.
MATERIAL AND METHODS
Sampling procedures
Twenty-four individuals per populaion were sampled from four populaions, at the municipaliies of Iracemápolis (IRA), Santa Maria da Serra (SM), and São Pedro, in the State of São Paulo, Brazil (Figure 1). Populaions sampled in São Pedro municipality were obtained in diferent areas of privately owned forest, one in São Pedro (SP) and the other in Alto da Serra (AS), at a higher alitude. All four populaions
were collected in forest fragments, next to agricultural landscape. The distance between populaions varied from 1.6 (AS and SP) to 62.0 (IRA and SM) kilometers. Specimens of each populaion were deposited at the herbarium of the Escola Superior de Agricultura “Luiz de Queiroz”, University of Sao Paulo, under the numbers ESA127076 and ESA127077.
DNA extracion, design, opimizaion of primers and sequencing/genotyping
DNA extracion from fresh leaves was based on Doyle and Doyle (1990), modiied by Rodrigues et al. (2015). DNA quaniicaion was performed on 1% agarose gels stained with GelRed (Bioium). Genomic library to obtain microsatellite markers was developed following Billote et al. (1999). DNA digesion, microsatellite enrichment, transformaion of competent cells and sequencing of recombinant colonies were based on Tambarussi et al. (2013). We obtained 288 transformed clones, which were sequenced using universal T7 and SP6 primers with a BigDye v3.1 terminator kit on an ABI 3130XL
Geneic Analyzer automated sequencer (Applied Biosystems, Foster City, USA). The sequences obtained were transformed in a FASTA format by BioEdit Sequence Alignment Editor program (Hall 1999) and vectors and adapters sequences were excluded. The program Websat (Marins et al. 2009) allowed the ideniicaion of microsatellite sequences. The parameters used for the ideniicaion of microsatellites were: dinucleoide length ≥5nt; tri-, tetra-, penta-, hexanucleoide with a repeat length ≥3 nucleoides. Primers were designed using Primer3 (Rozen and Skaletsky 2000) considering the following criteria: annealing temperature ranging from 54 ° to 62 °C, guanine and cytosine content between 40 and 60% and range between 100 and 300 base pairs. Gene Runner v.3.1 sotware (Spruyt and Buquicchio 1994) was used to conirm the values for each of the parameters and to indicate the formaion of secondary structures which are undesirable. Finally, Chromas2 sotware (McCarthy 1996) was used to assess the quality of the sequencing primers and the regions of the microsatellites. All forward primers were labeled with M13 sequence (5’- TGTAAAACGACGGCCAGT-3′) following a labeling protocol (Schuelke 2000).
The opimizaion of the microsatellites loci, conducted using six individuals per populaion, allowed the establishment of the opimal protocol and the appropriate temperature for each ampliicaion primer. Microsatellite fragments were ampliied using a MyCycler Thermal Cycler (Bio-Rad, Hercules, CA, USA) in a total reacion volume of 10 μL, containing 20 ng of genomic DNA template, 1 U Taq DNA polymerase (Fermentas, Vilnius, Lithuania), 1X polymerase chain reacion bufer (10 mM Tris-HCl (pH 8.3), 50 mM KCl, 1.5 mM MgCl2, 0.08% Nonidet P40), 0.25 mM each dNTP, 1.5mM MgCl2,
2.5 pmols of forward and M13 label primers (FAM, HEX or NED dyes) and 5 pmols of reverse primers. Polymerase chain reacion was carried out according to Schuelke (2000), consising of 94 °C (5 min), then 30 cycles at 94 °C (30 s)/Ta °C (45 s) (Ta= annealing temperature (Table 1)/72 °C (45 s), followed by 8 cycles at 94 °C (30 s)/53 °C (45 s)/72 °C (45 s), and a inal extension at 72 °C for 10 min. Allele sizes were determined using the ABI 3130xl Geneic Analyzer System (Applied Biosystems) at the Research Centre on the Human Genome and stem Cells of University of São Paulo. SSR paterns
Figure 1. Collecion sites of Trichocentrum pumilum in the State
were scored based on the size standard ROX GSx500 (Life Technologies Inc.) using GENEMAPPER sotware v4.0 (Applied Biosystems). Ater selecing the polymorphic primers, 24 individuals from each populaion were genotyped using the same laboratory faciliies and equipment cited above.
Data analysis
Fixaion index (FIS), genotypic disequilibrium, number of alleles per locus (k), observed (Ho) and expected heterozygosity (He) at Hardy-Weinberg equilibrium for each locus and as an average across all loci were esimated using FSTAT (Goudet
2002). To test whether FISand linkage disequilibrium between pairwise loci were signiicantly diferent from zero, we used Monte Carlo permutaions of alleles between individuals and a Bonferroni correcion (95%; α= 0.05). A global F-staisics analysis was obtained using GenAlex sotware (Peakall and Smouse 2012). The parameter apparent outcrossing rate (tˆa)
was esimated considering the equaion tˆa = [(1–F)/(1+F)] (Vencovsky 1994) for each populaion.
RESULTS AND DISCUSSION
Two hundred and eighty-eight posiive clones from the library were sequenced. A set of 30 microsatellite primers were developed (Table S1). From these 30 loci, eight were found to be polymorphic (Table 1). A low to moderate geneic diversity was found within T. pumilum populaions. The number of alleles per loci ranged from one to eight, with averages of 4.00, 4.12, 4.25 and 3.75 for AS, IRA, SM and SP populaions, respecively (Table 2). For the total sample considering all populaions, we found 43 diferent alleles, with four private alleles within populaions (data not shown). Ho and He
ranged from 0.238 to 0.333 and from 0.450 to 0.482, respecively; FIS was signiicantly higher than zero for all populaions, varying from 0.35 (SP) to 0.47 (SM), suggesing excess of homozygotes (Table 2). Ater Bonferroni correcion, no genotypic disequilibrium was detected in the studied populaions (data not shown). F-staisics (FIS= 0.337; FST = 0.064; FIT = 0.417) conirmed moderate levels of geneic structure, showing that most of the diversity is within populaions.
T. pumilum apparently is not under threat or in danger of exincion (IUCN 2002). However, the four populaions considered in our study, collected from fragmented forest areas in the State of São Paulo, showed low within geneic variability, similar to the indings of Pandey et al. (2015) with Cypripedium kentuckiense, a terrestrial orchid naive to North
America (A = 4.00; Ho = 0.436; He = 0.448), which might be indicaive of the occurrence of evoluionary processes, such
as populaion fragmentaion, reducion in gene low and geneic drit, leading to a decrease of geneic diversity. Higher levels of geneic diversity were found by Trapnell et al. (2015) evaluaing ive populaions of the epiphyic Dendrobium
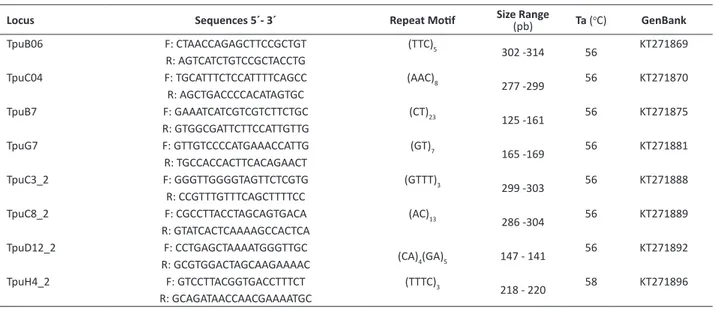
Table 1. Microsatellite loci developed for Thichocentrum pumilum, including the primer name, forward and reverse sequences, repeat moif, size range, annealing temperatures (Ta) and the GenBank registraion number
Locus Sequences 5´- 3´ Repeat Moif Size Range(pb) Ta (oC) GenBank
TpuB06 F: CTAACCAGAGCTTCCGCTGT (TTC)5
302 -314 56 KT271869
R: AGTCATCTGTCCGCTACCTG
TpuC04 F: TGCATTTCTCCATTTTCAGCC (AAC)8
277 -299 56 KT271870 R: AGCTGACCCCACATAGTGC
TpuB7 F: GAAATCATCGTCGTCTTCTGC (CT)23
125 -161 56 KT271875
R: GTGGCGATTCTTCCATTGTTG
TpuG7 F: GTTGTCCCCATGAAACCATTG (GT)7
165 -169 56 KT271881 R: TGCCACCACTTCACAGAACT
TpuC3_2 F: GGGTTGGGGTAGTTCTCGTG (GTTT)3
299 -303 56 KT271888 R: CCGTTTGTTTCAGCTTTTCC
TpuC8_2 F: CGCCTTACCTAGCAGTGACA (AC)13
286 -304 56 KT271889 R: GTATCACTCAAAAGCCACTCA
TpuD12_2 F: CCTGAGCTAAAATGGGTTGC
(CA)4(GA)5 147 - 141
56 KT271892
R: GCGTGGACTAGCAAGAAAAC
TpuH4_2 F: GTCCTTACGGTGACCTTTCT (TTTC)3
calamiforme from Australia(A =3.6; Ho = 0.489; He = 0.591), Mallet et al. (2014) with 10 populaions of the epiphyic Jumellea rossii (A =9.2; Ho = 0.463; He = 0.750), Kartzinel et al. (2013) studying 12 populaions of Epidendrum irmum
(A =12.4; Ho = 0.785; He = 0.834), as well as Pinheiro et al. (2013) studying populaions of E. deniculatum, including a
populaion from a neighboring town in our study (Iirapina/SP), with Ho ranging from 0.331 to 0.516, and He from 0.395
to 0.529, all with nuclear SSR markers.
The apparent outcrossing rate (tˆa) showed values below 0.60 for each T. pumilum populaion, averaging 0.508,
which is an indicaion that this species presents a mixed maing system, which may explain the higher levels of ixaion index and lower levels of geneic diversity. Similar values of apparent outcrossing rate (tˆa =0.43) was found for Catleya
walkeriana (Tambarussi et al. 2015). Besides the mixed breeding system found for T. pumilum, populaion fragmentaion may also be a factor leading to lower geneic diversity values, since small fragmented populaions may sufer severe loss of geneic diversity due to reducion in gene low and geneic drit, and may experience exincion of the populaion in the long-term (Hamrick and Godt 1989). These are sill speculaive ideas, but future studies must also explore the putaive role of fragmented and non-fragmented forest areas related to the loss of geneic diversity that could be tested with an increased number of populaions.
In conclusion, the eight polymorphic loci reported in this study have proven to be useful for populaion geneics
studies in T. pumilum. This is the irst geneic study on this species, showing important data related to the geneic
diversity of four populaions and a preliminary indicaion of its mixed reproducive system, which should be of use in conservaion programs and for further studies with other T. pumilum populaions.
Table 2.Geneic diversity parameters in 24 individuals of Trichocentrum pumilum for each populaion using eight microsatellite loci, including the number of alleles (k), the observed (Ho) and expected heterozygosiies (He), and the ixaion index within populaions (FIS)
Alto da Serra Iracemápolis
Locus k Ho He FIS k Ho He FIS
TpuB06 2 0.167 0.160 -0.07 2 0.208 0.190 -0.09
TpuC04 7 0.772 0.760 -0.02 8 0.834 0.792 -0.05
TpuB7 8 0.318 0.880 0.64* 8 0.042 0.839 0.95*
TpuG7 3 0.150 0.620 0.76* 3 0.143 0.606 0.76*
TpuC3_2 3 0.374 0.630 0.41 3 0.524 0.629 0.16
TpuC8_2 6 0.416 0.460 0.08 5 0.381 0.376 -0.01
TpuD12_2 1 NE** 0.000 NE 2 1.000 0.130 -0.05
TpuH4_2 2 0.095 0.260 0.63* 2 0.091 0.245 0.62* Mean 4.00 0.333 0.460 0.39* 4.12 0.318 0.476 0.38*
SD*** 2.62 0.231 0.308 0.345 2.59 0.284 0.277 0.43
Total 32 - - - 33 -
-Santa Maria São Pedro
Locus k Ho He FIS k Ho He FIS
TpuB06 3 0.174 0.170 -0.05 2 0.170 0.082 -0.02
TpuC04 6 0.400 0.590 0.32 6 0.539 0.732 0.09
TpuB7 8 0.273 0.840 0.68* 8 0.292 0.841 0.65*
TpuG7 3 0.227 0.680 0.66* 3 0.266 0.635 0.60*
TpuC3_2 3 0.250 0.230 -0.10* 3 0.195 0.632 0.14
TpuC8_2 7 0.458 0.780 0.41 4 0.574 0.732 0.26
TpuD12_2 2 0.000 0.080 1.00* 2 0.085 0.082 -0.02
TpuH4_2 2 0.125 0.260 0.51* 2 0.088 0.121 0.66* Mean 4.25 0.238 0.450 0.47* 3.75 0.276 0.482 0.35* SD 2.38 0.146 0.300 0.40 2.19 0.188 0.327 0.30
Total 34 - - - 30 - -
-*P<0.05 ater a Bonferroni correcion for muliple tests **NE: not esimated
ACKNOWLEDGEMENTS
The authors wish to thank FAPESP for scholarships, especially the one atributed to the irst author, which was also used to inance this study (Grant #2013/13918-6). EAV was supported by a CNPq research fellowship. The authors wish to thank Patricia Dias Santos for the contribuion in the primers development.
REFERENCES
Almeida PRM, Roberts MCL, Vignada BBZ, Souza AP, Goes Neto AN and Van Den Berg C (2013) Microsatellite markers for the endangered orchids Catleya labiata Lindl. and C. warneri T. Moore (Orchidaceae).
Conservaion Geneics Resources 5: 791-794.
Barros FD, Vinhos F, Rodrigues VT, Barberena FFVA, Fraga CN, Pessoa EM, Forster W and Menini Neto L (2013) Orchidaceae. In Lista de espécies
da lora do Brasil. Jardim Botânico do Rio de Janeiro. Available at
<http://floradobrasil.jbrj.gov.br/ jabot/floradobrasil/FB11942>. Accessed in Jan, 2016.
Billote N, Lagoda PJR, Risterucci AM and Baurens FC (1999) Microsatellite-enriched libraries: applied methodology for the development of SSR markers in tropical crops. Fruits 54: 277-288.
Cai X, Feng Z, Hou B, Xing W and Ding X (2012) Development of microsatellite markers for geneic diversity analysis of Dendrobium
loddigesii Rolfe, an endangered orchid in China. Biochemical
Systemaics and Ecology43: 42-47.
Doyle J and Doyle J (1990) Isolaion of plant DNA from fresh issue. Focus 12: 13-15.
Goudet J (2002) FSTAT, a program to esimate and test gene diversiies and ixaion indices (Version 2.9.3.2). Available at < htp://www2.unil.ch/ popgen/sotwares/ fstat.htm>. Accessed in April, 2016.
Hall TA (1999) BioEdit: a user-friendly biological sequence alignment editor and analysis program. Nucleic Acids SymposiumSeries 41: 95-98. Hamrick JL and Godt MJW (1989) Allozyme diversity in plant species. In
Brown AHD, Clegg MT, Kahler AL and Weir BS (eds) Plant populaion
genetics, breeding and genetic resources. Sinauer Associates,
Sunderland, p. 43-63.
IUCN - Internaional Union for the Conservaion of Nature (2002) Red list of threatened species. Available at < htp://www.iucnredlist.org >. Accessed in Feb, 2016.
Kalia RK, Rai MK, Kalia S, Singh RA and Dhawan AK (2011) Microsatellite markers: an overview of the recent progress in plants. Euphyica 177: 309-334.
Kartzinel TR, Sheferson RP and Trapnell DW (2013) Relaive importance of pollen and seed dispersal across a Neotropical mountain landscape for an epiphyic orchid. Molecular Ecology 22: 6048-6059. McArthy M (2011) Chromas. v 2.01. School of Health Science, Griith
University, Australia. 1996-1998. Available at <htp://technelysium. com.au/chromas.html>. Accessed in Nov, 2011.
Mallet B, Martos F, Blambert L, Pailler T and Humeau L (2014) Evidence for isolaion-by-habitat among populaions of an epiphyic orchid
species on a small oceanic island. Plos One 9: e87469.
Marins WS, Lucas DCS, Neves KFS and Berioli DJ (2009) WebSat - A Web sotware for microSatellite marker development. Bioinformaion 3: 282-283.
Novello M, Rodrigues JF, Pinheiro F, Oliveira GCX, Veasey EA and Koehler S (2013) Simple-sequence repeat markers of Cattleya coccinea
(Orchidaceae), an endangered species of the Brazilian Atlanic Forest.
Geneics and Molecular Research12: 3274-3278.
Otero JT and Flanagan NS (2006) Orchid diversity: Beyond decepion.
Trends in Ecology and Evoluion 21: 64-65.
Pandey M, Richards M and Sharma J (2015) Microsatellite-based geneic diversity paterns in disjunct populaions of a rare orchid. Geneica 143: 693-704.
Pansarin ER and Pansarin LM (2011) Reproductive biology of
Trichocentrum pumilum: An orchid pollinated by oil-collecing bees.
Plant Biology 13: 576-581.
Peakall R and Smouse PE (2012) GenAlEx 6.5: geneic analysis in Excel. Populaion geneic sotware for teaching and research—an update.
Bioinformaics 28: 2537-2539.
Pinheiro F, Cozzolino S de BF, Gouveia, TMZM, Fay MF and Palma-Silva C (2013) Phylogeographic structure and outbreeding depression reveal early stages of reproductive isolation in the neotropical orchid Epidendrum deniculatum. Evoluion 67: 2024-2039.
Rodrigues JF, Van Den Berg C, Abreu AG, Novello M, Veasey EA, Oliveira GCX and Koehler S (2015) Species delimitaion of Catleya coccinea
and C. maniqueirae (Orchidaceae): insights from phylogeneic and populaion geneics analyses. Plant Systemaics and Evoluion 301: 1345-1359.
Rozen S and Skaletsky H (2000) Primer3 on the WWW for General Users and for Biologist Programmers. In Krawetz S and Misener S (eds) Bioinformaics methods and protocols: Methods in molecular
biology. Humana Press, Totowa, NJ, p. 365-386.
Schuelke M (2000) An economic method for the luorescent labeling of PCR fragments. Nature Biotechnology18: 233-234
Spruyt M and Buquicchio F (1994) Gene Runner. Available at <htp:// www.generunner.net/>. Accessed in Jan, 2015.
Tambarussi EV, Sebbenn AM, Moreno MA, Ferraz EM, Kageyama PY and Vencovsky R (2013) Microsatellite markers for Cariniana legalis (Lecythidaceae) and their transferability to C. estrellensis.
Applicaions in Plant Sciences1: 1200493.
Tambarussi EV, Menezes LC, Ibañes B, Aniqueira LMOR, Dequigiovanni G, Moreno MA, Ferraz EM, Zucchi MI, Veasey EA and Vencovsky R (2016) Microsatellite markers for Catleya walkeriana Gardner, an endangered tropical orchid species. Plant Geneic Resources14: 1-4. Trapnell DW, Beasley RR, Lance SL, Field AR and Jones KL (2015)
Characterizaion of microsatellite loci for an Australian epiphyic orchid, Dendrobium calamiforme, using Illumina sequencing.
Applicaions in Plant Sciences 3: 1500016.
Vencovsky R (1994) Variance of an esimaive of the outcrossing rate.