* Corresponding author: E-mail: [email protected]
Received: November 25, 2016 Approved: August 11, 2017
How to cite: Poppiel RR, Lacerda MPC, Oliveira Junior MP, Demattê JAM, Romero DJ, Sato MV, Almeida Júnior LR, Cassol LFM. Surface spectroscopy of Oxisols, Entisols and Inceptisol and relationships with selected soil properties. Rev Bras Cienc Solo. 2018;42:e0160519. https://doi.org/10.1590/18069657rbcs20160519
Copyright: This is an open-access article distributed under the terms of the Creative Commons Attribution License, which permits unrestricted use, distribution, and reproduction in any medium, provided that the original author and source are credited.
Surface Spectroscopy of Oxisols,
Entisols and Inceptisol and
Relationships with Selected
Soil Properties
Raúl Roberto Poppiel(1)*
, Marilusa Pinto Coelho Lacerda(2)
, Manuel Pereira de Oliveira Junior(1)
, José Alexandre Melo Demattê(3)
, Danilo Jefferson Romero(4)
, Marcus Vinicius Sato(4)
, Leonardo Rafael de Almeida Júnior(5)
and Luiz Felipe Moreira Cassol(5)
(1)
Universidade de Brasília, Faculdade de Agronomia e Medicina Veterinária, Departamento de Agronomia, Programa de Pós-Graduação em Agronomia, Brasília, Distrito Federal, Brasil.
(2)
Universidade de Brasília, Faculdade de Agronomia e Medicina Veterinária, Departamento de Agronomia, Brasília, Distrito Federal, Brasil.
(3)
Universidade de São Paulo, Escola Superior de Agricultura “Luiz de Queiroz”, Departamento de Ciência do Solo, Piracicaba, São Paulo, Brasil.
(4)
Universidade de São Paulo, Escola Superior de Agricultura “Luiz de Queiroz”, Departamento de Ciência do Solo, Programa de Pós-Graduação em Solos e Nutrição de Plantas, Piracicaba, São Paulo, Brasil.
(5)
Universidade de Brasília, Faculdade de Agronomia e Medicina Veterinária, Curso de Agronomia, Brasília, Distrito Federal, Brasil.
ABSTRACT: Traditional method of soil survey is expensive, slow, and must be carried out by experienced researchers. Thus, advances in soil observation technologies and the need to obtain information quickly by modern techniques have intensified the use of proximal sensing. This study characterized surface reflectance spectra (A horizon) and related them to traditional soil classification, based on morphological, physical, and chemical properties of representative pedogenetic profiles, developed in two toposequences of the Distrito Federal, Brazil. In the toposequences, 15 soil profiles were selected for a complete morphological description and sampling for laboratory analyses. Soil-landscape relationships were established, and profiles were classified to the fourth level of the Brazilian Soil Classification System (SiBCS). Classes of similar soils were grouped based on their surface spectra, resulting in spectral curves of 10 representative soils in the studied area. The Morphological Interpretation of Reflectance Spectrum (MIRS) and second derivative of the Kubelka-Munk (KM) function were applied to the soil spectra. The clustered soils were similar, mainly in terms of color, textural class, and organic matter content. Groups based on soil physical and chemical properties and on surface and subsurface colors were similar to those determined by surface reflectance. The identification of soil-landscape relationships was fundamental to understand the genesis and distribution of the soils, which had similar chemical and physical properties to their parent materials. The analysis of clusters based on soil surface reflectance proved efficient in determining groups of soil classes with similar properties. Surface reflectance data were related to the soil surface and subsurface properties determined by traditional soil sample analyses, since the two approaches formed similar groups. The simultaneous interaction of soil properties was assessed by MIRS analysis, while the second derivative of the KM function adequately quantified the mineralogy of the spectra.
Keywords: toposequences, soil-landscape relationships, soil spectroscopy, spectral morphology, Kubelka-Munk.
INTRODUCTION
Agriculture and natural resources are under severe pressure. The main causes are population growth, increased food consumption, and intensified use of agricultural land for bioenergy production (OECD/FAO, 2016). The negative impacts resulting from this evolution are numerous and can be related to the expansion (spreading of crops and pastures to new areas) and intensification (increased productivity and yield) of agriculture (Foley et al., 2011). According to the perspective of the Organization for Economic Co-operation and Development (OECD) and Food and Agriculture Organization of the United Nations (FAO) (2016), the agricultural cropland is expected to increase globally by 42 million ha in the next decade, and nearly half of this increase is estimated to occur in Brazil and Argentina.
In view of these changes, there is an urgent need to enhance the understanding of soil and identify the most appropriate for agriculture, which can only be done by mapping them in detail. However, the traditional method of soil mapping has proven to be expensive, time-consuming, and the task must be performed by experienced researchers. The technique provides detailed information on specific locations, but is limited with regard to number, volume, and spatial coverage of data (Adamchuk et al., 2017).
With the advances in observation technologies of the Earth, innovative equipment, user-friendly software, and open-source algorithms have been developed, opening new horizons for soil identification and mapping (Ben-Dor and Demattê, 2015).
Therefore, the need to obtain information rapidly by modern techniques has boosted the use of proximal sensing. The technique consists of analyzing information obtained from a soil sample without a direct contact. A soil sample is hit at light speed by electromagnetic radiation, consisting of different wavelengths. As each wavelength has a specific frequency and energy, some will have a specific affinity with soil properties. This interaction is followed by reflection, which varies between wavelengths, generating the so-called “spectral curve” or “spectral signature” of the target. Each sample is unique and has intrinsic properties represented in the resulting spectrum (Demattê et al., 2015a; Adamchuk et al., 2017).
The spectral bands commonly used for proximal sensing in soil science include visible (VIS: 350-780 nm), near-infrared (NIR: 780-1.100 nm), and short-wave infrared (SWIR: 1.100-2.500 nm) bands (Demattê et al., 2015a). Over the past 50 years, this technique proved to be quick, cheap, non-destructive, reproducible, repeatable, and environmentally friendly (Soriano-Disla et al., 2014).
Soil reflectance is a cumulative property derived from the intrinsically heterogeneous composition of soils, with regard to their mineralogical constitution, organic materials, particle distribution, and chemical composition (Demattê et al., 2012a). This composition is a result of pedogenetic factors and processes and can be represented by soil spectral curves. These signatures become references that are stored in soil spectral libraries, where they can be used for various soil studies (Nocita et al., 2015).
The determination of soil properties by means of reflectance spectroscopy techniques also detected significant correlations between the soil surface and subsurface (Mouazen et al., 2010; Stenberg et al., 2010; Nocita et al., 2015; Mohamed et al., 2017).
Soil classification can also be inferred from reflectance spectroscopy; therefore, authors such as Viscarra Rossel and Webster (2011) and Vasques et al. (2014) related reflectance spectra of all horizons of a profile with their respective classification. This procedure can rationalize processes, although soil subsurface data are required.
soils. Such inferences can be useful for digital soil mapping. Therefore, the acquisition of soil spectra and understanding of their behavior in different regions of the country for the elaboration of so-called soil spectral libraries are of interest for the national and international community in Brazil, as stated by Bellinaso et al. (2010), and recently by Viscarra Rossel et al. (2016), with a view to a global spectral library.
As the spectrum of a soil sample is a signature comprising mineralogical information, it is expected to be useful for the grouping of similar soil profiles. In this setting, this study addresses the characterization of surface reflectance spectra (A horizon) and relates them with the respective soil classification by means of morphological, physical, and chemical properties of representative pedogenetic profiles, developed in two toposequences in the Distrito Federal, Brazil.
MATERIALS AND METHODS
Study site and physical environment
Two toposequences with representative soil distribution were selected for the study in the watersheds of the Estanislau Creek and Jardim Stream, both upstream of the water basin of the Jardim River, Distrito Federal (DF), Brazil (Sirgas 2000/UTM 23S, 216,623 - 226,924 m E / 8,261,507 – 8,244,566 m N), covering an area of 10,435 ha (Figure 1).
The Jardim River basin developed on rocks of the Paranoá, Canastra, and Bambuí Groups, which account, respectively, for circa 5, 25, and 70 % of the total area (Freitas-Silva and Campos, 1998). The geomorphological compartmentalization of almost the entire basin length is dominated by intermediate plateaus, with flat to gently undulating relief, low drainage density, less than 12 % slope, and elevation from 950 to 1,050 m (Semarh, 2012).
According to the semi-detailed soil mapping (scale 1:50,000) performed by Reatto et al. (2000), the main soils in the Jardim River basin are, according to Brazilian Soil Classification System (SiBCS) (Santos et al., 2013), Latossolos, Cambissolos, Plintossolos, Gleissolos, Argissolos, and Neossolos, which corresponding to Oxisols, Inceptsols, Petroferric Haplustox, Aquents, Ultissols, and Entisols in the American Soil Taxonomy System (ST) (Soil Survey Staff, 2014). The digital soil map generated by Poppiel (2016) shows FFc (Plintossolos Pétricos Concrecionários típicos/Petroferric Haplustox) as a frequent soil class in this basin. These soils are located under residual hills with concentric distribution, occurring throughout the area. They cover major upstream areas in the studied watersheds, together with relicts of the oldest geomorphological surface of the DF, the High Plateaus (called Chapadas Elevadas) (Pinto, 1994). These residual hills represent geomorphological surfaces resulting from the evolution of the Chapadas Elevadas (Morales and Assine, 2015), and their size decreases towards the downstream region of the Jardim River basin, on the eastern border of the DF. These residual relief forms resisted erosion and pedogenesis during the soil evolution of this geomorphological surface, which is active up to the present. Pelitic metasedimentary materials of the Canastra and/or Bambuí Groups, still preserved under FFc, are often observed. The soils evolved from FFc, due to differentiated conditions of erosion and pedogenesis, under the influence of the lithology of the Canastra and Bambuí Groups and local variations in relief features. Therefore, the occurrence of FFc is extremely important for the geomorphological and pedological development in the Jardim River basin, a fact given little attention in studies dealing with pedomorphogeological relations on the Central Plateau of Brazil, e.g., Motta et al. (2002), Barbosa et al. (2009), Campos et al. (2010), and Lacerda and Barbosa (2012), among others.
Field and laboratory activities
pelitic lithologies of the Paranoá, Canastra, and Bambuí Groups, with a low metamorphic degree. The first was called Toposequence Estanislau, located in the watershed of the Estanislau Creek, between the highways DF-130 and DF-455, comprising the Rural Center of Tabatinga (Figure 1b). The second, named Alto Jardim, is located in the watershed of Jardim Stream, between the highways DF-455, DF-120, and DF-355 (Figure 1c).
Along the toposequences, 15 profiles (P) were morphologically described as proposed by Santos et al. (2015). Thirty samples were collected, of which 15 were from the A horizon and 15 from diagnostic subsurface horizons (B or C), for soil classification up to the fourth categorical level (subgroups) of the SiBCS (Santos et al., 2013) and the corresponding classification by the ST (Soil Survey Staff, 2014).
Air-dried fine earth (ADFE) fraction of sieved soil samples (<2 mm) was analyzed in the laboratory. To this end, ferruginous concretions (>2 mm) were eliminated from the surrounding soil. Physical and chemical analyses were performed according to methods Figure 1. Watersheds of the Estanislau Creek and Jardim Stream, in the major Jardim River basin, Distrito Federal (DF) (IBGE, 2011), overlaid by a geological map (a) (Freitas-Silva and Campos, 1998), indicating the location of Toposequence 1 (Estanislau) (b) and
Toposequence 2 (Alto Jardim) (c). P: profile, numbered in increasing order in relation to the position. DF
120
DatumSIRGAS 2000 Projeção UTM – Zona 23 S Datum: SIRGAS 2000 Projection: UTM Fuse: 23 South
1342 m BRASÍLIA
P1
P9
215000 220000 225000 230000 235000 240000 245000
822750
0
8234000
824050
0
824700
0
8253500
8260000
BRAZIL
Studied Watersheds Jardim River basin
DISTRITO FEDERAL
Legend
Studied soils
topossequence 1 topossequence 2 Hydrographic network Jardim River basin
Estanislau Creek Jardim Stream
Geology
Paranoá Group (5 %) MNPpq3
MNPpr4 MNPpr3
Canastra Group (25 %)
Bambuí Group (70 %) NPbT
MNPccf Watersheds
topossequence direction (a)
Cerrado Biome São Francisco River Hydrographic Basin
P1 DF 130
P6 723 m
(c)
Hydrographic network
(b)
Jardim Stream Estanislau Cr
eek
0 3 6 12
N km
Barreir a do Ma
described by Clasen (1997). Particle size composition was determined by the densimeter method (Bouyoucos, 1926). The chemical analyses determined: pH in water at a ratio of 1:2.5 v/v; potential acidity (H+Al) extracted by calcium acetate; organic matter (OM) determined by the Walkley-Black (1934) method; Ca²++Mg²+ and Al³+ extracted by KCl solution; K+
determined by flame spectrophotometry; and P2O5 assessed by extraction with Mehlich-1 (Vettori, 1969).
Spectroscopic analyses
The ADFE reflectance of surface A horizon, comprising 15 soil samples, was determined. The readings were performed in the laboratory, in a wavelength range from 350 to 2,500 nm (VIS-NIR-SWIR) using a FieldSpec® Pro sensor (Analytical Spectral Devices Inc., Boulder, CO, USA). Thereafter, the samples were placed on Petri dishes and homogenously distributed on the flat surface to perform the readings. Two halogen lights (50 W) were used as light source. The lights were installed at 90° to each other, at a distance of 0.35 m from the sample, and a zenithal angle of 30°, with a beam (uncollimated to the target). A fiber-optic cable, placed vertically at a distance of 0.08 m from the center of the sample surface, captured the energy reflected from an area of about 2 cm2. For each sample, the mean reflectance was calculated from three repetitions in different positions, decreasing the shading effect. Each repetition consisted of 100 sensor readings, to maximize the signal-to-noise ratio. The instrument was calibrated at the beginning and then every 20 min, using a Spectralon white plate (Labsphere, North Sutton, NH, USA) as reference, with over 99 % reflectance.
Grouping soil profiles from surface reflectance
Soils with similar properties were grouped, according to the similarity of surface spectra (A horizons). This was possible because the soil surface patterns are related to soil class-specific variations in the underlying horizons and throughout the soil profile. Thus, it is possible to relate surface spectral curves with soil classes, as demonstrated by Demattê et al. (2007, 2009, 2016) and Nanni et al. (2011, 2012). However, these relationships should be evaluated with caution, because in some cases, the soil surface information alone is insufficient for soil classification.
The grouping was based on the Single Linkage method (Sneath and Sokal, 1973). This grouping technique of hierarchical agglomerative clustering is based on the Euclidean distance between all observations. The similarity between spectral behaviors of samples of the soil classes is inversely related to the Euclidean distance between the groups. The mean within each group was calculated, resulting in ten spectra for qualitative assessment.
Qualitative spectral evaluation
The spectral curves of surface soils were characterized qualitatively/descriptively by the Morphological Interpretation of Reflectance Spectrum (MIRS), as proposed by Demattê et al. (2014). This methodology considers aspects of the curve such as shape, intensity, and absorption features. To complement this technique, the second derivative of Savitzky-Golay was applied to the Kubelka-Munk (KM) function (Torrent and Barrón, 2008), using The Unscrambler® software. This mathematical procedure amplifies small reflectance (positive values) or absorption features (negative values), allowing quantification of the materials (Sellitto et al., 2009).
RESULTS AND DISCUSSION
Classification of soils and physical environment
Rhodic Acrustox); P2-FFc (Plintossolo Pétrico Concrecionário típico/Petroferric Acrustox); P3-FFc (Plintossolo Pétrico Concrecionário típico/Petroferric Haplustox), developed under unit MNPccf (Chlorite Carbonate Phyllite) of the Canastra Group; P4-LVd (Latossolo
Vermelho Distrófico típico/Rhodic Acrustox); P5-LVAdc (Latossolo Vermelho-Amarelo
Distrófico petroplíntico/Petroferric Acrustox); P6-FFc (Plintossolo Pétrico Concrecionário típico/Petroferric Acrustox), originated from unit NPbT (Argillaceous Metasilite/Arkoses) of the Bambuí Group (Tables 1 and 3, Figure 2a).
The soils of the toposequence Alto Jardim (T2) were classified as: P1-FFc (Plintossolo Pétrico Concrecionário típico/Petroferric Haplustox); P2-FFc (Plintossolo Pétrico Concrecionário típico/Petroferric Haplustox); P3-FFc (Plintossolo Pétrico Concrecionário típico/Petroferric Haplustox); P4-CXbd (Cambissolo Háplico Tb Distrófico típico/Oxic Dystrustepts); P5-RRd (Neossolo Regolítico Distrófico típico/Typic Ustorthent); P6-RRd (Neossolo Regolítico
Distrófico típico/Typic Ustorthent); P7-RRd (Neossolo Regolítico Distrófico típico/Typic Ustorthent); P8-GXbd (Gleissolo Háplico Tb Distrófico típico/Typic Fluvaquents); P9-LVd (Latossolo Vermelho Distrófico típico/Rhodic Acrustox), all originated from unit NPbT (Argillaceous Metasilite/Arkoses) of the Bambuí Group (Tables 2 and 4, Figure 2b).
In the upper and middle thirds of the T1 slopes (Figure 2a), convex-shaped ramps were identified, evolving into a rectilinear ramp in the lower third, incorporated into the drainage network and without floodplain. Vertical water flow prevails across the toposequence, due to the high hydraulic conductivity of the granular and crumb structure of these soils under native vegetation (Campos et al., 2010). The high permeability of the Bw horizon of LV is due to structures and types of associated pores that prevent rapid water circulation (Cunha et al., 2008). In the Mar de Morros region (state of Minas Gerais), with similar relief features, Ippoliti et al. (2005) reported deep soils without drainage limitations. In P2 and P3 (FFc), accumulation of ferruginous concretions was observed, hampering free water infiltration into the profile, originating a wetter pedoenvironment (Motta et al., 2002). According to Barbosa et al. (2009) and Campos et al. (2010), the formation of a concretionary horizon in LVA of DF, as in P5, is related to its distribution and geomorphological evolution from the Chapadas Elevadas. In the subsurface, this horizon developed where the slope increases slightly, with occurrences of water table oscillations, thus resulting in the stabilization of goethite. Currently, near the edges of the Chapadas Elevadas, this horizon crops out in layers of petroplinthites (iron-cemented concretions), constituting the FFc of the study site.
Pedron et al. (2011) described Neossolos Regolíticos (RR) under a hilly to strongly hilly relief, with a low soil water infiltration rate, due to the higher density of the C horizon. Relief shapes play a decisive role in water dynamics in the soil profile, affecting the pedogenetic processes and consequently formation of different soils (Vidal-Torrado et al., 2005). Thus, the participation of relief features in the evolution of soils of the studied site is determinant, for influencing the amount of water infiltrated into the soil, accelerating chemical reactions of weathering, and promoting the transport of solids or materials in solution, producing effects that result in different soil types in the various positions of the toposequences (Pennock and Veldkamp, 2006).
The occurrence of LV, generally humic, highly evolved, and deep, was reported by Chaves (2016) in the top regions of the Serra da Mantiqueira, preserved in convex and mostly steep slopes (<45 %), related to the regional geomorphological and geological evolution, due to the crustal uplift that originated the mountain chains Serra da Mantiqueira and Serra do Mar, preserving the Paleo-Latossolos (Paleo-Oxisols) developed on the geomorphic surfaces Japi and Sul Americana.
As a general rule, deeper and more evolved soils generally occur on convex slopes, while shallower (saprolitics) and less evolved soils tend to occur on concave slopes
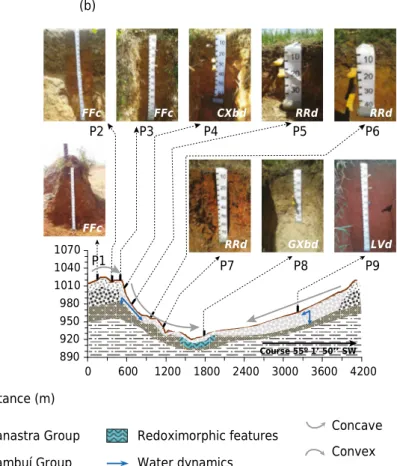
Figure 2. Topographic profile of toposequences Estanislau-T1 (a) and Alto Jardim-T2 (b), and location of the studied soil profiles (P). I: infiltration; R: runoff. T1: P1-LVd (Latossolo Vermelho Distrófico típico/Rhodic Acrustox); P2-FFc (Plintossolo Pétrico Concrecionário típico/Petroferric Acrustox); P3-FFc (Plintossolo Pétrico Concrecionário típico/Petroferric Haplustox), developed under unit MNPccf (Chlorite Carbonate Phyllite) of the Canastra Group; P4-LVd (Latossolo Vermelho Distrófico típico/Rhodic Acrustox); P5-LVAdc (Latossolo Vermelho-Amarelo Distrófico petroplíntico/Petroferric Acrustox); P6-FFc (Plintossolo Pétrico Concrecionário típico/ Petroferric Acrustox), originated from unit NPbT (Argillaceous Metasilite/Arkoses) of the Bambuí Group. T2: P1-FFc (Plintossolo Pétrico Concrecionário típico/Petroferric Haplustox); P2-FFc (Plintossolo Pétrico Concrecionário típico/Petroferric Haplustox); P3-FFc (Plintossolo Pétrico Concrecionário típico/Petroferric Haplustox); P4-CXbd (Cambissolo Háplico Tb Distrófico típico/Oxic Dystrustepts); P5-RRd (Neossolo Regolítico Distrófico típico/Typic Ustorthent); P6-RRd (Neossolo Regolítico Distrófico típico/Typic Ustorthent); P7-RRd (Neossolo Regolítico Distrófico típico/Typic Ustorthent); P8-GXbd (Gleissolo Háplico Tb Distrófico típico/Typic Fluvaquents); P9-LVd (Latossolo Vermelho Distrófico típico/Rhodic Acrustox), all originated from unit NPbT (Argillaceous Metasilite/ Arkoses) of the Bambuí Group.
890 920 950 980 1010 1040 1070
0 600 1200 1800 2400 3000 3600 4200
Distance (m)
A+B, or A horizon
Bambuí Group
Course 55º 1’ 50’’ SW P1
P2 P3 P4 P5 P6
P7 P8 P9
(a) (b)
LVd
FFc FFc LVd LVAdc FFc
FFc
FFc FFc CXbd RRd RRd
RRd GXbd LVd
Petroplinthite
Petroferric contact
Canastra Group
C horizon
Redoximorphic features
Water dynamics
Concave
Convex
Rectilinear
Altitude (m
)
P1
P2 P3 P4 P5 P6
I
Course 55º 1’ 50’’ NE
920 950 980 1010 1040 1070
0 750 1500 2250 3000 3750 4500 5250 6000
(Chagas et al., 2013). The shape (curvature) and orientation (solar radiation incidence) of slopes are important in pedogenesis, for directly affecting the air and soil temperature level, evapotranspiration and soil moisture, as well as other important soil properties (Senthilkumar et al., 2009; Camargo et al., 2010; Oliveira et al., 2013).
Morphological aspects
The morphological characterization of soils (Tables 1 and 2) differentiated each soil class, mainly in terms of color, which clearly shows the action of different pedogenetic processes among soils. The diagnostic horizon of the LVd had a reddish color, while those of LVAdc, FFc, CXbd, and RRd were yellowish. According to Schwertmann (1993) and
Table 1. Description of morphological properties of profiles in Toposequence 1 - Estanislau, Distrito Federal, Brazil
Hor.(1)
Depth Munsell Color (2)
Structure(3) Consistency (4)
Dry Moist Wet
m
P1-LVd (Latossolo Vermelho Distrófico típico/Typic RhodRhodic Acrustox)
A 0.00-0.15 2.5YR 4/4 st. vsm. cb. S. VFr. SPL. SST.
AB 0.15-0.25 2.5YR 4/6 st. vsm. gr. S. VFr. PL. ST.
BA 0.25-0.40 2.5YR 5/6 st. vsm. gr. S. VFr. PL. ST.
Bw 0.40+ 2.5YR 5/8 st. vsm. gr. S. VFr. PL. ST.
P2-FFc (Plintossolo Pétrico Concrecionário típico/Petroferric Acrustox)
Ac 0.00-0.20 7.5YR 4/4 var. 2.5YR 5/8 st. vsm. cb. S. VFr. PL. ST.
AF 0.20-0.35 7.5YR 5/4 var. 2.5YR 5/8 st. vsm. gr. S. VFr. PL. SST.
FA 0.35-0.50 7.5YR 7/8 var. 2.5YR 5/8 st. vsm. gr. S. VFr. PL. SST.
F 0.50+ 5YR 6/8 var. 2.5YR 5/6 st. vsm. gr. S. VFr. PL. SST.
P3-FFc (Plintossolo Pétrico Concrecionário típico/Petroferric Haplustox)
Ac 0.00-0.20 10YR 3/6 var. 10YR 5/6 st. vsm. cb. S. VFr. PL. ST.
F 0.20-0.60 10YR 6/8 st. vsm. gr. S. VFr. PL. ST.
C 0.60+ 10R 5/8 var. 2.5Y 7/4 wk. sm. to lg. bk. H. Fi. PL. ST.
P4-LVd (Latossolo Vermelho Distrófico típico/Rhodic Acrustox)
A 0.00-0.20 10R 4/3 st. vsm. cb. S. Fr. PL. ST.
AB 0.20-0.30 10R 4/6 st. vsm. gr. S. Fr. PL. ST.
BA 0.30-0.51 10R 4/4 st. vsm. gr. S. Fr. PL. ST.
Bw 0.51+ 10R 5/8 st. vsm. gr. S. VFr. PL. ST.
P5-LVAdc (Latossolo Vermelho-Amarelo Distrófico petroplíntico/Petroferric Acrustox)
A 0.00-0.15 10YR 3/4 st. vsm. gr. S. Fr. PL. SST.
AB 0.15-0.25 10YR 4/6 st. vsm. gr. S. Fr. PL. SST.
BA 0.25-0.35 10YR 5/6 st. vsm. gr. S. Fr. PL. SST.
Bw 0.35-0.70 10YR 6/6 st. vsm. gr. S. VFr. PL. SST.
F 0.70+ 10R 5/8 st. vsm. gr. S. Fr. PL. SST.
P6-FFc (Plintossolo Pétrico Concrecionário típico/Petroferric Acrustox)
Ac 0.00-0.25 7.5YR 4/6 st. vsm. cb. S. Fr. PL. ST.
F1 0.25-0.75 7.5YR 5/8 st. vsm. gr. S. Fr. PL. ST.
F2 0.75-1.75 10R 5/8 st. vsm. gr. S. Fr. PL. ST.
C 1.75+ 10R 6/8 var. 7.5YR 7/4 wk. vsm. bk. H. Fr. PL. ST.
Hor.= horizon; Var. = variegated. (1) Horizon suffixes: w = oxic horizon, c = concretionary horizon; master horizons: A = ochric epipedon, F = petroferric contact. (2)
Moist color. (3)
Structure: st.= strong, wk.= weak, vsm.= very small, sm.= small, lg.= large, cb.= crumb, gr.= granular, bk.= blocky. (4)
Table 2. Description of morphological properties of profiles in Toposequence 2 - Alto Jardim, Distrito Federal, Brazil
Hor.(1)
Depth Munsell Color(2)
Structure(3) Consistency (4)
Dry Moist Wet
m
P1-FFc (Plintossolo Pétrico Concrecionário típico/Petroferric Haplustox)
Ac 0.00-0.18 10YR 3/4 st. vms. gr. S. Fr. PL. ST.
AF 0.18-0.45 10YR 4/6 st. vms. gr. S. Fr. PL. ST.
F 0.45-1.20 10YR 6/8 st. vms. gr. S. Fr. PL. ST.
FC 1.20-1.60 2.5YR 5/8 st. vms. gr. S. Fr. PL. ST.
C 1.60+
2.5YR 3/6 wk. vms. bk. SH. Fi. SPL. ST.
P2-FFc (Plintossolo Pétrico Concrecionário típico/Petroferric Haplustox)
Ac 0.00-0.30 10YR 4/4 st. vms. cb. L. Fr. PL. ST.
AF 0.30-0.48 10YR 3/4 st. vms. gr. S. Fr. PL. ST.
F 0.48-1.05 10YR 4/6 st. vms. gr. S. Fr. PL. ST.
FC 1.05-1.50 5YR 5/6 var. 2.5Y 8/2 st. vms. gr. H. Fr. PL. ST.
C 1.50+ wk. vms. bk. H. Fr. PL. ST.
P3-FFc (Plintossolo Pétrico Concrecionário típico/Petroferric Haplustox)
Ac 0.00-0.20 7.5YR 3/4 st. vms. cb. S. Fr. PL. SST.
AF 0.20-0.40 7.5YR 4/6 st. vms. gr. S. Fr. PL. SST.
F 0.40-0.96 7.5YR 4/4 st. vms. gr. S. Fr. PL. ST.
FC 0.96+
2.5YR 6/6 wk. vms. bk. H. Fi. PL. ST.
P4-CXbd (Cambissolo Háplico Tb Distrófico típico/Oxic Dystrustepts)
A 0.00-0.10 7.5YR 4/6 wk. vms. bk. H. Fi. PL. ST.
Bi 0.10-0.20 7.5YR 5/6 wk. vms. bk. H. Fi. PL. ST.
BC 0.20-0.25 5YR 5/6 var. 2.5YR 4/8 wk. vms. bk. H. Fi. PL. ST.
C 0.25+
2.5YR 6/4 wk. vms. bk. VH. Fi. PL. ST.
P5-RRd (Neossolo Regolítico Distrófico típico/Typic Ustorthent)
A 0.00-0.08 10YR 5/4 wk. sm. bk. H. Fi. PL. ST.
AC 0.08-0.14 10YR 5/3 wk. sm. bk. H. Fi. PL. ST.
C 0.14+
10R 3/6 var. 7.5YR 8/0 wk. sm. bk. VH. Fi. PL. ST.
P6-RRd (Neossolo Regolítico Distrófico típico/Typic Ustorthent)
A 0.00-0.10 10YR 5/4 st. sm. bk. H. Fi. PL. ST.
AC 0.10-0.22 10YR 5/6 st. sm. bk. H. Fi. PL. ST.
C 0.22+
2.5YR 3/6 var. 2.5Y 7/2 wk. sm. bk.
P7-RRd (Neossolo Regolítico Distrófico típico/Typic Ustorthent)
A 0.00-0.3 5YR 5/5 mo. sm. bk. H. Fi. PL. ST.
C 0.3-0.70+
10R 4/8 wk. sm. bk. H. Fi. PL. ST.
P8-GXbd (Gleissolo Háplico Tb Distrófico típico/Typic Fluvaquents)
A 0.00-0.33 10YR 5/2 wk. sm. bk. VH. Fi. PL. ST.
ACg 0.33-0.40 10YR 6/2 var. 5YR 6/8 wk. sm. bk. VH. Fi. PL. ST.
Cg 0.40-0.70+
10YR 7/2 var. 5YR 6/8 ma. VH. Fi. PL. ST.
P9-LVd (Latossolo Vermelho Distrófico típico/Rhodic Acrustox)
A 0.00-0.20 10R 3/6 st. vms. cb. SH. Fr. PL. ST.
ABw 0.20-0.35 10R 4/6 st. vms. cb. SH. Fr. PL. ST.
BAw 0.35-0.55 10R 4/8 st. vms. gr. SH. Fr. PL. ST.
Bw 0.55+
10R 5/8 st. vms. gr. S. VFr. PL. ST.
Hor.= horizon; Var. = variegated. (1) Horizon suffixes: w = oxic horizon, c = concretionary horizon, I = cambic horizon, g = redoximorphic features; master horizons: A = ochric epipedon, F = petroferric contact. (2)
Moist color. (3)
Gomes et al. (2004), reddish colors are due to higher hematite contents (good drainage conditions), while yellowish colors indicate the dominance of goethite over hematite (wetter pedoenvironment). These colors varied with depth, and were darker at the soil surface because of the influence of OM (Schulze et al., 1993) and redder in the C horizon, due to Fe2O3-rich pelitic parent material (Freitas-Silva and Campos, 1998). The grayish color of GXbd is mainly due to the presence of Fe in reduced form (Fe2+), indicating a hydromorphic environment (Ribeiro et al., 2012).
In the SiBCS (Santos et al., 2013), color (Munsell Color Chart) is used as an important property of soil classification, from which information about the soil can be inferred. Color variations may be a response to alterations in relief, vegetation, depth, weather, aeration, parent material, weathering degree, mineralogy, and OM content (Schulze et al., 1993; Schwertmann, 1993), linked to the origin of these soils (Lacerda et al., 2008).
In all profiles, the surface diagnostic horizon was moderate (ochric), except for T2P7-RRd, a young soil with lowest thickness (0.03 m) of the A horizon (weak). The LVd and LVAdc were classified as Latossolos (highly weathered Oxisols, mostly classified as Ustox in the ST) due to the presence of a latossólico (oxic) diagnostic B horizon and the observed dominant color (hue 2.5YR or redder for LV and 10YR for LVA). In the FFc, ferruginous concretions were observed in horizons Ac, ABc, and BAc, indicating a concretionary horizon (petroferric contact) in the diagnostic position (F) with variegated color (from 10YR to 10R). They were classified as typical, since no other differentiating property was observed.
The RRd soils contained an A horizon overlying the C horizon and had a maximum depth of 0.22 m, without no other diagnostic horizon. The CXbd had an incipient (cambic) diagnostic B horizon with a depth of 0.25 m and hue 7.5YR. In turn, GXbd had a thick surface A horizon (0.33 m) and transitional gleyed horizon (ACg), overlying the greyish gleyed Cg in diagnostic position. The redoximorphic environment of this horizon is influenced by the high water table or slowly permeable layer in the profile (Santos et al., 2013). In the LVd, LVAdc, and FFc, strong, very small granular and crumb aggregates prevail in the surface and subsurface horizons. A granular aggregate structure is favored by the presence of Al and Fe oxides, typical of these soil classes in the Cerrado region (tropical savanna on the Central Brazilian Plateau) (Gomes et al., 2004). In turn, the occurrence of LVAdc and FFc is related to a wetter pedoenvironment, due to the proximity of petroferric material from the plateau edges or to groundwater level fluctuations. These conditions are more conducive to the formation of goethite than of hematite, and of plinthite in the subsurface, precursor of ferruginous concretions (Motta et al., 2002). In young soils, such as RRd, CXbd, and GXbd, the structure is variable, with predominance of weak small aggregates in subangular blocks.
Physical and chemical properties
Clay content ranged between 402 and 792 g kg-1 (Tables 3 and 4) because of the parent material, pre-weathered during genesis (Freitas-Silva and Campos, 1998). The soil textural class ranged from very clayey to clayey and silty clay (Santos et al., 2015). No texture gradients that characterized a textural (argillic) B horizon in soils were observed.
The highest silt content of P3 was recorded in T1 (Table 3), possibly due to the lower thickness of the F horizon (0.20-0.60 m), influenced by the C horizon, which still preserves features of the Canastra Group (Freitas-Silva and Campos, 1998). The shallow depth of this soil, along with the slope of the local relief, contributed to reduce water infiltration into the profile. Therefore, the volume of available soil and the water level mitigated soil weathering by slowing down pedogenetic processes (Kämpf and Curi, 2012).
exceeded 0.6, indicating a lower evolution degree of these soils. Similar physical properties were described by Barbosa et al. (2009) and Pereira et al. (2010) for soils evolved from pelitic lithology on the Brazilian Central Plateau.
Regarding the chemical composition (Tables 3 and 4), the soils were considered acidic to highly acidic (Santos et al., 2013). The sum of bases (S), cation exchange capacity (CEC), and base saturation (V%) were very low, featuring dystrophic soils. The contents of OM (organic matter) and OC (organic carbon) were high in most soils, as they occurred in areas of native vegetation, confirming observations of Barbosa et al. (2009), Campos et al. (2010), and Lacerda and Barbosa (2012).
Grouping soils based on surface spectra
Cluster analysis, based on the Euclidean distance (Figure 3a) and linkage at each step of the algorithm (Figure 3b), applied to the reflectance data VIS-NIR-SWIR (Figure 3c), allowed the distribution of 15 profiles in 10 groups, representing the soils of the study site. The clustering criterion using linkage distances was based on the identification of a plateau in the vertical direction, relatively large compared to the others (Figure 3b).
The dendrogram obtained from surface spectral data (Figure 3a) shows the formation of 10 groups constituted by similarities between soils of various classes (Table 5), e.g., of wet color (Munsell), textural class, and OM content. Spectral data from 350 to 2,500 nm provide a reliable measure of soil properties, which can be used in qualitative and quantitative soil analyses (Viscarra Rossel et al., 2016).
Table 3. Physical and chemical properties of profiles of Toposequence 1 - Estanislau, Distrito Federal, Brazil
Hor. Clay Silt Sand Textural
class B/A Si/Cl pH(H2O) SB t T Ta V m OM OC
g kg-1
cmolc dm
-3
% g kg-1
P1-LVd (Latossolo Vermelho Distrófico típico/Typic Rhodustox)
A 792 87 121 vcly. 0.1 5.0 1.0 1.4 7.9 9.9 13.0 29.0 27.0 16.0
Bw 785 107 108 vcly. 1.0 0.1 5.3 0.4 0.5 2.4 3.1 17.0 20.0 11.0 7.0
P2-FFc (Plintossolo Pétrico Concrecionário típico/Petroferric Haplustox)
Ac 605 130 265 vcly. 0.2 4.8 1.9 3.0 11.1 18.3 17.0 37.0 34.0 19.0
F 675 65 260 vcly. 1.1 0.1 5.4 0.7 0.8 4.5 6.6 16.0 12.0 20.0 12.0
P3-FFc (Plintossolo Pétrico Concrecionário típico/Petroferric Haplustox)
Ac 607 213 180 vcly. 0.4 5.2 1.5 2.5 9.1 14.9 16.0 40.0 29.0 16.0
F 587 246 167 cly. 1.0 0.4 4.7 0.8 1.0 4.6 7.8 17.0 20.0 20.0 12.0
P4-LVd (Latossolo Vermelho Distrófico típico/Typic Rhodustox)
A 755 74 171 vcly. 0.1 5.1 1.4 2.1 9.8 13.0 14.0 33.0 36.0 21.0
Bw 773 91 136 vcly. 1.0 0.1 4.9 0.5 0.6 3.8 4.9 13.0 17.0 20.0 11.0
P5-LVAdc (Latossolo Vermelho-Amarelo Distrófico petroplíntico/Plinthic Haplustox)
A 692 133 175 vcly. 0.2 5.1 1.7 2.1 9.1 13.2 19.0 19.0 31.0 18.0
Bw 725 90 185 vcly. 1.1 0.1 5.4 0.5 0.6 2.6 3.6 19.0 17.0 17.0 10.0
P6-FFc (Plintossolo Pétrico Concrecionário típico/Petroferric Haplustox)
Ac 623 89 289 vcly. 0.1 5.0 1.3 1.7 8.1 13.0 16.0 24.0 28.0 16.0
F1 702 89 209 vcly. 1.1 0.1 5.1 0.7 0.8 3.2 4.5 22.0 12.0 17.0 10.0
Hor. = horizon. Clay, silt, and sand determined by densimeter method. Textural soil class according to Santos et al. (2015): cly.= clayey, vcly.= very clayey. B/A = B horizon/A horizon relationship; Si/Cl = silt/clay ratio. pH(H2O): pH in water-saturated soil paste at a ratio of 1:2.5 v/v; K+ (Mehlich 1); Ca2+
, Mg2+
, and Al3+
(KCl 1 mol L-1
); H+Al (Calcium acetate 0.5 mol L-1
- pH 7.0). SB = sum of bases (Ca2+ +Mg2+
+K+); t = effective CEC = SB+Al3+ ; T = Cation exchange capacity (SB+H+
+Al3+
); Ta = T clay activity = (T × 1000/clay content); V = base saturation (100 × S/T); m = aluminum saturation (Al3+
The groups obtained from physical and chemical data of the soil surface and subsurface (Figure 4a) differed slightly from those based on surface reflectance data (Figure 3a). This discrepancy was possibly due to information related to soil mineralogy, which was not included in this analysis. Therefore, the dendrogram grouped basically profiles with similar texture and OM contents.
In the clustering based on surface and subsurface soil color (Figure 3b), the groups were very similar to those based on surface reflectance. The reason is that color is a result of the visible light interaction (350-780 nm) with the different soil properties, carrying this information (Schulze et al., 1993; Schwertmann, 1993). This agrees with the spectroscopic data, which include wavelengths of NIR and SWIR, in addition to VIS, and are strongly related with various soil data, including soil mineralogy (Demattê et al., 2004; Brown et al., 2006; Viscarra Rossel et al., 2009; Soriano-Disla et al., 2014). It is noteworthy that the surface reflectance data were related to the soil surface and subsurface properties determined by traditional analyses of soil samples, since the two approaches formed similar groups. Table 4. Physical and chemical properties of profiles of Toposequence 2 - Alto Jardim, Distrito Federal, Brazil
Hor. Clay Silt Sand Textural
class(1) B/A Si/Cl pH(H2O) S t T Ta V m OM OC
g kg-1
cmolc dm-3 % g kg-1
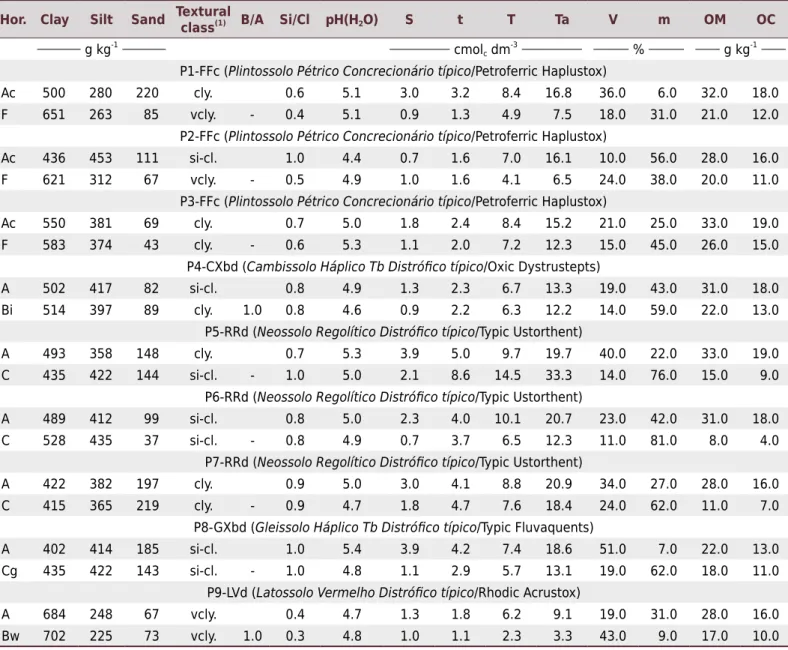
P1-FFc (Plintossolo Pétrico Concrecionário típico/Petroferric Haplustox)
Ac 500 280 220 cly. 0.6 5.1 3.0 3.2 8.4 16.8 36.0 6.0 32.0 18.0
F 651 263 85 vcly. - 0.4 5.1 0.9 1.3 4.9 7.5 18.0 31.0 21.0 12.0
P2-FFc (Plintossolo Pétrico Concrecionário típico/Petroferric Haplustox)
Ac 436 453 111 si-cl. 1.0 4.4 0.7 1.6 7.0 16.1 10.0 56.0 28.0 16.0
F 621 312 67 vcly. - 0.5 4.9 1.0 1.6 4.1 6.5 24.0 38.0 20.0 11.0
P3-FFc (Plintossolo Pétrico Concrecionário típico/Petroferric Haplustox)
Ac 550 381 69 cly. 0.7 5.0 1.8 2.4 8.4 15.2 21.0 25.0 33.0 19.0
F 583 374 43 cly. - 0.6 5.3 1.1 2.0 7.2 12.3 15.0 45.0 26.0 15.0
P4-CXbd (Cambissolo Háplico Tb Distrófico típico/Oxic Dystrustepts)
A 502 417 82 si-cl. 0.8 4.9 1.3 2.3 6.7 13.3 19.0 43.0 31.0 18.0
Bi 514 397 89 cly. 1.0 0.8 4.6 0.9 2.2 6.3 12.2 14.0 59.0 22.0 13.0
P5-RRd (Neossolo Regolítico Distrófico típico/Typic Ustorthent)
A 493 358 148 cly. 0.7 5.3 3.9 5.0 9.7 19.7 40.0 22.0 33.0 19.0
C 435 422 144 si-cl. - 1.0 5.0 2.1 8.6 14.5 33.3 14.0 76.0 15.0 9.0
P6-RRd (Neossolo Regolítico Distrófico típico/Typic Ustorthent)
A 489 412 99 si-cl. 0.8 5.0 2.3 4.0 10.1 20.7 23.0 42.0 31.0 18.0
C 528 435 37 si-cl. - 0.8 4.9 0.7 3.7 6.5 12.3 11.0 81.0 8.0 4.0
P7-RRd (Neossolo Regolítico Distrófico típico/Typic Ustorthent)
A 422 382 197 cly. 0.9 5.0 3.0 4.1 8.8 20.9 34.0 27.0 28.0 16.0
C 415 365 219 cly. - 0.9 4.7 1.8 4.7 7.6 18.4 24.0 62.0 11.0 7.0
P8-GXbd (Gleissolo Háplico Tb Distrófico típico/Typic Fluvaquents)
A 402 414 185 si-cl. 1.0 5.4 3.9 4.2 7.4 18.6 51.0 7.0 22.0 13.0
Cg 435 422 143 si-cl. - 1.0 4.8 1.1 2.9 5.7 13.1 19.0 62.0 18.0 11.0
P9-LVd (Latossolo Vermelho Distrófico típico/Rhodic Acrustox)
A 684 248 67 vcly. 0.4 4.7 1.3 1.8 6.2 9.1 19.0 31.0 28.0 16.0
Bw 702 225 73 vcly. 1.0 0.3 4.8 1.0 1.1 2.3 3.3 43.0 9.0 17.0 10.0
Hor. = horizon. Clay, silt, and sand determined by densimeter method. Textural soil class according to Santos et al. (2015): cly.= clayey, vcly.= very clayey. B/A = B horizon/A horizon relationship; Si/Cl = silt/clay ratio. pH(H2O): pH in water-saturated soil paste at a ratio of 1:2.5 v/v; K
+
According to Zeng et al. (2016), the use of spectroscopic data of the soil surface horizons can achieve an accuracy of more than 75 % in individual soil classification. This agrees with Xie et al. (2015), in which five soil classes were discriminated by surface reflectance Figure 3. Dendrogram of cluster analysis (a) and linkage distance chart indicating the distance of dendrogram cut-offs for the definition of groups (b), based on soil surface spectra (c).
350 850 1350 1850 2350
0 0.1 0.2 0.3 0.4 0.5 0.6
350 850 1350 1850 2350
0 0.1 0.2 0.3 0.4 0.5 0.6 0 2 4 6 8 10 12 14 Step -2 0 2 4 6 8 10 12 Link age Distance 0 2 4 6 8 10 12 Euclidean Distance T2-P8 T2-P4 T2-P7 T2-P6 T2-P5 T1-P2 T1-P3 T2-P3 T1-P6 T2-P2 T2-P1 T1-P5 T1-P4 T1-P1 T2-P9 LV-I LV-II LVA FF-III FF-II FF-I RR-I RR-II CX GX Wavelength (nm) Reflectance Factor
LV - I
LV - II
RR -I RR -II FF-I FF-II FF-III LVA GX CX (a) (b) (c) Surface spectra
Table 5. Main soil properties grouped by surface reflectance
Soil Group(1)
Munsell Color (moist soil) Textural Class(2)
OM
g kg-1
LV (Latossolos Vermelhos/Rhodic Acrustox)
LV-I 10R 3/6 Very clayey 28
LV-II 10R 4/3 Very clayey 31.5
LVA (Latossolos Vermelho-Amarelos/Petroferric Acrustox)
LVA 10YR 3/4 Very clayey 31
FF (Plintossolos Pétricos/Petroferric Ustox)
FF-I 10YR 3/6 Clayey 29
FF-II 10YR 3/4 Clayey 31
FF-III 7.5YR 4/4 Very clayey 34
RR (NeossoloS Regolíticos/Typic Ustorthent)
RR-I 10YR 5/4 Silty clay 32
RR-II 5YR 5/5 Clayey 28
CX (Cambissolo Háplico/Oxic Dystrustepts)
CX 7.5YR 4/6 Clayey 31
GX (Gleissolo Háplico/Typic Fluvaquents)
GX 10YR 5/2 Silty clayey 22
(1)
Clustered soils with similar properties based on surface reflectance. (2)
with 92.2 % accuracy. According to Nanni et al. (2012), using spectral information of the soil surface as indicators, soil classes were discriminated with an overall accuracy between 52 and 70 %.
Interpretation of surface spectra
The spectra obtained from the cluster analysis (Figures 5 to 10) presented spectral features of Fe oxides such as goethite (480 and 950 nm) and hematite (530 and 850 nm) (Sherman and Waite, 1985), kaolinite (1,400 and 2,205 nm), gibbsite (2,265 nm) (Madeira et al., 1995), 2:1 clay minerals, and water adsorbed on the particle surface (1,400 and 1,900 nm) (Ben-Dor et al., 2008; Stenberg et al., 2010).
In the visible (VIS) range, the second derivative of the KM function (Figures 5 to 10) showed reflectance peaks (positive values) for goethite (450 nm) and hematite (580 nm), as well as absorption feature (negative values) at 480 nm (goethite) and 530 nm (hematite) Figure 4. Dendrograms of the cluster analysis based on surface and subsurface data: physical
and chemical properties (a) and soil color (b). T: toposequence; P: profile. *
Groups obtained from
surface reflectance data (Figure 3a).
0 200 400 600 800 1000 1200
Euclidean distance
T2-P8 T1-P2 T1-P6 T2-P3 T2-P2 T2-P1 T1-P3 T2-P4 T2-P5 T2-P7 T2-P6 T1-P5 T1-P4 T1-P1 T2-P9
0 2 4 6 8 10 12
Euclidean Distance
T2-P8 T2-P4 T2-P7 T2-P5 T2-P6 T1-P2 T1-P6 T2-P3 T2-P2 T2-P1 T1-P3 T1-P5 T1-P4 T1-P1 T2-P9
LV-I*
LV-II
LVA
FF-III FF-II FF-I
RR-I
RR-II CX GX
Soil color LV-I*
LV-II
LVA
FF-III FF-II RR-I
FF-I RR-II
CX
GX RR-I
Physical and chemical properties
(Sellitto et al., 2009). In mixtures of goethite and hematite, the bands overlap, resulting in a peak located between the two minerals, at 510 nm (Fernandes et al., 2004). The shift depends on the proportion of these minerals in the spectrum and intensity of absorption bands. In the short-wavelength infrared (SWIR) region, kaolinite appeared as an absorption feature centered at 2,205 nm and gibbsite at 2,265 nm, separated by a maximum reflectance peak (Rmax) at ± 2,230 nm (Madeira et al., 1995).
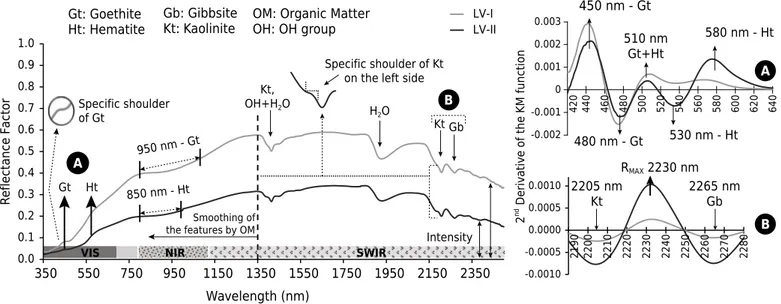
The maximum reflectance factor (RF) of the Latossolo Vermelho (LV) spectra ranged from 0.3 to 0.6, with an almost flat shape throughout the range from 350 to 2,500 nm (Figure 5). Highest values in the LV-I spectrum were recorded where the derived curve indicated a higher proportion of goethite (450 nm) than of hematite (580 nm) (Figure 5a), confirmed by the red color with a lighter tone, with hue 10R, value 3, and Chroma 6 (Table 5). The LV-II spectrum, with lower RF, had a more balanced goethite/hematite ratio in the derived spectrum (Figure 5a), represented by dark-red colors, with hue 10R, value 4, and Chroma 3. This difference in RF can be influenced by the different contents, proportions, and crystallinity degrees of Fe oxides, since the OM texture and content varied little in LVs (Table 5). In an analysis of iron oxides, Fernandes et al. (2004) found that in goethitic soils, the reduction of hematite content increased RF in the spectra. Even in soils with high proportion of goethite, Correa et al. (2008) reported red soil color. According to Schwertmann (1993), goethite is stable under various environmental conditions, tending to be dominant even in reddish soils, but always masked by the pigmenting effect of hematite.
Although OM varied little between the LV, its presence caused a reduction of RF within the range of 350 to 2,500 nm and mitigation of the absorption features from 350 to 1,350 nm (Viscarra Rossel et al., 2016) in the spectrum of LV-II (Figure 4) with 31.5 g kg-1 of OM (Table 5).
The LV spectra presented absorption features of goethite (between 480 and 950 nm) and hematite (between 530 and 850 nm) (Figure 5). The first hematite feature is wider and the second narrower than the goethite feature. The presence of these Fe minerals in the LV can be associated to the parent material, containing ferruginous cement with different Fe2O3 levels (Freitas-Silva and Campos, 1998).
Features of kaolinite (1,400 and 2,205 nm) and gibbsite (2,265 nm) are clearly observable (Figure 5), of which the first has an adsorption “shoulder” or “step” on the
0.0 0.1 0.2 0.3 0.4 0.5 0.6 0.7 0.8 0.9 1.0
350 550 750 950 1150 1350 1550 1750 1950 2150 2350
Re flectance Fa ctor Wavelength (nm) LV-I LV-II Gt Ht Kt,
OH+H2O H 2O
Kt Gb
Smoothing of the features by OM
Specific shoulder of Kt on the left side
-0.002 -0.001 0 0.001 0.002 0.003 42 0 44 0 46 0 48 0 50 0 52 0 54 0 56 0 58 0 60 0 62 0 64 0 -0.0010 -0.0005 0.0000 0.0005 0.0010 21 90 22 00 22 10 22 20 22 30 22 40 22 50 22 60 22 70 22 80
450 nm - Gt
580 nm - Ht
2205 nm Kt
2265 nm Gb
Intensity
RMAX 2230 nm A B A B Specific shoulder of Gt 510 nm Gt+Ht
480 nm - Gt 530 nm - Ht
VIS NIR SWIR
2
nd Deri
va
ti
ve
of the
KM function
950 nm - Gt
850 nm - Ht
Gt: Goethite Ht: Hematite
Gb: Gibbsite Kt: Kaolinite
OM: Organic Matter OH: OH group
left (Demattê et al., 2015b). The derived curve shows that these minerals have balanced proportions in both spectra, LV-I and LV-II (Figure 5). In soil genesis, kaolinite and gibbsite are related with hot and humid climate, high rainfall rates, and free drainage. Therefore, kaolinite is formed when desilication is moderate, while gibbsite occurs under conditions of total desilication. The latter is more abundant and common in the highly evolved Latossolos (Oxisols), developed by latolização (intense loss of basis, silica, and residual concentration of aluminum and iron oxides) (Kämpf et al., 2012). Features at 1,400 and 1,900 nm (Figure 5) are derived from vibrations of H-O-H groups of water adsorbed on the surface of minerals. At 1,400 nm, simultaneous vibrations of the O-H structural groups of clay occur (Stenberg et al., 2010). Thus, the morphology of the reflectance spectra of the studied LV (Figure 5) is similar to that of LV described by Bellinaso et al. (2010) and Demattê et al. (2014).
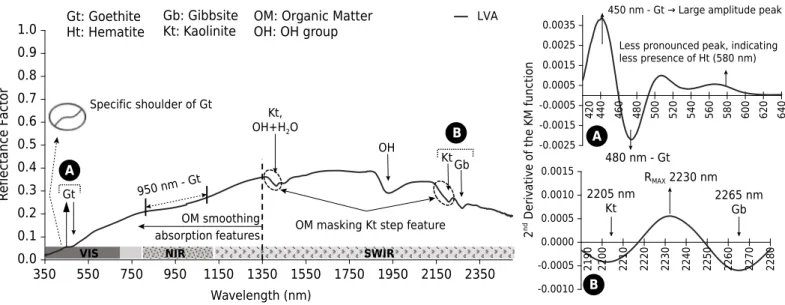
For the Latossolo Vermelho-Amarelo (LVA), the maximum reflectance factor (RF) was 0.40, with a flattened spectrum shape throughout the 350 to 2,500 nm range (Figure 6). The derived curve showed a higher goethite (450 nm) than hematite content, which had a lower peak amplitude (530 nm) (Figure 6a). Considering the effect of lower hematite contents in goethitic soils on increased reflectance (Fernandes et al., 2004), the smaller RF for LVA than for LV-I (RF 0.6) may be attributed to the higher OM content (Table 5), which caused an intensity decline throughout the entire spectrum (Viscarra Rossel et al., 2016). This effect demonstrates the complexity of the spectral analysis due to the simultaneous interaction of soil properties. Results of clay quantification based on reflectance spectroscopy can be substantially improved if OM is removed from the soil samples (Demattê et al., 2015b). However, from a practical standpoint, this procedure is infeasible.
Goethite was easily identified in the LVA spectrum, represented by an absorption feature of a range between 400 and 500 nm and an enlarged feature, centered at 950 nm (Figure 6). The derived spectrum shows a reflectance peak (450 nm) of large amplitude and an absorption feature at 480 nm (Figure 6a). Hematite was identified by a low-amplitude reflectance peak (580 nm) (Figure 6a). The dominant presence of goethite in the LVA is due to the greater stability of this mineral under deficient internal drainage conditions in the profiles of these soils, subjected to wetting and drying cycles during pedogenesis, which originated the concretionary or litoplíntico horizons in LVA (Motta et al., 2002; Barbosa et al., 2009).
Figure 6. Soil spectrum and diagram of the second derivative of Kubelka-Munk of the studied Latossolo Vermelho-Amarelo (LVA), representative of the LVA of watersheds of the Estanislau Creek and Jardim Stream, Distrito Federal, Brazil. A and B are derived curve regions.
VIS NIR SWIR
0.0 0.1 0.2 0.3 0.4 0.5 0.6 0.7 0.8 0.9 1.0
350 550 750 950 1150 1350 1550 1750 1950 2150 2350
Re
flectance
Fa
ctor
Wavelength (nm) Gt
OH
Kt Gb
OM masking Kt step feature
-0.0025 -0.0015 -0.0005 0.0005 0.0015 0.0025 0.0035
420 440 460 480 500 520 540 560 580 600 620 640
-0.0010 -0.0005 0.0000 0.0005 0.0010 0.0015
2190 2200 2210 2220 2230 2240 2250 2260 2270 2280
450 nm - Gt → Large amplitude peak
Less pronounced peak, indicating less presence of Ht (580 nm)
2205 nm Kt
2265 nm Gb OM smoothing
absorption features
A
B A
B
Specific shoulder of Gt
950 nm - G t
Kt, OH+H2O
480 nm - Gt RMAX 2230 nm
2
nd Deri
va
ti
ve
of the
KM function
LVA
Gt: Goethite Ht: Hematite
Gb: Gibbsite Kt: Kaolinite
The range of the kaolinite features (1,400 and 2,205 nm) was masked by OM, separated from the gibbsite feature (2,265 nm) by a Rmax peak (2,230 nm). Hydroxyl groups were observed at 1,400 and 1,900 nm. The presence of gibbsite in the soil indicates a high weathering degree (Kämpf et al., 2012). Again, the spectral behavior of LVA described above is similar to that of LVA characterized by Bellinaso et al. (2010).
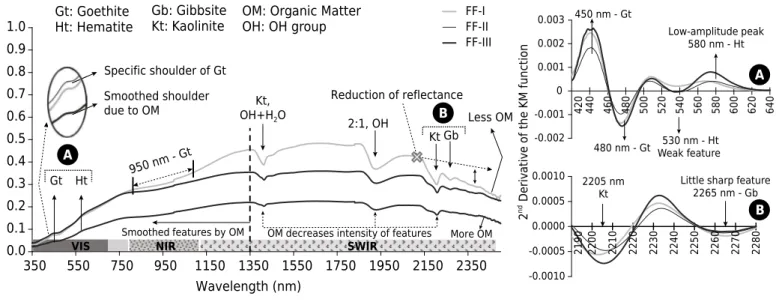
In the Plintossolo Pétrico (FF) soil spectra, the maximum reflectance factor (RF) ranged from 0.2 to 0.5 (Figure 7), influenced mainly by the OM effect. The intensity was highest in FF-I, with the lowest OM content (29 g kg-1). For having the highest OM content (34 g kg-1), FF-III had the lowest RF (Table 5). High OM contents in surface horizons caused a reduction in RF and smoothing of the features throughout the spectral range from 350 to 2,500 nm (Dalmolin et al., 2005), as evidenced in the spectrum of the FF-III (Figure 7). The high OM content of FFc was related to higher moisture levels in the profiles, because of the impediment to free water percolation through petroplinthites and the formation of concretionary horizons in these soils, as stated by Barbosa et al. (2009) and Campos et al. (2010).
The range of absorption features corresponding to goethite (400 to 500 nm) in the FF spectra (Figure 7) was softened by the OM effect in the FF-III spectrum. The derived curves (Figure 7a) indicated higher goethite contents by a reflectance peak of major amplitude (450 nm) than of hematite (580 nm). The broadest goethite feature was observed in the FF-I spectrum, centered at 950 nm, attenuated by the OM effect in the other two spectra. According to Moreira and Oliveira (2008), segregation of Fe oxides (hematite and goethite) in the form of nodules or concretions was observed in the FFc, according to Barbosa et al. (2009), resulting from a moister pedoenvironment due to the concretionary horizon. Consequently, hematite hydration occurs and its transformation into goethite, as described by Motta et al. (2002). The predominance of goethite associated with high OM contents induces dark brown soil colors, with hues ranging from 7.5YR to 10 YR, in agreement with studies of Fernandez and Schulze (1992) and Madeira et al. (1997) on soil color.
The FF also presented absorption features of kaolinite (1,400 and 2,205 nm), of hydroxyl groups (1,400 and 1,900 nm) and 2:1 clay minerals (1,900 nm), with low expression of gibbsite at 2,265 nm. Barbosa et al. (2009) verified the presence of illite (2:1 clay mineral) in the clay fraction of concretionary horizons of LVA from DF, along with kaolinite (1:1 clay
VIS NIR SWIR
0.0 0.1 0.2 0.3 0.4 0.5 0.6 0.7 0.8 0.9 1.0
350 550 750 950 1150 1350 1550 1750 1950 2150 2350
Reflectance Factor
Wavelength (nm)
2:1, OH
Kt Gb
More OM
Less OM
OM decreases intensity of features
-0.002 -0.001 0 0.001 0.002 0.003
420 440 460 480 500 520 540 560 580 600 620 640
-0.0010 -0.0005 0.0000 0.0005 0.0010
2190 2200 2210 2220 2230 2240 2250 2260 2270 2280
2205 nm Kt
Little sharp feature 2265 nm - Gb
Smoothed features by OM
Reduction of reflectance
B
A
B
Gt Ht
A
Specific shoulder of Gt
Smoothed shoulder due to OM
450 nm - Gt
Low-amplitude peak 580 nm - Ht
480 nm - Gt Weak feature 530 nm - Ht
Kt, OH+H2O
2
nd Deri
va
ti
ve
of the
KM function
950 nm - Gt
FF-I FF-II FF-III
Gt: Goethite Ht: Hematite
Gb: Gibbsite Kt: Kaolinite
OM: Organic Matter OH: OH group
mineral) and traces of gibbsite, demonstrating the lower degree of pedogenetic evolution than in LV. Despite the tropical environment, alternating conditions of heavy rainfalls and prolonged drought periods in the DF favor the preservation of clay minerals with greater activity in soils with internal drainage restrictions, as in FF (Anjos et al., 2007). In general, the spectral curves of FF are quite similar to those described by Demattê et al. (2012b).
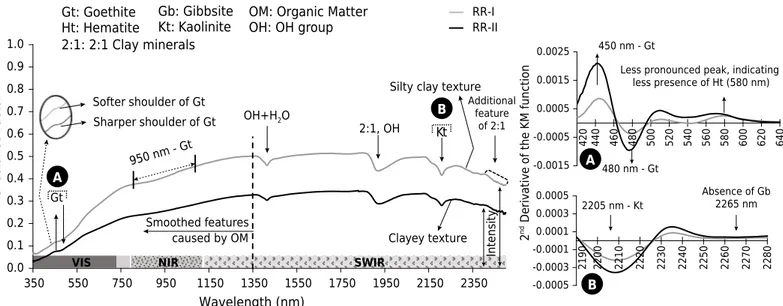
For Neossolos Regolíticos (RR), the RF ranged from 0.35 to 0.50; RR-I was represented by a spectrum with greater intensity of RF, indicating silty-clay texture, and RR-II by a spectrum with less intensity, indicating a clayey texture (Figure 7).
The RR are soils with low evolution degrees and little action of pedogenetic processes, without significant modifications of the parent material (Santos et al., 2013). For this reason, the two RR spectra had lower Fe oxide contents than more evolved soils, such as Latossolos. In the derived spectrum (Figure 8a), a lower proportion of hematite (small amplitude peak at 580 nm) was observed in relation to goethite (450 nm), due to the initial pedogenetic process. The magnitude of this feature indicates a higher goethite content in the RR-II than the RR-I spectrum. The effect of the low hematite content in the presence of goethite induced yellowish colors in these soils, with hues of 10YR to 5YR (Table 5) (Fernandes et al., 2004).
The high OM content in the surface horizon of RR smoothed the spectral features of these soils within the range 350 to 1,350 nm (Figure 8). Kaolinite was detected by the spectral feature at 2,205 nm. Absence of gibbsite was identified, by the missing absorption feature at 2,265 nm, confirming the lower weathering degree of these soils (Figure 8b) (Santos et al., 2013). Adsorption features of hydroxyl groups (1,400 and 1,900 nm) and 2:1 clay minerals (1,900 nm) were observed (Figure 8), due to the occurrence of sparse illite in these soils, as described by Barbosa et al. (2009), Campos et al. (2010), and Lacerda and Barbosa (2012). Some of these 2:1 clay minerals have additional absorption features centered at approximately 2,450 nm (Grove et al., 1992). Similar features of these clay minerals at 2,355 and 2,448 nm were also observed by Demattê and Terra (2014). Moreover, Grove et al. (1992) showed that the presence of 2:1 minerals contribute to a greater intensity of the RF of soil. Therefore, both the silt content and presence of 2:1 clay minerals may have caused a difference in the albedo of the spectra (Figure 8). The presence of weatherable minerals in the silt and sand fraction probably influenced the soil spectral reflectance. In the RR-I spectrum, higher quartz contents in the sand fraction may have influenced the increase in albedo (Hunt and Salisbury, 1970) (Figure 8).
VIS NIR SWIR
0.0 0.1 0.2 0.3 0.4 0.5 0.6 0.7 0.8 0.9 1.0
350 550 750 950 1150 1350 1550 1750 1950 2150 2350
Re
flectance
Fa
ctor
2:1, OH Kt
Clayey texture Silty clay texture
-0.0015 -0.0005 0.0005 0.0015 0.0025
420 440 460 480 500 520 540 560 580 600 620 640
-0.0005 -0.0003 -0.0001 0.0001 0.0003 0.0005
2190 2200 2210 2220 2230 2240 2250 2260 2270 2280
450 nm - Gt
Absence of Gb 2265 nm
Smoothed features caused by OM
Intensit
y
Less pronounced peak, indicating less presence of Ht (580 nm) Additional feature of 2:1 B A B Gt A
Softer shoulder of Gt
Sharper shoulder of Gt OH+H2O
950 nm Gt
2205 nm - Kt 480 nm - Gt
2
nd Deri
va
ti
ve
of the
KM function
2:1: 2:1 Clay minerals
Wavelength (nm) RR-I RR-II Gt: Goethite Ht: Hematite Gb: Gibbsite Kt: Kaolinite
OM: Organic Matter OH: OH group
The Cambissolo Háplico (CX) spectrum showed a rectilinear shape along almost the entire spectral range (350 to 2,500 nm), with a maximum RF of 0.50 (Figure 9). This RF can be attributed to the high silt content (417 g kg-1) (Table 4), with predominance of weatherable minerals in this fraction. The derived spectral curve (Figure 9a) showed low iron oxide contents in CX, with a higher proportion of goethite (450 nm) than hematite (580 nm). A centered feature was observed at 850 nm for hematite, while that of goethite, centered at 950 nm, was masked by OM. Cambissolos (Inceptisols) are young soils with high silt contents, indicating a low evolution degree (Santos et al., 2013). With the ongoing rock weathering, surface layers of CX are developed, where Fe oxides are still being formed (Demattê et al., 2003), for this reason, the adsorption features of goethite and hematite in the spectrum were little defined. The larger proportion of goethite associated with a high OM content gave this soil a brownish color (7.5YR 4/6).
Absorption features of hydroxyl groups (1,400 and 1,900 nm) and 2:1 clay minerals (1,900 and 2,450 nm) were identified. Kaolinite showed absorption feature at 2,205 nm, while gibbsite was absent (2,265 nm) (Figure 9b), confirming the lower evolution degree of CX, as mentioned by Demattê et al. (2014). These descriptions agree with Moller and Kitagawa (1982), who analyzed the mineralogy of Cambissolos from the south-eastern Brazilian Amazon and reported the occurrence of Fe oxides, kaolinite, micas, quartz, and 2:1 clay minerals, but the absence of gibbsite in all soil samples. Studies of Campos (2004) and Barbosa et al. (2009) showed that in soils derived from metasedimentary rocks of pelitic origin, as in studied watersheds, the micaceous clay minerals in the silt fraction, e.g., illite, accounted for the highest proportion.
The linearization of the spectral curve of CX is related to the high OM content in the surface horizon (Table 5), which provides additional absorption of incident energy and attenuates the effect of minerals, making the features less sharp. This agrees with observations of Formaggio et al. (1996) and Demattê et al. (2012a, 2014) on the masking effect of OM on soil mineralogy, causing a flattening of the curve in the 350-2,500 nm range. However, the flat linearity from 1,000 nm onward is an effect of a low quartz content. Therefore, the spectral curve as a whole is the result of multiple effects. This reinforces the importance of spectral morphology analysis by MIRS (Demattê et al., 2014) of the adsorption features and the spectra in general.
The spectroscopic features of CX (Figure 8) were similar to those of other Cambissolos described by several authors (Formaggio et al., 1996; Bellinaso et al., 2010; Demattê and Terra, 2014).
VIS NIR SWIR
0.0 0.1 0.2 0.3 0.4 0.5 0.6 0.7 0.8 0.9 1.0
350 550 750 950 1150 1350 1550 1750 1950 2150 2350
Re flectance Fa ctor Kt 2:1, OH
Little sharp features
Plane format caused by influence of OM
-0.0010 -0.0007 -0.0004 -0.0001 0.0002 0.0005 0.0008 0.0011
420 440 460 480 500 520 540 560 580 600 620 640
-0.0005 -0.0002 0.0001 0.0004 0.0007
2190 2200 2210 2220 2230 2240 2250 2260 2270 2280
2205 nm - Kt
Absence of Gb 2265 nm
Intensit
y
Less pronounced peak, indicating less presence of Ht (580 nm)
B A B Additional feature of 2:1 Gt A OM smoothing Gt shoulder
Gt feature masked caused by OM presence
450 nm - Gt
480 nm - Gt
850 nm - Ht
OH+H2O
2
nd Deri
va ti ve of the KM function Wavelength (nm) 2:1: 2:1 Clay minerals
CX
Gt: Goethite Ht: Hematite
Gb: Gibbsite Kt: Kaolinite
OM: Organic Matter OH: OH group
The maximum RFs of the Gleissolo Háplico (GX) spectrum were 0.5, with a positive trend (Figure 10). The derivative spectral curve (Figure 10a) shows goethite (450 nm) and hematite (580 nm). No typical adsorption feature of goethite was detected in the 400 - 500 nm range, as similarly observed in all other spectra (Figures 5 to 9). This mineral had an adsorption feature centered at 950 nm (Figure 10). The presence of goethite and hematite in this soil may have been caused by the beginning of the pedogenetic process of laterization, associated to GX when the water regime is modified, causing a shift from a reducing to an oxidizing system (Santos et al., 2013).
The spectrum pattern of GX can be a consequence of lower Fe oxide and OM contents in the A horizon, expressing the exposure of primary minerals in the silt fraction more intensely, with a quartz content of 414 g kg-1 (Table 4). The variation in particle size and mineralogical composition of these soils is wide, due to the greater or lesser intensity of flooding events on floodplains and their respective sediment contributions (Reatto et al., 2000; Lacerda and Barbosa, 2012). Within the 1,400-2,205 nm range, the presence of kaolinite was observed with a typical feature of hydroxyl groups (1,400 and 1,900 nm), gibbsite (2,265 nm), and 2:1 clay minerals (1,900 nm) (Figure 9).
During flooding in the rainy periods, the floodplains of the studied watersheds as well as the Jardim River basin, receive sedimentation from local lithological material, since the DF is characterized by the presence of water springs, without major rivers. Thus, the material in hydromorphic soils deposited in the pedogenetic process in the DF consists of sediments originated from the lithology of the Paranoá, Canastra, and Bambuí groups (Freitas-Silva and Campos, 1998). This explains the presence of gibbsite and kaolinite in GX, since the sedimentary parent material has a meta-sedimentary lithology. These rocks, pre-weathered earlier in the genetic sedimentary process, were preserved since the metamorphic degree to which they were subjected was low (Freitas-Silva and Campos, 1998). The morphology of the GX spectrum coincides with descriptions of Demattê et al. (2012a).
CONCLUSIONS
Identification of soil-landscape relationships was fundamental for understanding pedogenetic processes along the toposequences, since the role of relief in the soil evolution of the studied area is extremely important.
VIS NIR SWIR
0.0 0.1 0.2 0.3 0.4 0.5 0.6 0.7 0.8 0.9 1.0
350 550 750 950 1150 1350 1550 1750 1950 2150 2350
Wavelength (nm)
Kt 2:1, OH
Gb -0.0010
-0.0005 0.0000 0.0005 0.0010 0.0015 0.0020
420 440 460 480 500 520 540 560 580 600 620 640
-0.0006 -0.0002 0.0002 0.0006 0.0010
2190 2200 2210 2220 2230 2240 2250 2260 2270 2280
450 nm - Gt
580 nm - Ht
2205 nm - Kt 2265 nm - Gb
Smoothed features by OM
Typical step of Kt presence
B
A
B
Gt Ht
A
2
nd Deri
va
ti
ve
of the
KM function
Re
flectance
Fa
ctor
Positiv
etendency 950 nm
- Gt
Kt, OH+H2O 2:1: 2:1 Clay minerals
GX
Gt: Goethite Ht: Hematite
Gb: Gibbsite Kt: Kaolinite
OM: Organic Matter OH: OH group
The soils in the watersheds of the Estanislau Creek and Jardim Stream had similar physical and chemical properties, with little variations related to the parent materials.
Clustering based on soil surface reflectance was efficient in determining soil groups with similar properties.
The surface reflectance data were related to the soil surface and subsurface properties determined by traditional analyses of soil samples, since the two approaches formed similar groups
Simultaneous interactions of soil properties were assessed by analysis of spectral morphology by MIRS, while the second derivative of the KM function adequately quantified the mineralogy of the spectra.
ACKNOWLEDGMENTS
The authors are indebted to Capes for the Master’s scholarship of the first author; to the Faculty of Agronomy and Veterinary Medicine of UnB; the Department of Soil Science of Esalq/USP; the research group GeoCis (http://esalqgeocis.wixsite.com/geocis/equipe); to Finatec for the financial support of this work; to Fapesp (grant number: 2014-22262-0) for providing the equipment used in the analysis of spectroscopy of reflectance (VIS-NIR-SWIR); and are particularly grateful to researcher and Professor Igo Fernando Lepsch for his critical review of the manuscript.
REFERENCES
Adamchuk V, Allred B, Doolittle J, Grote K, Viscarra Rossel RA. Tools for proximal soil sensing.
In: Ditzler C, Scheffe K, Monger HC, editors. Soil survey manual: soil science division staff.
Washington, DC: United States Department of Agriculture; 2017. (Handbook, 18). p. 355-56
Anjos LHC, Pereira MG, Pérez DV, Ramos DP. Caracterização e classificação de
Plintossolos no município de Pinheiro-MA. Rev Bras Cienc Solo. 2007;31:1035-44. https://doi.org/10.1590/s0100-06832007000500020
Barbosa IO, Lacerda MPC, Bilich MR. Relações pedomorfogeológicas nas chapadas elevadas do Distrito Federal. Rev Bras Cienc Solo. 2009;33:1373-83. https://doi.org/10.1590/s0100-06832009000500029
Bellinaso H, Demattê JAM, Romeiro SA. Soil spectral library and its use in soil classification. Rev
Bras Cienc Solo. 2010;34:861-70. https://doi.org/10.1590/s0100-06832010000300027
Ben-Dor E, Demattê JAM. Remote sensing of soil in the optical domains. In: Thenkabail OS, editor. Land resources monitoring, modeling, and mapping with remote sensing - Remote sensing handbook. Boca Ratom: CRC Press; 2015. v.2. p. 733-87.
Ben-Dor E, Heller D, Chudnovsky A. A novel method of classifying soil profiles in the field using
optical means. Soil Sci Soc Am J. 2008;72:1113-23. https://doi.org/10.2136/sssaj2006.0059
Bouyoucos GJ. Estimation of the colloidal material in soils. Science. 1926;64:362. https://doi.org/10.1126/science.64.1658.362
Brown DJ, Shepherd KD, Walsh MG, Mays MD, Reinsch TG. Global soil characterization
with VNIR diffuse reflectance spectroscopy. Geoderma. 2006;132:273-90.
https://doi.org/10.1016/j.geoderma.2005.04.025
Camargo LA, Marques Júnior J, Pereira GT. Spatial variability of physical properties of
an Alfisol under different hillslope curvatures. Rev Bras Cienc Solo. 2010;34:617-30.
https://doi.org/10.1590/s0100-06832010000300003