ISSN 1516-635X Jul - Sep 2004 / v.6 / n.3 / 153 - 157
Performance of Broilers Fed Diets With
Different Dietary Electrolyte Balance Under
Summer Conditions
R. Albuquerque
Faculdade de Medicina Veterinária e Zootecnia (FMVZ), Universidade de São Paulo.
Av. Duque de Caxias Norte, 225 13.635-900 - Pirassununga, SP.
E-mail: [email protected] Mail Address
Keywords
Broiler performance, chloride, electrolytes, potassium, sodium.
Borgatti LMO1 Albuquerque R2 Meister NC3 Souza LWO4 Lima FR5
Trindade Neto MA5
1 Graduate student, CENA/ESALQ/USP. 2 Professor at Faculdade de Medicina
Veterinária e Zootecnia (FMVZ), Universidade de São Paulo.
3 Animal Scientist, MSc Animal Nutrition. 4 Graduate student, VRA/FMVZ/USP. 5 Professor at Faculdade de Medicina
Veterinária e Zootecnia (FMVZ), Universidade de São Paulo. Author(s)
Arrived: april / 2004 Approved: september / 2004
ABSTRACT
The aim of this study was to compare performance and carcass characteristics of broilers fed diets with different Dietary Electrolyte balances (DEB) during the summer season. A total of 1,280 one-day-old Ross sexed chicks were distributed in 32 experimental units according to a randomized block design in a 4x2 factorial arrangement (4 levels and 2 sexes) and 4 replicates per treatment (40 birds per replicate). Feed program consisted of 3 phases (1-21, 22-42, 43-49 days of age). Experimental diets were formulated based on corn and soybean meal and adjusted to 210, 250, 290 and 330 mEq/kg of Na + K - Cl through the addition of sodium carbonate, potassium carbonate and ammonium chloride. Weekly measurements of body weight gain and feed intake were done, and at 49 days, birds were slaughtered to evaluate the dressing percentage and parts yield. Weight gain during the starter phase increased linearly (p<0.01) as DEB increased. Different DEB levels did not affect feed intake or mortality. Carcass characteristics were not affected by treatments. Dietary electrolytic balance influenced weight gain and feed gain ratio from 1 to 21 days, and best results were observed when diets contained 290 and 330 mEq/kg.
INTRODUCTION
In the last decades, broiler chicken production has experienced a great development. Nevertheless, poultry has also incorporated higher sensibility to stress factors along with this development. Among such factors, heat stress is one of the most important. It is responsible for considerable economic losses such as reduction in body weight gain and high mortality rates, which occur mainly during the summer when environmental temperatures are higher than the comfort temperature for birds.
Several management procedures are performed as an attempt to minimize the deleterious effects of heat stress. Thus, the addition of salts in the feed or drink water can beneficially affect the acid-base equilibrium of animals.
The effect of acid-base balance on the different metabolic processes of animals is currently an issue discussed by researchers worldwide. The concept of Dietary Electrolyte Balance (DEB) has also been applied for different species.
Dietary Electrolyte Balance, according to Mongin (1981), refers to the difference between positive and negative ions present in the diet (Na++K+-Cl-) and it is commonly expressed as mEq/kg of dry matter (DM).
MN = mEq Na+ + mEq K+ - mEq Cl
-This balance is related to the analysis of several factors and specific aspects such as the absorption, storage, utilization and excretion of minerals involved in animal nutrition.
Only a few specific studies in the literature assessed the influence of DEB on the performance and carcass yield of poultry, a fact that makes it difficult to put into practice the ideal balance concept for commercial diets. A previous study reported that values between 200 and 300 mEq/kg are the optimum DEB for maximum growth in poultry (Mongin & Sauveur, 1977). On the other hand, extreme values of DEB close to 0 and 600 mEq/kg resulted in growth depression. Data published by Johnson & Karunajeewa (1985) indicated that DEB levels between 250 and 300 mEq/kg are within the range for maximum growth of broilers.
The aim of this study was to assess different DEB effects on the live performance and carcass yield of broilers raised during the summer in the southeast of Brazil.
MATERIAL AND METHODS
The assay was carried out from 20/01 to 11/03/2000 at the Avian Experimental Laboratory (Animal Nutrition and Production Department) of Faculdade de Medicina Veterinária e Zootecnia, Universidade de São Paulo (USP).
A total of 1,280 one-day-old sexed Ross broiler chicks were randomly assigned to 32 floor pens, with 40 birds per pen (4.25 m2). The 32 floor pens were
grouped into four blocks of eight pens each. The eight treatments were assigned following a 4x2 factorial arrangement (4 DEB levels and 2 sexes) in a randomized block design. Internal compartments of the building were considered as blocks.
Standard broiler management practices were used. The maximum and minimum temperatures recorded inside the building were 30.6ºC and 23.8ºC, respectively.
Treatments consisted of different levels of DEB (210, 250, 290 and 330 mEq/kg DM). The levels were obtained by adding different proportions of salts (sodium carbonate, potassium carbonate and ammonium chloride), which were calculated using the following equation:
DEB = Na+ + K+ - Cl- mEq/kg DM of diet
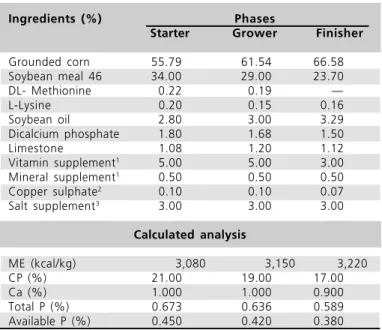
Diet formulation was performed according to the breed management guide. Experimental corn-soybean based diets were isocaloric and isoproteic, and DEB was adjusted in the different growing phases: starter (1-21 days), grower (22-42 days) and finisher (43-49 days). Diet composition is presented in Table 1 and sodium, chloride and potassium contents of each diet are presented in Table 2.
Table 1 - Composition of experimental diets.
Ingredients (%) Phases
Starter Grower Finisher
Grounded corn 55.79 61.54 66.58 Soybean meal 46 34.00 29.00 23.70
DL- Methionine 0.22 0.19
L-Lysine 0.20 0.15 0.16
Soybean oil 2.80 3.00 3.29
Dicalcium phosphate 1.80 1.68 1.50
Limestone 1.08 1.20 1.12
Vitamin supplement1 5.00 5.00 3.00 Mineral supplement1 0.50 0.50 0.50 Copper sulphate2 0.10 0.10 0.07 Salt supplement3 3.00 3.00 3.00
Calculated analysis
ME (kcal/kg) 3,080 3,150 3,220
CP (%) 21.00 19.00 17.00
Ca (%) 1.000 1.000 0.900
Total P (%) 0.673 0.636 0.589 Available P (%) 0.450 0.420 0.380 1 - Supplied per kilogram of diet - starter: vitamin A 120,000 IU, vitamin D3 40,000 IU, vitamin E 190 mg, menadione 32.5 mg, choline 4,000 mg, niacin 400 mg, pantothenic acid 125 mg, riboflavin 80 mg, thiamin 17.5 mg, folic acid 15 mg, biotin 2.5 mg, vitamin B12 200 mcg, virginiamycin 1,250 mg, growth promoter 437.5 mg, methionine 18,000 mg, antioxidant 300 mg, selenium 4.0 mg, iron 2,500 mg, copper 1,000 mg, manganese 10,000 mg, zinc 7.0 mg, iodine 0.13 mg; growing: vitamin A 100,000 IU, vitamin D3 30,000 IU, vitamin E 150 mg, menadione 25 mg, choline 4,000 mg, niacin 300 mg, pantothenic acid 90 mg, riboflavin 50 mg, pyridoxine 17.5 mg, thiamin 10 mg, folic acid 10 mg, biotin 2.0 mg, vitamin B12 150 mcg, virginiamycin 600 mg, growth promoter 200 mg, methionine 15,000 mg, antioxidant 300 mg, selenium 4.0 mg, iron 2,500 mg, copper 1,000 mg, manganese 10,000 mg, zinc 7.0 mg, iodine 0.13 mg; finishing: vitamin A 100,000 IU, vitamin D3 20,000 IU, vitamin E 130 mg, menadione 17 mg, choline 4,650 mg, niacin 325 mg, pantothenic acid 130 mg, riboflavin 65 mg, pyridoxine 15 mg, thiamin 8.0 mg, folic acid 0.7 mg, biotin 3.5 mg, vitamin B12,200 mcg, growth promoter 100 mg, methionine 13,000 mg, antioxidant 1,200 mg, selenium 3.5 mg, iron 2,500 mg, copper 1,000 mg, manganese 10,000 mg, zinc 7.0 mg, iodine 0.13 mg. 2 - Copper sulphate was included only in 210 mEq/kg diets. 3 - Salt supplement contains variable amounts of potassium carbonate, sodium carbonate, sodium chloride and ammonium chloride in order to obtain 210, 250, 290 and 330 mEq/kg.
* SAS Institute Inc., Cary, NC 27511.
Performance data were evaluated in the starter, grower and finisher phases and the analyzed characteristics were average body weight gain (BWG, g/d), average feed intake (FI, g/d), feed to gain ratio (F:G, g feed/g body weight gain) and mortality (%).
Performance, carcass composition, and mortality data were analyzed by ANOVA as described by Snedecor & Cochran (1967) using the SAS®* General
Linear Model procedure.
RESULTS AND DISCUSSION
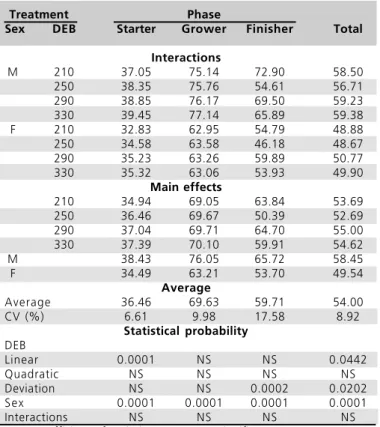
Body weight gain (BWG) increased linearly (p<0.01) with DEB from 1 to 21 days of age for both sexes (Table 3). The following linear equations were derived y = 29.146938 + 0.019794x for females and y = 33.081938 + 0.019794x for males (R2 = 0.83). The best BWG was
observed at 330 mEq/kg, although the rate of gain decreased with age. Such value is higher than the value considered as ideal (250 mEq/kg) by Mongin (1981), but is within the range of 250-350 mEq/kg suggested by Johnson & Karunajeewa (1985). Better performance was also seen in birds from 1 to 21 days old fed with diets containing DEB between 246 and 315 mEq/kg, levels that did not cause tibial dyschondroplasia or acid-base disturbance (Murakami et al., 2000). Borges et al. (1999) reported growing rate depression in chicks
between 1 and 7 days old as a result of high values of
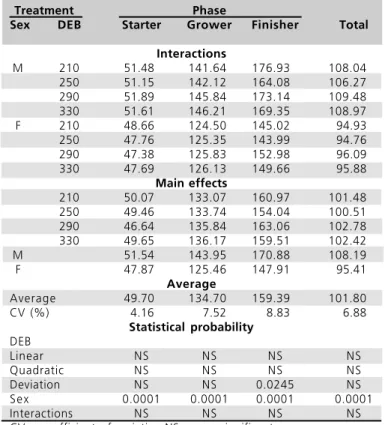
As shown in Table 4, no significant (p>0.05) differences were observed among treatments for feed intake. However, Oviedo-Rondon et al. (2001)
observed feed intake reduction in response to dietary increase of the Mongin number obtained by chloride addition.
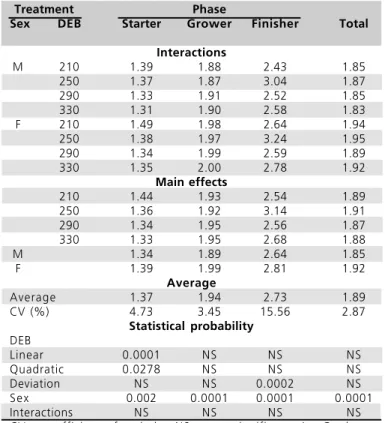
Figure 1 shows the quadratic effect of DEB on the F:G ratio of females (p<0.05) in the starting phase, whereas a linear effect was seen for male birds. The estimated optimum F:G ratio is obtained using 266 mEq/kg. According to Hullan et al. (1987), FG is not
Abdominal fat content was calculated according to Cabel et al. (1987), including the gizzard surrounding
fat. Carcass yield, innards and retail cuts were assessed according to Souza et al. (1994).
Table 2 - Calculated contents of sodium, chloride and potassium in each DEB level of experimental diets.
Period Nutrients Treatments (mEq/kg)
(days) 210 250 290 330
Sodium (%) 0.18 0.18 0.18 0.18
Starter Chloride (%) 0.39 0.32 0.27 0.22
Potassium (%) 0.95 1.02 1.12 1.22
Sodium (%) 0.18 0.18 0.18 0.18
Grower Chloride (%) 0.39 0.32 0.27 0.22
Potassium (%) 0.95 1.02 1.12 1.22
Sodium (%) 0.18 0.18 0.18 0.18
Finisher Chloride (%) 0.39 0.32 0.27 0.22
Potassium (%) 0.95 1.02 1.12 1.22
DEB in the diet (354-360 mEq/kg) by supplementing K+
or Na+. On the other hand, growing rate depression
was not seen in the present study in the group fed the highest DEB level (330 mEq/kg) by addition of K+
(1.21%). On the other experimental phases (22 to 42, 43 to 49 and 1 to 49 days of age), no differences were observed among treatments for BWG. Results for the period from 1 to 49 days differed from those observed by Borges et al. (1999), who reported better BWG by
using diets with 240 mEq/kg, a level similar to the ideal DEB indicated by Mongin (1981).
Table 3 - Daily average weight gain (g/bird/day) for male and female broilers fed with different DEB levels in the starter, grower and finisher phases.
Treatment Phase
Sex DEB Starter Grower Finisher Total
Interactions
M 210 37.05 75.14 72.90 58.50
250 38.35 75.76 54.61 56.71
290 38.85 76.17 69.50 59.23
330 39.45 77.14 65.89 59.38
F 210 32.83 62.95 54.79 48.88
250 34.58 63.58 46.18 48.67
290 35.23 63.26 59.89 50.77
330 35.32 63.06 53.93 49.90
Main effects
210 34.94 69.05 63.84 53.69
250 36.46 69.67 50.39 52.69
290 37.04 69.71 64.70 55.00
330 37.39 70.10 59.91 54.62
M 38.43 76.05 65.72 58.45
F 34.49 63.21 53.70 49.54
Average
Average 36.46 69.63 59.71 54.00
CV (%) 6.61 9.98 17.58 8.92
Statistical probability
DEB
Linear 0.0001 NS NS 0.0442
Quadratic NS NS NS NS
Deviation NS NS 0.0002 0.0202
Sex 0.0001 0.0001 0.0001 0.0001
Interactions NS NS NS NS
y = 14.50977 - 0.02908x + 0.00005x2 R2 = 0.40
y = 16.16298 - 0.04440x + 0.00008x2 R2 = 0.40
9,5 9,8 10,1 10,4 10,7 11,0
210 250 290 330
DEB, mEq/ kg of diet
W
in
g
,
%
Female Male
gizzard, feet, blood and non-edible innards corroborating results reported by Borges et al. (1999).
However, DEB levels in the diets affected some parts yields. A quadratic effect of DEB on wing (p<0.05) is observed in Figure 2 and the best average was obtained by using 210 mEq/kg. The estimated optimum wing yield was seen when levels of 291 and 278 mEq/kg of diet were used for females and males, respectively. Breast yield increased linearly as demonstrated in the equations y = 0.290070+ 0.000063x for females and y = 0.268945 + 0.000063x for males (R2=0.71), and
the best result was observed when 330 mEq/kg were used. A quadratic effect was observed on leg and thigh yield for males (Figure 3). The estimated optimum leg and thigh yield is achieved by using 286 mEq/kg of diet.
Figure 2 - Effect of different DEB on the wing yield of male and female broiler chickens.
Figure 3 - Effect of different DEB on the leg and thigh yield of male broiler chickens.
y = 2.94698 - 0.01064x + 0.00002x2
R2 = 0.61
y = 1.51231 - 0.00063x R2 = 0.57
1,2 1,3 1,4 1,5 1,6
210 250 290 330
DE B, mE q/ k g of die t
FG
(
g
o
f
d
ie
t/
g
o
f
w
e
ig
h
t
g
a
in
)
Fe ma le M a le
altered when DEB is within the range of 155-330 mEq/ kg, but nevertheless Borges et al. (1999) observed the
same quadratic effect of K+ addition that resulted in
DEB levels between 119 and 127 mEq/kg in pre-initial diets.
Table 4 - Daily average feed intake (g/day) for male and female broilers fed with different DEB levels in the starter, grower and finisher phases.
Treatment Phase
Sex DEB Starter Grower Finisher Total
Interactions
M 210 51.48 141.64 176.93 108.04 250 51.15 142.12 164.08 106.27 290 51.89 145.84 173.14 109.48 330 51.61 146.21 169.35 108.97
F 210 48.66 124.50 145.02 94.93
250 47.76 125.35 143.99 94.76 290 47.38 125.83 152.98 96.09 330 47.69 126.13 149.66 95.88
Main effects
210 50.07 133.07 160.97 101.48 250 49.46 133.74 154.04 100.51 290 46.64 135.84 163.06 102.78 330 49.65 136.17 159.51 102.42
M 51.54 143.95 170.88 108.19
F 47.87 125.46 147.91 95.41
Average
Average 49.70 134.70 159.39 101.80
CV (%) 4.16 7.52 8.83 6.88
Statistical probability
DEB
Linear NS NS NS NS
Quadratic NS NS NS NS
Deviation NS NS 0.0245 NS
Sex 0.0001 0.0001 0.0001 0.0001
Interactions NS NS NS NS
CV coefficient of variation.NS non significant.
Figure 1 - Effect of different DEB on the feed:gain ratio of male and female broiler chickens from 1 to 21 days old.
The different Na + K - Cl ratios had no effects (p>0.05) on carcass yield, abdominal fat, heart, liver,
y = 54.16043 - 0.18870x + 0.00033x2 R2 = 0.45
27,0 27,5 28,0 28,5 29,0 29,5 30,0
210 250 290 330
DEB, mEq/ kg of diet
Le
g
a
n
d
t
h
ig
h
,
%
M ale
REFERENCES
Borges SA, Ariki J, Moraes VMB, Silva AVF, Maiorka A, Sorbara JOB. Relação (Na+K-Cl) em dietas de frangos de corte durante o verão. In: Conferência Apinco de Ciência e Tecnologia Avícolas; 1999; Campinas, São Paulo. Brasil. p.20.
Borges SA, Ariki J, da Silva AVF, Maiorka A, Laurentiz AC. Balanço eletrolítico na dieta pré-inicial de frangos de corte. Revista Brasileira de Ciência Avícola 2000; (Suplemento 2):38.
Cabel MC, Goodwin TL, Waldroup PW. Reduction in abdominal fat content of broiler chickens by the addition of feather meal to finisher diets. Poultry Science 1987; 66:1644-51.
Hullan HW, Simons PCM, Schagen PJW, Mcrae KB, Proudfoot FG. Effect of dietary cation-anion balance and calcium content on general performance and incidence of leg abnormalities of broiler chickens. Canadian Journal of Animal Science; 1987 67:165-77.
Jonhson RJ, Karunajeewa H. The effects of dietary minerals and electrolytes on the growth and physiology of the young chick. Journal of Nutrition 1985; 115:1680-1690.
Mongin P. Recent advances in dietary anion-cation balance: applications in poultry. Proceedings of Nutrition Society 1981; 40(3):285-294.
Mongin P, Sauveur B. Interrelationships between mineral nutrition, acid-base balance, growth and cartilage abnormalities. In: Boornman, KN, Wilson, BJ (Ed.). Growth and poultry meat production. Edinburgh(UK): British Poultry Science; 1977. p.235-47.
Murakami AE, Galli JR, Martins EN, Volski T, Furlan AC, Pereira MS. Efeito do balanço eletrolítico em dietas de baixo conteúdo de proteína no desempenho e na incidência de discondroplasia tibial em frangos de corte. Revista Brasileira de Ciência Avícola 2000; (Suplemento 2):40.
Oviedo-Rondon EO, Murakami AE, Furlan AC, Moreira I, Macari M. Sodium and Chloride requirements of young broiler chickens fed corn-soybean diets (one to twenty-one days of age). Poultry Science 2001; 80:592-598.
Silva AVF, Freire WJ, Satto J. Estudo de diferentes indicadores do estresse calórico em frangos de corte. Revista do Setor de Ciências Agrárias 1993; 12:88-90.
Snedecor GW, Cochran BWG. Statistical methods. 2 ed. Ames(IA): Iowa State University Press; 1967.
Souza PA, Souza HBA, Campos FP, Brognoni E. Desempenho e características de carcaça de diferentes linhagens comerciais de frangos de corte. Revista da Sociedade Brasileira de Zootecnia; 1994 23(5):782-91.
These results are in agreement to Borges et al. (1999) and Johnson & Karunajeewa (1985), who observed no effects of different DEB on the carcass yield and retail cuts.
The observed percentage of mortality during the entire period was considered low, with an average of 1.86% and no treatment effect (p<0.01) was observed in any of the evaluated phases, fact that is in accordance to Hullan et al. (1987) and Borges et al.
(2000).
Table 5 - Feed:gain ratio for male and female broilers fed with different DEB levels in the starter, grower and finisher phases.
Treatment Phase
Sex DEB Starter Grower Finisher Total
Interactions
M 210 1.39 1.88 2.43 1.85
250 1.37 1.87 3.04 1.87
290 1.33 1.91 2.52 1.85
330 1.31 1.90 2.58 1.83
F 210 1.49 1.98 2.64 1.94
250 1.38 1.97 3.24 1.95
290 1.34 1.99 2.59 1.89
330 1.35 2.00 2.78 1.92
Main effects
210 1.44 1.93 2.54 1.89
250 1.36 1.92 3.14 1.91
290 1.34 1.95 2.56 1.87
330 1.33 1.95 2.68 1.88
M 1.34 1.89 2.64 1.85
F 1.39 1.99 2.81 1.92
Average
Average 1.37 1.94 2.73 1.89
CV (%) 4.73 3.45 15.56 2.87
Statistical probability
DEB
Linear 0.0001 NS NS NS
Quadratic 0.0278 NS NS NS
Deviation NS NS 0.0002 NS
Sex 0.002 0.0001 0.0001 0.0001
Interactions NS NS NS NS
CV coefficient of variation.NS non significant. 1 - Graduate student, CENA/ESALQ/USP. 2 - Professor at Faculdade de Medicina Veterinária e Zootecnia (FMVZ), Universidade de São Paulo. 3 -Animal Scientist, MSc -Animal Nutrition. 4 - Graduate student, VRA/ FMVZ/USP. 5 - Professor at Faculdade de Medicina Veterinária e Zootecnia (FMVZ), Universidade de São Paulo.
CONCLUSIONS