COMPARED PERFORMANCE OF PENETROMETERS AND
EFFECT OF SOIL WATER CONTENT ON PENETRATION
RESISTANCE MEASUREMENTS
(1)Edison Aparecido Mome Filho(2), Alvaro Pires da Silva(3), Getulio Coutinho Figueiredo(4),
Fernando Henrique Setti Gimenes(2) & André Cesar Vitti(5)
SUMMARY
Modern agriculture techniques have a great impact on crops and soil quality, especially by the increased machinery traffic and weight. Several devices have been developed for determining soil properties in the field, aimed at managing compacted areas. Penetrometry is a widely used technique; however, there are several types of penetrometers, which have different action modes that can affect the soil resistance measurement. The objective of this study was to compare the functionality of two penetrometry methods (manual and automated mode) in the field identification of compacted, highly mechanized sugarcane areas, considering the influence of soil water volumetric content (θθθθθ) on soil penetration resistance
(PR). Three sugarcane fields on a Rhodic Eutrudrox were chosen, under a sequence of harvest systems: one manual harvest (1ManH), one mechanized harvest (1MH) and three mechanized harvests (3MH). The different degrees of mechanization were associated to cumulative compaction processes. An electronic penetrometer was used on PR measurements, so that the rod was introduced into the soil by hand (Manual) and by an electromechanical motor (Auto). The θθθθθ was measured in
the field with a soil moisture sensor. Results showed an effect of θθθθθ on PR
measurements and that regression models must be used to correct data before comparing harvesting systems. The rod introduction modes resulted in different mean PR values, where the “Manual” overestimated PR compared to the “Auto” mode at low θθθθθ.
Index terms: sugarcane, mechanization, compaction, soil water content.
(1) Excerpt from the first author Master's Thesis, Soil and Plant Nutrition course of Escola Superior de Agricultura "Luiz de
Queiroz", University of São Paulo ESALQ/USP. Received for publication on June 8, 2012 and approved on November 21, 2013.
(2) Doctoral student of Soil and Plant Nutrition, ESALQ/USP. Av. Pádua Dias, 11. CEP 13418-900 Piracicaba (SP), Brazil. E-mail:
[email protected], [email protected]
(3) Professor, ESALQ/USP. E-mail: [email protected]
(4) Doctor in Soil and Plant Nutrition, ESALQ/USP. E-mail: [email protected]
(5) Researcher, Agência Paulista de Tecnologia dos Agronegócios. Rua São Jorge, 283. PO Box 181. CEP 13411-516 Piracicaba
RESUMO:DESEMPENHO DE DOIS PENETRÔMETROS E EFEITO DO TEOR DE ÁGUA NA AVALIAÇÃO DA RESISTÊNCIA DO SOLO À PENETRAÇÃO
As técnicas da agricultura atual geram grande impacto na qualidade do solo e na produtividade das culturas devido, principalmente, aos aumentos do tráfego e peso dos maquinários. Diversos equipamentos têm sido desenvolvidos para avaliação a campo de atributos do solo, visando manejar áreas compactadas. A penetrometria é uma técnica muito utilizada para este fim, entretanto, existem diversos tipos de penetrômetros, os quais possuem modos de atuação diferenciados que podem influir nas medições de resistência à penetração. O objetivo deste estudo foi verificar a funcionalidade de dois métodos de penetrometria (esforço manual e automático) na identificação in situ de áreas compactadas sob manejo altamente mecanizado de cana-de-açúcar, considerando a influência do teor de água do solo (θ) sobre a resistência do solo à penetração (RP). Foram escolhidas três áreas cultivadas com cana-de-açúcar em um Latossolo Vermelho eutrófico típico, nas quais havia ocorrido uma colheita manual (1ManH), uma colheita mecanizada (1MH) e três colheitas mecanizadas (3MH). Nestas áreas, os graus de mecanização foram associados aos processos cumulativos de compactação do solo. Utilizou-se um penetrômetro eletrônico para medição da RP, de modo que a introdução da haste no solo foi realizada por esforço manual (Manual) ou utilizando um motor eletromecânico (Auto). A verificação do θ foi realizada in situ por meio de um sensor da umidade do solo. Os resultados comprovaram que o θ influi nos resultados de RP e que equações de regressão devem ser utilizadas para correção dos dados antes da comparação de sistemas de colheita. Os modos de introdução da haste para penetrometria apresentaram diferenças significativas entre os valores médios de RP, ocorrendo superestimação pelo modo “Manual” em relação ao “Auto” em baixos valores de θ.
Termos de indexação: cana-de-açúcar, mecanização, compactação, teor de água no solo.
INTRODUCTION
Sugarcane (Saccharum officinarum L.) is responsible for two main Brazilian commodities - sugar and ethanol. The area of sugarcane plantations in the 2011/2012 growing season was 8.4 million hectares, of which 52.6 % (4.4 million hectares) in the state of São Paulo (CONAB, 2012). From planting to harvest, sugarcane cultivation is a highly mechanized process (Ceddia et al., 1999; Paulino et al., 2004), and the increase of machinery traffic has caused soil physical degradation, creating obstacles for root growth (Carrara et al., 2007). Therefore, with the advent of mechanization, measuring the compaction degree of soils under sugarcane (Souza et al., 2006) as well as the development of techniques that may improve the compaction management have become crucial.
Soil compaction can be defined as the reduction of soil porosity and increase in bulk density, resulting from the application of external anthropogenic pressure (Souza et al., 2010). The physical problems for plant growth caused by soil compaction consist of negative effects on root elongation, giving the soil a massive appearance due to reduced porosity (Oliveira et al., 2010). The determination and control of soil compaction are based on reliable indices for decision making. Soil penetration resistance (PR) has been prioritized in soil management and studies on soil physics (Blainski et al., 2008; Assis et al., 2009, Souza et al., 2010; Medeiros et al., 2011; 2013), due to the ease and speed of measurement (Busscher et al., 2000.)
and correlation with plant properties, such as root growth (Dexter, 1987; Busscher & Bauer, 2003; Otto et al., 2011) and yield (Whalley et al., 2008; Oliveira et al., 2011; Bangita & Rao, 2012; Costa et al., 2012). Several penetrometers have been developed to assess PR in soil management systems (Figueiredo et al., 2011). However, the values measured with these instruments may differ (Beutler et al., 2007). The main difference is related to the insertion speed of the rod into the soil, which can be constant or interfere with the results of the in situ measurements, according to the operator (Herrick & Jones, 2002). The reliability of data generated by hand penetrometers is directly related to the control of the rod speed during insertion into the soil, although maintaining a constant speed is almost impossible (Carrara et al., 2007). So, when the speed is not constant, neither is the applied force (Herrick & Jones, 2002); if the rod insertion speed is accelerated, the force is increased, and decreased in the case of deceleration (Sun et al., 2006).
Intrinsic soil properties can also affect PR values, among which water content (θ) deserves attention.
According to Cunha (2002), although many studies have been carried out, there is no conclusive measurement of the influence of θ on PR variation in
different soils, or a result whether water additions influence the coefficient of variation of PR data for a given soil. Some researchers assume that field capacity
θ is ideal for determining the PR (Henderson, 1989;
Thus, the aim of this work was to verify the functionality of two electronic penetrometers (a manual and an automatic) for field identification of areas with different compaction degrees under highly mechanized sugarcane cultivation, considering the influence of water content on soil penetration resistance.
MATERIAL AND METHODS
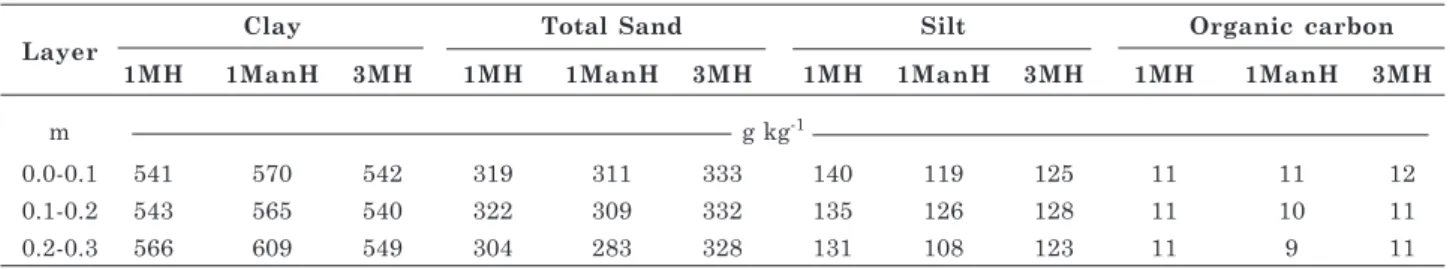
The experiment was conducted in 0.24 ha sugarcane fields (80 × 40 m plots) of the Agência Paulista de Tecnologia dos Agronegócios (APTA), in Piracicaba, São Paulo. The experimental area is located at 22o 41' 04" S and 47o 38' 52" W, at 550 m altitude. The region has a humid subtropical climate, Cwa according to Köppen, with an average temperature of 24 oC, hot and humid summers and an average rainfall of 229.5 mm in January and mild winters with average rainfall of 28.2 mm in July, with average annual rainfall of 1,273 mm. For this experiment three areas were selected, in the middle slope (550 m), in an undulating relief, with 10 % northwest slope and aligned in the same terrace in the northeast direction: one with a sugarcane ratoon crop, planted in July/2010 and harvested by hand in July 2011 (1ManH), one with sugarcane ratoon crop, planted in April 2010 and harvested mechanically in July 2011 (1MH) and another with sugarcane, planted in April / 2008 and harvested mechanically three times (June 2009, June/2010 and July/2011) (3MH). In the areas 1ManH and 1MH all rows were covered with crop residues. In the 3MH area, differently, two of every three rows were tilled with a cultivator, that relocated all residues to the third row. In this area, data were only collected from the uncultivated rows, while in 1ManH and 1MH all rows were sampled. The selection criteria of the areas was based on the increasing mechanization of the areas during sugarcane cultivation, since at a higher degree of mechanization, the soil is more likely to be affected by compaction. The soil is a fine, isothermic Rhodic Eutrudox (Soil Survey Staff, 1999). The uniformity of the areas was confirmed by the low variation in particle size distribution and soil organic carbon content (Table 1). Sugarcane had been grown on all experimental areas for the last 20 years.
Soil tillage before planting consisted of: one heavy harrowing (26" discs spaced 25 cm apart, weight 750 kg), one sub soiling with five subsoiler rods coupled to a Massey Ferguson MF292 tractor stroke, two diskings, a heavy and a medium (26" discs, spaced 25 cm apart, weight 450 kg), and furrowing for setts planting. Variety RB86-7515 was planted in the area 1ManH, IAC87-3396 in 1MH and SP81-3250 in 3MH. Three months after planting, a “hilling-up” operation was performed, consisting of leveling ridges with a ridger, using a harrow between rows, and covering the tillers. The sugarcane was mechanically harvested with a single row harvester, accompanied by a trailer (1MH and 3MH). Manual harvesting was performed by cutting the plants with a machete and subsequently piling them on trucks for removal (1ManH). In all cases the sugarcane trash was not burnt.
To obtain the PR (MPa), an electronic penetrometer model PLG1020 (Falker Agricultural Automation) was used. Data acquisition in the field occurred in two ways: by hand (“Manual”), in which the conical tip and the penetrometer rod were inserted into the ground by the operator’s force; and automated (“Auto”), in which the equipment was coupled with an electromechanical soil sampler, developed by Figueiredo (2010), which performed measurements at constant speed (5 × 10⁻³ m s-1). The conical tip had a basal area of 7.74 × 10⁻⁵ m², angle of 30o, stuck in a rod of 0.40 m length and 6 × 10⁻³ m diameter.
PR readings were obtained in the field instantly. Measurements were taken at 0.01 m intervals to a depth of 0.3 m and means were calculated for every 0.1 m interval. All measurements were performed between rows in a fixed grid, totaling 182 points per plot. In 1ManH and 1MH, the sampling grid was 5 × 1.5 m, totaling 13 sampling points in each interrow and 14 rows per area. In 3MH, the grid was 2.5 × 4.5 m with 26 sampling points per interrow and 7 rows in total. At each point, PR was first measured by “Manual” mode in the center of the interrows; then, at a 0.15 m distance, parallel to the crop rows, “Auto” mode was performed; θ (m3 m-3) data were collected between these two points. For analysis of PR values, data greater or equal to 2 MPa were considered high, for affecting root growth of most crops (Taylor et al., 1966). For each 0.1 m, to a depth of 0.3 m, θ was
obtained directly in the field with a Delta T Devices
Layer
Clay Total Sand Silt Organic carbon
1MH 1ManH 3MH 1MH 1ManH 3MH 1MH 1ManH 3MH 1MH 1ManH 3MH
m g kg-1
0.0-0.1 541 570 542 319 311 333 140 119 125 11 11 12
0.1-0.2 543 565 540 322 309 332 135 126 128 11 10 11
0.2-0.3 566 609 549 304 283 328 131 108 123 11 9 11
sensor (ML2x ThetaProbe), to enable the correlation with the average PR values.
Disturbed and undisturbed soil samples were randomly collected. From each experimental area, 30 undisturbed soil samples, 10 per soil layer, were taken in metal cylinders (9.8 × 10⁻³ m3), using an electromechanical soil sampler (Figueiredo, 2010). These samples were used to determine soil bulk density (BD) (Mg m-3) (Grossman & Reinsch, 2002) and field capacity (FC) (m3 m-3) on a suction table at 0.01 MPa suction (Ball & Hunter, 1988). Disturbed samples were collected and used to obtain soil particle density (PD) (Mg m-3) by a helium gas pycnometer (AccuPyc 1330 model, Micromeritics Instrument Corporation ®), soil particle size distribution by a hydrometer (Grossman & Reinsch, 2002) and soil organic carbon content (OC) by Walkey–Black method (Anderson & Ingram, 1992). Total soil porosity was calculated (TP) (m3 m-3) from the equation: TP = 1 - (BD/PD) (Vomocil, 1965) and macroporosity (Mac) was considered the difference between TP and FC.
Statistical analysis was performed in the R Project software (R Development Core Team, 2011). For analysis of θ influence on PR, the mean confidence
interval was used, with α<5 % (Payton et al., 2000),
to compare mean PR before (field data) and after correlation with θ (corrected data). Thus, PR values
were measured in the field and an average PR value was obtained per experimental area and layer. Additionally, an average PR was obtained by estimation, using regression models (corPR). To compare the modes “Manual” and “Auto”, a paired t test was applied to corPR, with α<5 %, and, due to
the heterocedasticity of correlation θ × RP, verified
by analysis of a 1:1 correlation line, corPR was calculated for an average field capacity (0.35 m3 m-3) and for a lower in situθ (0.10 m3 m-3). The regression model used was PR=aθb (Busscher & Sojka, 1987; Busscher, 1990; Busscher et al., 1997), where a and b are empirical parameters.
RESULTS AND DISCUSSION
Soil physical properties
There was no significant difference (p>0.05) in BD (Table 2) among the studied areas (1ManH, 1MH and 3MH) and the values were considered high (general mean of 1.49 Mg m-3). Reichert et al. (2003) reported that, for clayey soils, root growth-limiting BD values are between 1.30 and 1.40 Mg m-3. Several studies demonstrated that mechanization increases BD (Jorajuria & Draghi, 1997; Yavuscan, 2000; Shafer-Landefeld et al., 2004). Furthermore, it is known that there is a positive correlation between PR and BD (Mirreh & Ketcheson, 1972; Perumpral & Ayers, 1982; Henderson et al., 1988; Blanco-Sepulveda, 2009). The variation in BD within each area was low (CV < 5 %
in most cases), in agreement with Warrick (1998), who stated that BD is a low variability property with CV < 15 %. The CV was highest for the surface layer (0.0-0.1 m), which can be explained by changes due to management and by the fact that this layer is explored most by the root system (Imhoff et al., 2001). The PD means were close to 2.70 Mg m-3, close to the mean values of 2.65 Mg m-3 often mentioned in the literature (Timm & Reichardt, 2004; Libardi, 2005).
As no differences were found in BD between areas, TP followed the same tendency (Table 2). However, FC behaved differently, with values following an order of 1ManH > 1MH = 3MH in the surface layer. It can be inferred that the different harvesting systems influenced mainly soil mesoporosity and microporosity, decreasing FC under more intense machine traffic. The same was not observed for Mac, which did not differ between the studied areas.
The high mechanization at all sugarcane crop stages contributed to high BD values, regardless of the harvesting system. Since BD values were similar, it is assumed that changes between areas are due to differences in soil microstructure, resulting in modification of the microporosity and related to the FC. Some micropores could be turned into blocked pores, which are filled with air even when soil is saturated and can be quantified by the difference between TP and θ at saturation (Bernadier et al.,
1991), which contributed to decrease water retention in more mechanized harvesting systems. These pores are generated by soil particles approaching one another, increasing contact surfaces and preventing water from entering into voids. By micromorphological analysis, Silva & Cabeda (2006) found particle rearrangement under sugarcane soils due to compaction, increasing the contact points in the soil matrix, which may explain the formation of blocked pores and the differences in FC due to the sugarcane management. The increase in points of contact may also cause differences in PR, even when BD is similar. This occurs when the soil highly cohesive, i.e., particles are more closely connected (Vepraskas, 1984) Under these conditions, the chances that the penetrometer rod would find pores that allow a less restricted passage are reduced, since its entry into the soil is facilitated when a pore, or a crack, reduces the frictional forces between rod and soil. Therefore, PR values tend to increase under these conditions.
The BD, PD and TP data show the uniformity of the three areas and the differences in the key properties influencing PR were insufficient to influence the results. Thus, it can be inferred that PR values depended mainly on the hydraulic properties, influenced by the harvesting system, expressed by different FC values in the areas.
Relationship between PR and θθθθθ
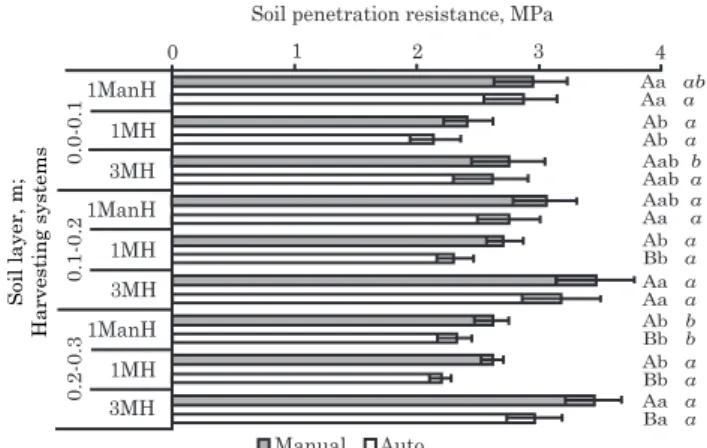
comparing the PR and disregarding θ, we observed
contrasting results for the mean confidence interval, so that in measurements in both modes, “Manual” and “Auto”, the PR values in 1MH were lower in all layers (0.0-0.3 m) (Figure 1).
This area (1MH) had the most homogeneous cover of plant residues in the sugarcane interrows of the ratoon crop, where the area of covered was larger than of exposed soil. This may have contributed to a lower drying rate in that area compared to the others. Souza et al. (2005) found that in the green-harvested sugarcane system, with and without trash incorporation, soil water storage was higher, possibly due to the barrier these residues formed on the surface, hindering the water outlet and decreasing evapotranspiration (Oliveira et al., 2010). Furthermore, the protection against light rays maintains the soil temperature lower (Bortoluzzi & Eltz, 2000). Because the increase in θ decreases PR
(Perumpral, 1987), the harvesting system that contributed to θ maintenance for a longer time may
have induced the lower PR in 1MH. From 1ManH, θ
was quickly lost due to the almost absence of trash in interrows. Due to the cumulative machinery traffic effect the PR increase with reduction of θ was most
significant in 3MH, despite an intermediate amount of trash (1MH > 3MH > 1ManH).
In the soil surface layers there was no significant difference (p>0.05) between 1ManH and 3MH. A similar result was found by Koch et al. (2008) when studying the cumulative effect of machinery passages. They observed that in the subsurface layer (0.01-0.05 m) there were no differences between control areas, without passing machines, and measurements after three machinery passages. However, at greater depths (0.18-0.35 m), PR values were three times higher in areas of more machinery traffic.
Another important factor that affects PR results is the relationship between compaction/surface and pressure/machinery weight. Smith and Dickson (1990) pointed out that, at the surface, compaction depends on the pressure of the wheelset, whereas in the deepest layers it is governed by its weight. They concluded that, to decrease compaction in the deeper layers, it is necessary to construct lighter machinery. However, Jorajuria & Draghi (1997) affirmed that traffic frequency also interferes with the soil response to compaction and a lightweight tractor, in several passages, may cause as much or more damage than a heavy tractor used less frequently. Therefore, considering that in all experimental areas machinery was used throughout the crop cycle and that, after a stress, soil becomes more resistant to structure changes, a similar response to compaction is expected
BD PD TP FC Mac
1MH 1ManH 3MH 1MH 1ManH 3MH 1MH 1ManH 3MH 1MH 1ManH 3MH 1MH 1ManH 3MH
Mg m-3 m3 m-3
0.0-0.1 m
Max 1.54 1.51 1.54 2.68 2.68 2.71 0.55 0.50 0.53 0.34 0.35 0.34 0.26 0.28 0.17 Mean 1.39 a 1.44 a 1.45 a 2.67 b 2.68 b 2.70 a 0.48 a 0.46 a 0.46 a 0.31 b 0.34 a 0.32 b 0.15 a 0.17 a 0.12 a Min 1.19 1.35 1.26 2.64 2.67 2.69 0.42 0.44 0.43 0.27 0.32 0.28 0.09 0.09 0.09 SD 0.14 0.05 0.08 0.02 0.01 0.01 0.05 0.02 0.03 0.03 0.01 0.02 0.05 0.08 0.03 CV (%) 9.83 3.53 5.62 0.61 0.24 0.25 10.7 4.1 6.53 8.31 2.47 6.3 33.64 45.98 20.45
0.1-0.2 m
Max 1.64 1.59 1.62 2.69 2.69 2.70 0.46 0.47 0.47 0.37 0.37 0.37 0.14 0.13 0.13 Mean 1.54 a 1.49 a 1.53 a 2.67 b 2.68 b 2.70 a 0.42 a 0.44 a 0.43 a 0.34 ab 0.35 a 0.34 b 0.09 a 0.08 a 0.09 a Mín 1.45 1.41 1.44 2.64 2.66 2.69 0.39 0.41 0.4 0.32 0.33 0.32 0.05 0.04 0.04
SD 0.06 0.07 0.06 0.02 0.01 0 0.02 0.02 0.02 0.01 0.01 0.01 0.03 0.03 0.03
CV (%) 4.07 4.46 3.77 0.78 0.34 0.17 5.53 5.61 4.94 3.77 3.25 3.77 28.23 40.67 33.79
0.2-0.3 m
Max 1.56 1.58 1.64 2.69 2.69 2.7 0.45 0.47 0.48 0.38 0.4 0.38 0.19 0.11 0.13
Mean 1.52 a 1.51 a 1.54 a 2.68 b 2.68 b 2.70 a 0.43 a 0.44 a 0.43 a 0.36 a 0.37 a 0.33 b 0.10 a 0.07 a 0.07 a Mín 1.47 1.43 1.39 2.64 2.67 2.7 0.42 0.41 0.39 0.32 0.33 0.29 0.03 0.04 0.03
SD 0.03 0.06 0.08 0.02 0.01 0 0.01 0.02 0.03 0.02 0.02 0.03 0.05 0.03 0.03
CV (%) 2.17 3.98 4.91 0.64 0.25 0.06 2.85 5.12 6.48 6.11 4.43 9.94 49.88 34.35 51.49
Table 2. Descriptive statistics of soil bulk density (BD), soil particle density (PD), total soil porosity (TP), field capacity (FC) and macroporosity (Mac), with values of mean, maximum (Max), minimum (Min), standard deviation (SD) and coefficient of variation (CV) of experimental sugarcane fields on a Rhodic Eutrudox, where one manual harvest (1ManH), one mechanized harvest (1MH) and three mechanized harvests (3MH) were performed
in the surface layer for the three areas, while compaction in the remaining soil layers would be more pronounced in the experimental area where heavier machinery (sugarcane harvesters) was used more often.
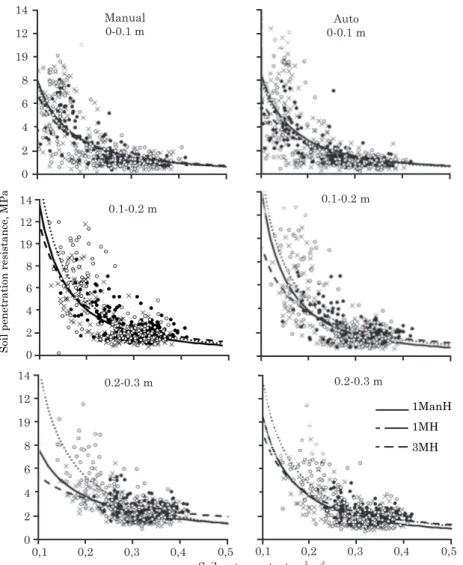
Observing PR data correlated to θ, it was found
that the curves (Figure 2) were different for each harvesting system, especially in deeper layers, where a more compacted layer was detected. In the surface layer (0.0-0.1 m), it is difficult to distinguish the three areas by the PR curves. However, in the deeper soil layers, it becomes distinguishable, and PR values at the lowest θ (0.10-0.30 m3 m-3) occur in the order 3MH > 1ManH > 1MH, while at higher θ this order
is rearranged to 1MH > 3MH > 1ManH. This behavior was observed for both modes, “Manual” and “Auto”. PR subsurface values were mostly above 2 MPa in all areas. Although many studies consider the value of 2 MPa proposed by Taylor et al. (1966) as critical for root development, Dexter (1986) reports that a critical PR for a crop can change according to θ, since root
elongation depends on tension differences between soil and θ. Thus, because it is more difficult for
water-stressed plants to generate tensions that exceed the
soil matrix, the difference between harvesting systems is most pronounced at lower θ. Minor R2 values found in 1MH (Table 3) showed low representativity of the fitted model, making it impossible to accurately compare this area to others, since misleading conclusions would be generated. Based on the differences between 1ManH and 3MH, conclusions with greater scientific precision could be drawn, since aside from the similarity of the R2 values, the response of PR data was exponential in both cases.
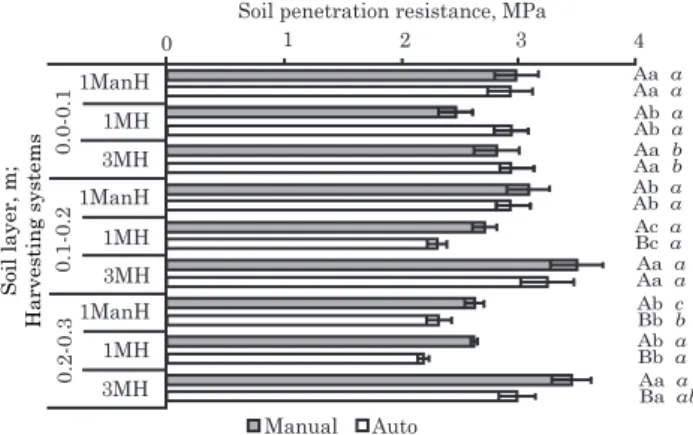
Given the corPR values obtained from data modeling for each soil layer, based on θ field values,
differences were found by mean confidence intervals (Figure 3). The results show that, although the behavior before and after modeling was similar, the error decrease of fitted model contributed to a decreased mean confidence interval (Figures 1 and 3), which allowed better distinction between experimental areas. Thus, the uniformity of modeled data facilitates interpretations, makes differences between areas more distinct, and permits corPR ordering in 1MH < 1ManH = 3MH at surface layer (0.0-0.1 m) and 1MH = 1ManH < 3MH in subsurface layers. Currently, researchers seek to perform PR measurements in a short time, to avoid interferences of θ with the evaluation of agricultural soil compaction.
However, the results of this experiment showed that the harvesting system may interfere with θ, even
where other properties (particle size distribution, OC, BD and TP) are similar. This influence on PR demonstrates the need for θ measurements in this
type of study in order to compare different harvesting systems.
Methods comparison for PR assessment
Some significant differences (p<0.05) can be observed between measurements with and without speed control of rod insertion (“Auto” and “Manual”) (Figures 1 and 3) and were most evident in the subsurface layers, for both measured and modeled data. These differences can be assessed by comparing the linear regression between the different modes of introduction of the penetrometer rod and its deviation from the 1:1 line, which is an indicator of data equality (Figure 4).
At lower PR values (under 2 MPa), the dispersion was minor (Figure 4). Knowing that PR is higher at lower θ, larger PR differences were also found between
rod introduction modes with decreasing θ. Cohesion
increases proportionally during drying of clayey soils, causing cohesion of solid particles which, together with the reduced lubricant water film covering the particles, increases the frictional force between penetrometer cone and soil. In the “Manual” mode, as PR increases, it becomes difficult to maintain a constant speed and a perpendicular position to the soil during rod insertion. This raises the friction between soil and rod, since the movement is not constant and in the same direction, causing soil-rod Soil penetration resistance, MPa
Soil layer, m;
Harvesting systems
1ManH
0 1 2 3 4
Aa ab
Aa a
Ab a
Ab a
Aab b
Aab a
Aab a
Aa a
Ab a
Bb a
Aa a
Aa a
Ab b
Bb b
Ab a
Bb a
Aa a
Ba a 1MH
3MH
3MH 1ManH
1MH
3MH
0.2-0.3
0.1-0.2
0.0-0.1
1MH 1ManH
Manual Auto
Figure 1. Mean values of soil penetration resistance (PR) data, obtained with penetrometer rod introduction by hand (Manual) and by automated force (Auto), compared without correlation to soil water content (θθθθθ), using the mean confidence
Layer
Parameter
1ManH 1MH 3MH
a b R2 a b R2 a b R2
m “Auto”
0.0-0.1 0.2412 -1.5353 0.40 0.2822 -1.3421 0.51 0.2109 -1.5693 0.46
0.1-0.2 0.1910 -1.8692 0.53 0.4398 -1.3278 0.36 0.2731 -1.7633 0.53
0.2-0.3 0.3168 -1.5199 0.45 0.5269 -1.2340 0.24 0.3998 -1.5278 0.48
“Manual”
0.0-0.1 0.2820 -1.4556 0.47 0.3391 -1.3056 0.51 0.2729 -1.4495 0.48
0.1-0.2 0.2874 -1.6641 0.55 0.4846 -1.3783 0.41 0.3406 -1.6657 0.54
0.2-0.3 0.6654 -1.0580 0.41 1.2725 -0.6292 0.10 0.5140 -1.4498 0.54
Table 3. Modeling equation parameters used to correlate soil penetration resistance (PR) to soil water content (θθθθθ) at different depths of experimental sugarcane fields on a Rhodic Eutrudox, where one hand
harvest (1ManH), one mechanized harvest (1MH), and three mechanized harvests (3MH) were performed. The PR data are listed according to the penetrometer insertion mode: manually inserted (Manual) - upper rows and automated insertion (Auto) - bottom rows
Soil water content, m m3 -3 14
12
19
8
6
4
2
0
14
12
19
8
6
4
2
0
14
12
19
8
6
4
2
0
0.2-0.3 m 0.1-0.2 m Manual 0-0.1 m
Auto 0-0.1 m
0.2-0.3 m
0,1 0,2 0,3 0,4 0,5 0,1 0,2 0,3 0,4 0,5
1ManH
1MH
3MH
0.1-0.2 m
Soil penetration resistance, MPa
Figure 2. Correlation between soil penetration resistance (PR) and soil water content (θθθθθ) at different depths
of experimental sugarcane fields on a Rhodic Eutrudox, where one manual harvest (1ManH), one mechanized harvest (1MH), and three mechanized harvests (3MH) were performed. PR data obtained with penetrometer rod insertion by hand (Manual) on the left and by automated force (Auto) on the right.
contact on the wall of the hole formed by the insertion. When the speed is constant and the equipment is placed perpendicularly to the soil and without oscillation, the soil-rod contact is minimized, reducing variability in PR data (Herrick & Jones, 2002).
Since, observing the 1:1 line (Figure 4), PR values in the “Manual” mode were generally higher than by the “Auto” mode, a paired t test was performed. Results corroborate the 1:1 line, and the difference was highly significant (p<0.001) for almost all soil layers (Figure 5). So, the oscillation in rod penetration speed and the inconstant contact between soil and rod caused significant increases in the PR “Manual” readings. This is a response to the structural condition of the soil and, although the interest is to measure the pressure required to insert only the conical tip of the penetrometer, the frictional force along the rod may represent an additional influence. This effect can be avoided by taking some precautions. There are studies that aim to reduce systematic errors in PR measurement, as the ones of Armbruster et al. (1990) and Barone & Faugno (1996), which installed transducers directly on the cone and found a PR decrease of up to 40 %, attributing this difference to the unmeasured friction force between soil and penetrometer rod. Bengough et al. (1997) measured PR with a rotating rod penetrometer and observed significant differences between PR measurements with and without rod rotation. They claimed that rotation changes the vector orientation of frictional resistance in perpendicular direction to the rod axis, decreasing PR values compared with those obtained without rod rotation.
Soil layer, m;
Harvesting systems 1ManH 0 1MH 3MH 3MH 1ManH 1MH 3MH 0.2-0.3 0.1-0.2 0.0-0.1 1MH 1ManH
Soil penetration resistance, MPa
1 2 3 4
Manual Auto
Aaa Aaa Ab a Ab a Aa b Aa b Ab a Ab a Ac a Bc a Aa a Aa a Abc Bbb Ab a Bb a Aaa Baab
Figure 3. Mean values of soil penetration resistance (PR) data, obtained with penetrometer rod introduction by hand (Manual) and by automated force (Auto), compared after correlation with soil water content (θθθθθ), using the mean confidence
interval of experimental sugarcane fields on a Rhodic Eutrudox, where one manual harvest (1ManH), one mechanized harvest (1MH) and three mechanized harvests (3MH) were performed. Bars followed by the same capital letters do not differ significantly (p<0.05) between the insertion modes of the penetrometer rod in the same experimental area and soil layer; bars followed by the same lowercase letters do not differ significantly (p<0.05) between harvesting systems in the same soil layer and rod insertion mode; bars followed by the same lowercase letter in italics do not differ significantly (p<0.05) between the soil layers of the same harvesting system and rod insertion mode.
0 2 4
14 12 10 8 6 4 2 0
6 8 10 12 14
1:1
Manual vs Auto
Soil penetration resistance, MPa Manual mode
auto PR = 0.1360*** + 0.8492*** manual PR R = 0.67***2
Soil penetration resistance, MPa
Auto mode
Figure 4. 1:1 correlation line and fitted equation obtained by linear regression of correlating soil penetration resistance (PR) measured by hand “Manual” (independent variable) with that measured by automated force “Auto” (dependent variable), in the 0.0-0.3 m soil layer of three experimental areas on a Rhodic Eutrudox. Significance of linear regression parameters: ** and ***: significant at p<0.01 and p<0.001, respectively.
Manual Auto
Soil layer, m;
Harvesting systems 1ManH 0 1MH 3MH 3MH 1ManH 1MH 3MH 0.2-0.3 0.1-0.2 0.0-0.1 1MH 1ManH a a a b a b a b a b a b a a a b a b Soil penetration resistance, MPa
1 2 3 4
However, these researchers admit the difficulty in the development and assembly of these penetrometers. Therefore, simpler techniques are preferable and can be used to obtain satisfactory results. In this work, only with controlled penetration speed, the PR values of “Auto” mode were 11.5 % lower than the “Manual”, considering a general mean for all soil layers and without θ modeling. Adjusting corPR
values so that θ was equivalent to FC (0.35 m3 m-3), the difference between the modes tended towards zero. However, by adjusting corPR so that θ was equivalent
to a minimum value measured in situ (0.10 m3 m-3), reached after one rainless week, the “Manual” had a 36.4 % higher mean value than the “Auto” mode.
CONCLUSIONS
1. The correction of soil penetration resistance values according to water content in the soil interferes with the accuracy of penetrometry and its applicability in the evaluation of soil compaction.
2. The insertion mode of the penetrometer rod into the soil affects the results of soil penetration resistance, with overestimation of the values measured by the “Manual” mode in comparison to the “Auto” mode.
3. The difference between the “Manual” and “Auto” modes was directly proportional to the water content in the soil, so that the drier the soil, the greater was the difference between the two modes.
ACKNOWLEDGEMENTS
The authors wish to thank the Fundação de Amparo a Pesquisa do Estado de São Paulo (FAPESP) for funding and supporting this research and the Agência Paulista de Tecnologia dos Agronegócios (APTA), Pólo Centro-Sul, for granting access to the experimental areas, and Patrick Connerton for revising the English text.
LITERATURE CITED
ANDERSON, J.M. & INGRAM, J.S.I. Tropical soil biology and fertility: a handbook of methods. Wallingford, CAB International, 1992. 171p.
ARMBRUSTER, K.; HERTWIG, A. & KUTZBACH, H.D. An improved design of cone penetrometer. J. Agric. Eng. Res., 46:219-222, 1990.
ARSHAD, M.A; LOWERY, B. & GROSSMAN, B. Physical tests for monitoring soil quality. In: DORAN, J.W. & JONES, A.J., eds. Methods for assessing soil quality.
Madison, Soil Science Society of America, 1996. p.123-141. (SSSA Special publication, 49)
ASSIS, R.L.; LAZARINI, G.D.; LANÇAS, K.P. & CARGNELUTTI FILHO, A. Avaliação da resistência do solo à penetração em diferentes solos com a variação do teor de água. Eng. Agric., 29:558-568, 2009.
AYERS, P.D. & PERUMPRAL, J.V. Moisture and density effect on cone index. Trans. ASABE, 25:1169-1172, 1982. BALL, B.C. & HUNTER, R. The determination of water release
characteristics of soil cores at low suctions. Geoderma, 43:195-212, 1988.
BANGITA, B. & RAO, B. K. R. Impacts of compaction relief treatments on soil physical properties and performance of sugarcane (Saccharum spp.) under zonal tillage system. Geoderma, 189: 351-356, 2012.
BARONE, L. & FAUGNO, S. Penetration tests for measurement of soil strength: assessment of the contribution of shaft friction. J. Agric. Eng. Res., 64:103-108, 1996
BENGOUGH, A.G.; MULLINS, C. E. & WILSON, G. Estimating soil frictional resistance to metal probes and its relevance to the penetration of soil by roots. Eur. J. Soil Sci., 48:603-612, 1997.
BERNADIER, C.R.; ROSS, S.J. & GROSSMAN, R.B. Soil water capacity prediction.Geoderma, 49:77-81, 1991.
BEUTLER, A.N.; CENTURION, J.F. & SILVA, A.P. Comparação de penetrômetros na avaliação da compactação de Latossolos. Eng. Agric., 27:146-151, 2007.
BLAINSKI, E.; TORMENA, C.A.; FIDALSKI, J. & GUIMARAES, R.M.L. Quantificação da degradação física do solo por meio da curva de resistência do solo à penetração. R. Bras. Ci. Solo, 32:975-983, 2008.
BLANCO-SEPULVEDA, R. La relación entre la densidad aparente y la resistencia mecánica como indicadores de la compactación del suelo. Agrociencia, 43:231-239, 2009 BORTOLUZZI, E.C. & ELTZ, F. L.F. Efeito do manejo mecânico da palhada de aveia preta sobre a cobertura, temperatura, teor de água no solo e emergência da soja em sistema plantio direto. R. Bras. Ci. Solo, 24:449-457, 2000. BUSSCHER, W.J. & SOJKA, R.E. Enhancement of subsoiling
effect on soil strength by conservation tillage. Trans. ASAE, 30:888-892, 1987.
BUSSCHER, W.J. Adjustment of flat-tipped penetrometer resistance data to a common water content. Trans. ASABE, 3:519-524, 1990.
BUSSCHER, W.J.; BAUER, P.J.; CAMP, C.R. & SOJKA, R.E. Correction of cone index for soil water content differences in a coastal plain soil.Soil Till. Res., 43:205-217, 1997. BUSSCHER, W.J. & BAUER, P.J. Soil strength, cotton root
growth and lint yield in a southeastern USA coastal loamy sand. Soil Till. Res., 74:151-159, 2003.
CARRARA, M.; CASTRIGNANÒ, A.; COMPARETTI, A.; FEBO, P. & ORLANDO, S. Mapping of penetrometer resistance in relation to tractor traffic using multivariate geostatistics. Geoderma, 142:294-307, 2007.
CEDDIA, M.B.; ANJOS, L.H.C.; LIMA, E.; RAVELLI NETO, A. & SILVA, L.A. Sistemas de colheita de cana-de-açúcar e alterações nas propriedades físicas de um solo Podzólico Amarelo no estado do Espírito Santo. Pesq. Agropec. Bras., 34:1467-1473, 1999.
COMPANHIA NACIONAL DE ABASTECIMENTO - CONAB. Acompanhamento da safra brasileira de cana-de-açúcar 2012/2013: primeiro levantamento. Brasília, 2012. COSTA, M.A.T. TORMENA, C.A.; LUGÃO, S.M.B.;
FIDALSKI, J.; NASCIMENTO, W.G. & MEDEIROS, F.M. Resistência do solo à penetração e produção de raízes e de forragem em diferentes níveis de intensificação do pastejo. R. Bras. Ci. Solo, 36:993-1004, 2012.
CUNHA, J.P.A.R. Resistência mecânica do solo a penetração sob diferentes densidades e teores de água. Eng. Agric., 10:1-7, 2002.
DEXTER, A.R. Mechanics of root growth. Plant Soil, 98:303-312, 1987.
EMPRESA BRASILEIRA DE PESQUISA AGROPECUÁRIA - EMBRAPA. Sistema brasileiro de classificação de solos. 2.ed. Rio de Janeiro, Embrapa Solos, 2006. 306p. FIGUEIREDO, G.C. Avanços metodológicos e instrumentais
em física do solo. Piracicaba, Escola Superior de Agricultura “Luiz de Queiroz”, 2010. 163p. (Tese de Doutorado)
FIGUEIREDO, G.C.; SILVA, A.P.; TORMENA, C.A.; GIAROLA, N.F.B.; MORAES, S.O. & ALMEIDA, B.G. Improvement of a testing apparatus for dynamometry: procedures for penetrometry and influence of strain rate to quantify the tensile strength of soil aggregates. R. Bras. Ci. Solo, 35:373-387, 2011.
GROSSMAN, R.B. & REINSCH, T.G. Bulk density and linear extensibility. In: DANE, J.H. & TOPP G.C., eds. Methods of Soil Analysis, IV. Physical Methods. Madison, Soil Science Society of America, 2002. p.201-225.
HENDERSON, C.; LEVETT, A. & LISLE, D. The effects of soil water content and bulk density on the compactibility and soil penetration resistance of some western Australian sandy soils. Aust. J. Soil Res., 26:391-400, 1988.
HENDERSON, C.W.L. Using a penetrometer to predict the effects of soil compaction on the growth an yield of wheat on uniform, sandy soils. Aust. J. Agric. Res., 40:497-508, 1989.
HERRICK, J.E. & JONES, T.L. A dynamic cone penetrometer for measuring soil penetration resistance. Soil Sci. Soc. Am. J., 66:1320-4, 2002.
IMHOFF, S.; SILVA, A.P.; DIAS JUNIOR, M.S. & TORMENA, C.A. Quantificação de pressões críticas para o crescimento das plantas. R. Bras. Ci. Solo, 25:11-18, 2001.
JORAJURIA, D. & DRAGHI, L. The distribution of soil compaction with depth and the response of a perennial forage crop. J. Agric. Eng. Res., 66:261-265, 1997. KOCH, H.J.; HEUER, H.; TOMANOVÁ, O. & MÄRLÄNDER,
B. Cumulative effect of annually repeated passes of heavy agricultural machinery on soil structural properties and sugar beet yield under two tillage systems. Soil Till. Res., 101:69-77, 2008.
LIBARDI, P.L. Dinâmica da água no solo. Piracicaba: EDUSP, 2005. 335p.
MEDEIROS, J.C.; SILVA, A.P.; CERRI, C.E.P.; GIAROLA, N.F.B.; FIGUEIREDO, G.C. & FRACETTO, F.J.C. Linking physical quality and CO2 emissions under
long-term no-till and conventional-till in a subtropical soil in Brazil. Plant Soil, 338:5-15, 2011.
MEDEIROS, J.C.; FIGUEIREDO, G.C.; MAFRA, A.L.; ROSA, J.D. & YOON, S.W. Deep subsoiling of a subsurface-compacted typical Hapludult under citrus orchard. R. Bras. Ci. Solo, 37:911-919, 2013.
MIRREH, H. F. & KETCHESON, J. W. Influence of soil bulk density and matric pressure on soil resistance to penetration. Can. J. Soil Sci., 52:477-483, 1972. OLIVEIRA, V.S.; ROLIN, M.M.; VASCONCELOS, F.B.;
COSTA, Y.D.J. & PEDROSA, E.M.R. Compactação de um Argissolo Amarelo distrocoeso submetido a diferentes manejos. R. Bras. Eng. Agrí. Amb., 14: 914-920, 2010. OLIVEIRA, M.P.; TAVARES, M.H.F.; URIBE-OPAZO, M.A. &
TIMM, L.C. Selecting statistical models to study the relationship between soybean yield and soil physical properties. R. Bras. Ci. Solo, 35:97-104, 2011.
OTTO, R.; SILVA, A.P.; FRANCO, H.C.J.; OLIVEIRA, E.C.A. & TRIVELIN, P.C.O. High soil penetration resistance reduces sugarcane root system development. Soil Till. Res., 117:201-210, 2011.
PAULINO, A.F.; MEDINA, C.C.; AZEVEDO, C.B.; SILVEIRA, K.R.P.; TREVISAN, A.A. & MURATA, I.M. Escarificação de um Latossolo Vermelho na pós-colheita de soqueira de cana-de-açúcar. R. Bras. Ci. Solo, 28:911-917, 2004. PAYTON, M.E; MILLER, A.E. & RAUN, W.R. Testing statistical
hypotheses using standard error bars and confidence intervals. Commun. Soil Sci. Plant Anal., 31:547-551, 2000. PERUMPRAL, J.V. Cone penetrometer: a review. Trans.
ASABE, 30:939-944, 1987.
R DEVELOPMENT CORE TEAM. R: a language and environment for statistical computing. Vienna: R Foundation for Statistical Computing. 2011. Available: <http://www.R-project.org>.
REICHARDT, K. & TIMM, L.C. Solo, planta e atmosfera. Conceitos, processos e aplicações. Barueri: Manole, 2004. 478p.
SHÄFER-LANDEFELD, L.; BRANDHUBER, R.; FENNER, S.; KOCH, H.J. & STOCKFISCH, N. Effects of agricultural machinery with high axle load on soil properties of normally managed fields. Soil Till. Res., 75:75-86, 2004. SILVA, A.J.N. & CABEDA, M.S.V. Compactação e
compressibilidade do solo sob sistemas de manejo e níveis de umidade. R. Bras. Ci. Solo, 30:921-930, 2006. SMITH, D.L.O. & DICKSON, J.W. Contributions of vehicle
weight and ground pressure to soil compaction. J. Agric. Eng. Res., 46:13-29, 1990.
SOIL SURVEY STAFF. Soil taxonomy: a basic system of soil classification for making and interpreting soil surveys. 2 ed. Natural Resources Conservation Service. U.S. Department of Agriculture Handbook 436, 1999. SOUZA, Z.M.; PRADO, R.M.; PAIXÃO, A.C.S. & CESARIN,
L.G. Sistemas de colheita e manejo da palhada de cana-de-açúcar. Pesq. Agropec. Bras., 40:271-278, 2005. SOUZA, Z.M., MARQUES JÚNIOR, J.; COOPER, M. &
PEREIRA, G.T. Micromorfologia do solo e sua relação com atributos físicos e hídricos. Pesq. Agropec. Bras., 41:487-492, 2006.
SOUZA, Z.M.; MARQUES JÚNIOR, J. & PEREIRA, G.T. Geoestatística e atributos do solo em áreas cultivadas com cana-de-açúcar. Ci. Rural, 40:48-56, 2010.
SUN., Y.; LIN, J.; M.A, D.; ZENG, Q. & SCHULZE, P.L. Measurement of penetration force using a Hall-current-sensor. Soil Till. Res., 92:264-268, 2006.
TAYLOR, H.M.; ROBERSON, G.M. & PARKER JR., J.J. Soil strength-root penetration relations to medium to coarse-textured soil materials. Soil Sci. 102:18-22, 1966. VEPRASKAS, M.J. Cone index of loamy sands as influenced
by pore size distribution and effective stress. Soil Sci. Soc. Am. J., 48:1220-1225, 1984.
VOMOCIL, J.A. Porosity. In: BLACK, C.A., ed. Methods of soil analysis: physical and mineralogical properties, including statistics of measurement and sampling. Madison: American Society of Agronomy, 1965. Part 1, p.499-510. WARRICK, A.W. Spatial variability. In: HILLEL, D., ed. Environmental soil physics. New York: Academic Press, 1998. p. 655-675.
WHALLEY, W.R.; WATTS, C.W.; GREGORY, A.S.; MOONEY, S.J.; CLARK, L.J. & WHITMORE, A.P. The effect of soil strength on the yield of wheat. Plant Soil, 306:237-247, 2008.