ISSN: 1809-4430 (on-line)
_________________________
1 Engº Agrônomo, Mestre, Programa de Pós Graduação em Agricultura Tropical, Universidade Federal de Mato Grosso/Cuiabá-MT, Fone: (65) 3615-8618, [email protected]
2 Engº Agrônomo, Prof. Doutor, Departamento de Solos e Engenharia Rural, Universidade Federal de Mato Grosso/Cuiabá-MT, [email protected]
3 Engº Agrônomo, Consultor, Empresa Base Precisão/Tangará da Serra - M T, [email protected]
MODELING AND CORRECTION OF SOIL PENETRATION RESISTANCE FOR VARIATIONS IN SOIL MOISTURE AND SOIL BULK DENSITY
Doi:http://dx.doi.org/10.1590/1809-4430-Eng.Agric.v36n3p 449-459/2016
WININTON M. DA SILVA1, ALOÍSIO BIANCHINI2, CESAR A. DA CUNHA3
ABSTRACT: This study aimed to describe the behavior of models for adjusting data of soil penetration resistance for variations in soil moisture and soil bulk density. The study was carried out in Lucas do Rio Verde, MT, Brazil in a typic dystrophic red-yellow Latosol (Oxisol) containing
0.366 kg kg−1 of clay. Soil penetration resistance measurements were conducted in the soil
moistures of 0.33 kg kg−1, 0.28 kg kg−1, 0.25 kg kg−1 and 0.22 kg kg−1. Soil penetration resistance
behavior due to variations in soil moisture and soil bulk density was assessed by estimating the soil resistance values by non-linear models. There was an increase of the soil penetration resistance values as soil was losing moisture. For the same edaphic condition studied, small differences in the data of soil bulk density affect differently the response of soil resistance as a function of moisture. Both soil bulk density and soil moisture are essential attributes to explain the variatio ns in soil penetration resistance in the field. The good representation of the critical soil bulk density curve as a limiting compression indicator requires the proper choice of the restrictive soil resistance value for each crop.
KEY WORDS: soil compaction, pedotransfer functions, cone index.
MODELAGEM E CORREÇÃO DA RESISTÊNCIA DO SOLO À PENETRAÇÃO PARA VARIAÇÕES NA UMIDADE E DENSIDADE DO SOLO
RESUMO: O presente trabalho buscou descrever o comportamento de modelos para ajustes dos dados de resistência do solo à penetração para variações na umidade e na densidade do solo. O trabalho foi realizado no município de Lucas do Rio Verde-MT, em Latossolo Vermelho-Amarelo
distrófico típico contendo 0,366 kg kg-1 argila. As determinações da resistência do solo à penetração
ocorreram nas umidades de solo de 0,33 kg kg-1, 0,28 kg kg-1, 0,25 kg kg-1, 0,22 kg kg-1. O
comportamento da resistência do solo à penetração, em função de variações na umidade e densidade do solo, foi avaliado pela estimativa nos valores de resistência do solo por modelos não lineares. Houve aumento dos valores de resistência do solo à penetração, à medida que o solo foi perdendo umidade. Para uma mesma condição edáfica estudada, pequenas variações nos dados de densidade do solo afetam diferentemente a resposta da resistência do solo em função da umidade. A densidade do solo é atributo imprescindível para explicar as variações na resistência do solo à penetração em campo, tanto quando a umidade do solo. A boa representação da curva de densidade crítica do solo como indicador de compactação limitante requer a escolha adequada do valor de resistência do solo restritivo para cada cultura.
PALAVRAS - CHAVE: compactação do solo, funções de pedotransferência, índice de cone.
INTRODUCTION
such as those of BIANCHINI et al. (2002) have demonstrated the use of penetrometer as a practical and reliable way to characterize the soil compaction and estimate the resistance it offers to the growth of plant roots.
However, as postulated by SILVA et al. (2008), there is a great variability of soil penetration resistance (SPR) for a given degree of compaction or coincidence of values for different degrees of compaction. This variability of SPR in field is linked to several controlling variables, which, as described by the review study of MORAES et al. (2014a), include soil bulk density (OTTO et al., 2011), soil water content (ASSIS et al., 2009; MORAES et al., 2012), water pressure in the pores (KIM et al., 2008), particle size distribution (VAZ et al., 2011), clay content (MOLIN et al., 2006), and soil-metal friction (DEXTER et al., 2007).
Penetrometer use difficulty has been mainly observed when defining whether the SPR is a limiting factor or not to crop growth. There are cases in which these determinations, when conducted in soil with low water content, result in values higher than 2 MPa, which is a value commonly accepted as critical to crops development (TORMENA et al., 1998) in a non-compacted soil. VAZ et al. (2002) recommend measuring soil moisture along with penetration resistance and then applying certain corrections or normalization to a reference value of soil water content. This procedure is important to reduce misinterpretation of results obtained in different field conditions and soil management systems (BUSSCHER et al., 1997).
Among the mathematical models developed for estimating or correcting SPR, the one
described by MIRRED & KETCHESON (1972) relates soil bulk density (Mg m−3) and matric
potential (MPa) as main controlling variables. However, the simplified nonlinear model used by BUSSCHER & SOJKA (1987) and tested by BUSSCHER (1990), relating soil bulk density and gravimetric moisture as SPR controlling variables, is currently the most used to represent such relationship (TORMENA et al., 1998; CHEN et al., 2014; GONÇALVES et al., 2014; MOREIRA et al., 2014b).
Mathematical models of prediction and correction of soil penetration resistance values that limit plant development are major tools for decision making in soil management (BETIOLI JÚNIOR et al., 2012; MORAES et al., 2014b). It happens mainly because direct SPR determinations without any variable control are not able to assess critical compaction conditions that are plant growth limiting. Knowing the influence degree of soil bulk density and moisture on SPR can facilitate data sampling and processing at various soil use and management conditions.
In this study, the penetration resistance data fit models according to variations in soil moisture and bulk density was evaluated, simulating spatial variability of soil attributes applied to this model.
MATERIAL AND METHODS
The study was conducted in Lucas do Rio Verde - MT, Brazil, at the experimental farm of the
Fundação Lucas do Rio Verde (12º 59’S, 55º 57’W, altitude of 392 m). The experiment was carried
out between July and August of 2010, throughout a minimum rainfall period, making it easier to control soil water content. Local soil was classified as a typic dystrophic Red-yellow Latosol
(Oxisol) (EMBRAPA, 2013) with sandy clayey texture, containing 366.4 g kg−1 of clay, being
slightly plastic and sticky, and with a granular structure.
We used a completely randomized experimental design with 12 replications. Treatments consisted of four levels of soil water content, making up 100%, 85%, 75% and 65% of field
capacity. We assessed soil penetration resistance (SPR), volumetric soil moisture (θ) and soil bulk
density (BD). For the experiments, within the center of an 84 m2 area, we delimited a 48 m2 area
that was divided into 12 sites of 4 m2. The area was grown with soybean under no-tillage system in
the last five years prior to the experiment. On the occasion of the experiment, land was in fallow
covered by grasses, especially finger-grass (Digitaria spp.).
homogeneous irrigation, saturating soil layer from 0 to 0.2 m. For that, calculations of the required amount of water were made using the methodology adopted by BERNARDO (1986). After soil saturation, the area was covered with a plastic canvas to prevent evaporation and allowing a better water distribution within the studied layer.
Data sampling was restricted to a soil layer between 80 and 130 mm depth, for all the variables, since it is less susceptible to large soil moisture fluctuations. This choice was made following the methodology adapted by TORRES & HAIL (1999).
Water drainage monitoring was made by collection of deformed samples taken daily to determine soil moisture (Mg) through standard gravimetric method, as proposed by EMBRAPA (2011). The samples were taken from day to day until variation was lower than 1%, reaching thus soil field capacity (FC), as described by REICHARDT (1988). Afterwards, gravimetric moisture
data were converted into volumetric water content (θ), using the soil bulk density of each site
sampled. In turn, soil bulk density (BD) was estimated by method proposed by EMBRAPA (2011),
using undisturbed samples collected at a depth range of 80–130 mm within each plot central part.
The first SPR experiments for water content at FC were collected at distances of 1 m, with three repetitions, surrounding BD collecting point. Concomitantly, deformed samples were taken
for determination of θ. The SPR experiments were performed in a depth range of 0.00 to 200 mm,
by using an electronic penetrograph with constant speed developed by BIANCHINI et al. (2002). After data collecting, we made sure that soil loses moisture up to reaching 85% of FC, within
the pre-established layer (80–130 mm). Soil samples were taken every 12 hours for monitoring.
When soil moisture reached values close to 85% of FC, it was again covered for a minimum period of 24 hours, aiming to balance soil moisture in this layer. Then, SPR experiments and soil sampling
were simultaneously carried out for the determination of θ. In this way, we proceeded with the other
moisture levels established in the experiment.
Soil penetration resistance curve depends on soil moisture and bulk density variations. The experiment has solely promoted variations on soil moisture, while BD variations derived from
spatial variability in the soil. Thus, in order to study the behavior of SPR curve as function of θ and
BD variations, we fit the sampled data using [eq. (1)] (BUSSCHER, 1990):
e d
cθ Ds
SPR (1)
where,
SPR is the soil penetration resistance (MPa);
θ is the volumetric soil moisture (cm3 cm−3);
BD is the soil bulk density (g cm−3), and
c, d and e are the model parameters.
The model constants c, d and e were calculated by non-linear fits using standard error
Bootstrap estimation through SPSS 20.0 software — Statistical Package for Social Sciences (IBM
Corp., 2011). After obtaining constants, we performed several fits of the SPR data as a function of θ
collected for several variation values of increasing BD (1.0, 1.05, 1.10, 1.15, … , 1.50 Mg m−3) to verify whether BD variability could compromise SPR data fit as a function of θ.
For regression model fits, we applied 36 of the 48 values comprising the sampled data set for each variable, and the remaining 12 values were used to validate the model. Good SPR curve fits were found by SILVA et al. (1994), MOREIRA et al. (2014a) and GUBIANI et al., (2014) by using the equation of BUSSCHER (1990); so that is why we chose it to fit our data.
The constants c, d and e in [eq. (1)] were also used to estimate critical soil bulk density (BDc)
[eq. (2)], proposed by IMHOFF et al. (2000). Since restrictive resistance values vary from 1.5 to 4.0 MPa according to literature data (KLEIN & CAMARA, 2007; MORAES et al., 2014b); we adopted
values of 1.5, 2.0, 2.5,…, 5.0 MPa for this model. Among them, 2 MPa is most commonly accepted
as an impediment to root system growth (TORMENA et al., 1998).
e d
c
1/r
/
θ
)
SPR
(
Dsc
(2)where,
BDc is the critical soil bulk density (Mg m−3);
SPRr is the restrictive soil penetration resistance (MPa);
θ is the volumetric soil moisture (cm3 cm−3), and
c, d and e are the model parameters.
Data underwent Levene and Kolmogorov-Smirnov test to verify variance homogeneity and normal distribution. In sequence, we proceeded a Pearson correlation and regression analyses. The regression models obtained by eqs. (1) and (2) were tested by linearity degree of both observed and estimated data, as well as standardized residual distribution. Fit differentiations with fixed BD and SPR values were performed by identity model tests, using the statistical software package NCSS 4.0 - Number Cruncher Statistical System (HINTZE, 2006).
RESULTS AND DISCUSSION
BD values did not differ with treatments since belonging to a single sample made during the
study period (Table 1). However, BD data have varied between 1.20 to 1.32 Mg m−3, giving a
variation coefficient of 3%, which is low (< 12%) according to the classification proposed by WARRICK & NIELSEN (1980).
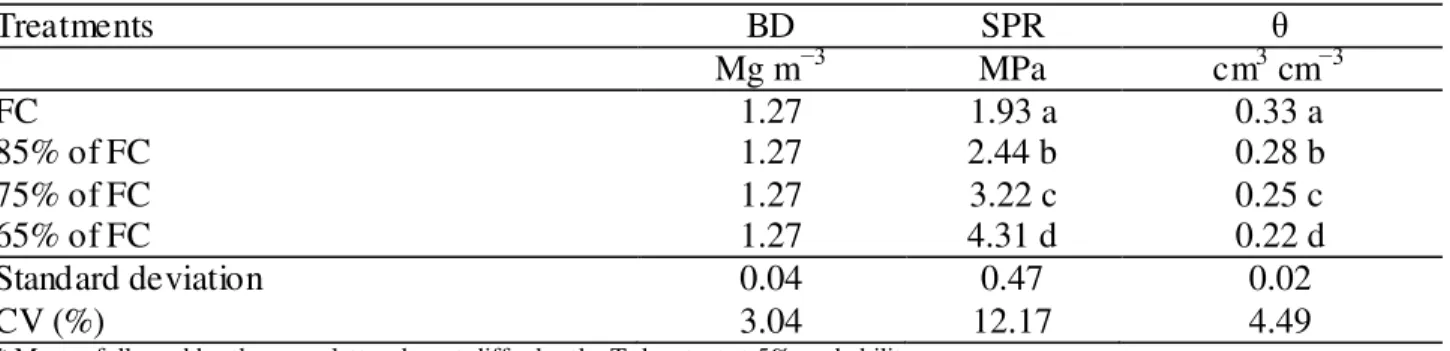
TABLE 1. Soil bulk density, penetration resistance and volumetric moisture in the layer of 80 to 130 mm for each studied soil moisture.
Treatments BD SPR θ
Mg m−3 MPa cm3 cm−3
FC 1.27 1.93 a 0.33 a
85% of FC 1.27 2.44 b 0.28 b
75% of FC 1.27 3.22 c 0.25 c
65% of FC 1.27 4.31 d 0.22 d
Standard deviation 0.04 0.47 0.02
CV (%) 3.04 12.17 4.49
* Means followed by the same letter do not differ by the Tukey test at 5% probability.
Significant differences (p < 0.05) were found between average values of SPR and θ, which
followed a reduction order of soil moisture levels evaluated (FC > 85% of FC > 75% of FC > 65% of FC) for both variables. The results support inferences widely cited in the literature that soil moisture has an effect on SPR determination.
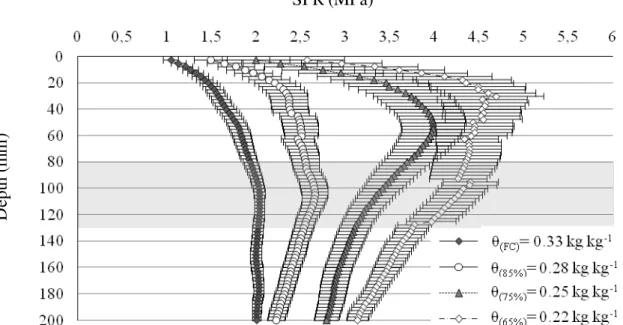
SPR average values increased with θ levels in the evaluated soil profile (Figure 1),
corroborating results of ASSIS et al. (2009) and MORAES et al. (2013) in different soil types. It is
noteworthy mention that not only SPR values varied with soil θ reductions, but also average
SPR (MPa)
D
ept
h (
m
m
)
FIGURE 1. Soil penetration resistance average ± standard error at different volumetric moisture
values within the layer of 0–200 mm.
Similarly, the results also show that the higher soil moisture leads lower variation in the obtained values. This trend can be explained by reductions in soil cohesion and adhesion forces with its increased moisture, besides the water lubricating effect on cone penetration. This inference is confirmed in a study with hydraulic-electronic penetrometer conducted by GUERRA et al. (2000), in which the authors report an influence of water content in SPR determination, demonstrating such lubricating effect on soil, making soil very plastic and facilitating rod penetration. The same authors indicated that compact layers are best detected by taking penetration resistance in soils with low water content.
Following the changes in data and SPR within the layer between 80 to 130 mm, we might observe significant differences among the curves given reductions in soil moisture, according to the average standard error bar, in which average values are different at points where they do not meet. It was noticed that in all SPR curves, data variations decrease and stabilized from a certain depth. These results suggest that at a depth from which variations decrease and stabilize, penetrometer rod exceeds soil drying front and reaches a high-moisture environment, since the drying front moves from surface towards deeper layers inasmuch as supplied water is drained out of soil.
The estimated soil penetration resistance (SPRest) values were obtained by using Equation 3
from fit described in Equation 1. All the fitting coefficients are statistically significant (p < 0.05) concerning the variance analysis of regression. The SPR is positively correlated with BD and
negatively correlated with θ, according to trends obtained by SILVA et al. (1994).
888 . 2 276 . 1 Ds
θ
257 . 0
SPR (3)
Fcalculated = 264.63; p = 0.01; R2 = 0.64; N = 36
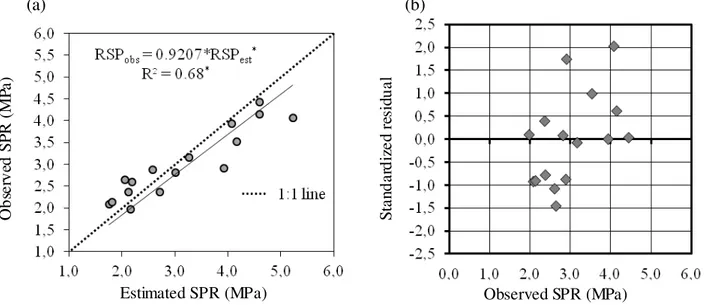
The model validation was performed with 12 values that were not used for the fit obtained in
[eq. (3)]. Thus, the linear fit between observed (SPRobs) and estimated (SPRest) SPR values,
(a) (b)
O
bs
er
ve
d
SP
R
(M
Pa
)
St
an
da
rd
iz
ed
re
si
du
al
Estimated SPR (MPa) Observed SPR (MPa)
FIGURE 2. Regression fit of the soil penetration resistance values observed and estimated by Equation 1 (a) and distribution of the calculated residuals of the difference between the observed SPR values and the estimated values by the Busscher (1990) model for
the different evaluated θ (b).
The standardized residual distribution tended to underestimate and overestimate the SPR values estimated by the BUSSCHER (1990) model. Nonetheless, these trends are within an acceptable limit for model validation according to MONTGOMERY et al. (2004). For these authors, if 95% of the standardized residuals remain between a range of 2 and -2, the model errors are distributed normally and residuals out of this range may indicate presence of outliers, i.e. an unusual observation compared to the remaining data. Yet only one residual value reached 2, being considered the range limit, indicating an acceptable distribution for validation of the proposed model.
When correlated with θ, SPRobs and SPRest had the best fit by the potential model (Figure 3),
corroborating statement postulated by BUSSCHER et al. (1997) who described the potential model as the most appropriate for modeling such relationship. On the other hand, in a study conducted by SILVEIRA et al. (2010), after testing several curves of exponential and potential fitting for the relationship between soil moisture versus penetration resistance, these authors concluded that the exponential model obtained the best admeasurement indexes for this relationship. The same authors described the difficulty of indicating an ideal model to explain a relationship between SPR and soil moisture, once several models are presented as significant when statistically assessed.
(a) (b)
O
bs
er
ve
d S
P
R
(
M
P
a)
E
st
im
at
ed S
P
R
(
M
P
a)
θ (cm3 cm-3) θ (cm3 cm-3)
FIGURE 3. Regression fits of soil penetration resistance (SPR) and soil volumetric moisture (θ) to
In the study carried out by ASSIS et al. (2009) for different soil types, the linear model showed the best statistical parameters to explain a relationship between SPR and soil gravimetric moisture. This condition suggests that a general equation that explains this relationship for various soil types and management conditions requires inclusion of other physical attributes or soil constituent elements, which may have significant influence on this relationship.
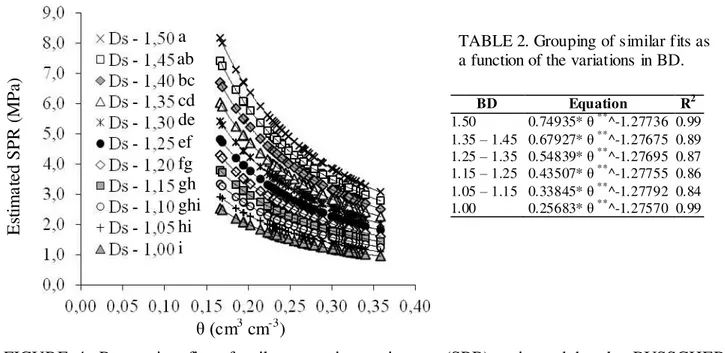
Considering BD as a physical attribute influencing the response of soil penetration resistance, which is dependent on water content (SILVA et al., 2008; PORTZ et al., 2009; JUNIOR et al.,
2014), it was used [eq. (3)] to estimate SPR (MPa) behavior as a function of θ (cm3 cm−3) for
different density values (g cm−3), which are to occur in the studied soil class (Figure 4).
E
st
im
at
ed S
P
R
(
M
P
a)
TABLE 2. Grouping of similar fits as a function of the variations in BD.
BD Equation R2
1.50 0.74935* θ **^-1.27736 0.99
1.35 – 1.45 0.67927* θ **^-1.27675 0.89
1.25 – 1.35 0.54839* θ **^-1.27695 0.87
1.15 – 1.25 0.43507* θ **^-1.27755 0.86
1.05 – 1.15 0.33845* θ **^-1.27792 0.84
1.00 0.25683* θ **^-1.27570 0.99
θ (cm3 cm-3)
FIGURE 4. Regression fits of soil penetration resistance (SPR) estimated by the BUSSCHER
(1990) as a function of the volumetric moisture (θ) between FC and 65% of FC for
different values of soil bulk density (BD) in Mg m−3.
The same letters indicate no significant difference between the models according to identity model tests at 5% probability.
The regression fits demonstrate that the response of SPR as a function of θ is dependent on
soil compaction conditions, expressed as curves for different values of BD. The differentiation of the potential regression fits, carried out by identity model tests, shows similar groups as soil bulk density is increased, according to results of SILVA et al. (2008), who described a great variability in penetration resistance for a given degree of compaction or coincidence of values for different degrees of compaction. The same authors suggested that these relationships occur due to changes in water content stored in the soil. BUSSCHER et al. (1997) described the relationship between SPR and BD as a result of soil structure compaction and degradation.
However, the similar groups found between maximum and minimum adopted values could be represented in a single equation, obtaining significant models and high coefficients of determination
(R2), ensuring certainty in their predicting ability (Table 2).
For the 11 soil bulk density values used in simulations, only six equations were enough to
represent the behavior of SPR in relation to θ variations. The results demonstrate that for a spatial
variability of BD between 1.05 and 1.15 Mg m−3, only one equation allows describing the behavior
of SPR and θ. Conversely, the same equation does not describe with good reliability the behavior of
the variables when BD includes values of 1 Mg m−3. Likewise, different equations should be used to
describe the behavior of SPR for ranges of BD between 1.15 and 1.25 Mg m−3, 1.25 and 1.35 Mg
m−3, 1.35 and 1.45 Mg m−3, and for values of 1.50 Mg m−3. This result implies that for SPR
modeling, spatial variability of BD has to be controlled, since commonly only soil moisture is monitored for each sample condition in the field. The results obtained for the studied soil suggests
great variations in BD may require more than one model to explain SPR behavior as a function of θ,
which makes BD an important attribute to be sampled in the field.
This influence of BD in modeling SPR and θ in compacted soils was also mentioned by
WHALLEY et al. (2005), who studied the effect of this active stress based on models proposed by DEXTER et al. (2007) to predict penetration resistance in unsaturated agricultural soils. The authors reported that active stress can be used by itself in SPR prediction in soils with low densities, but not for high-density soils.
With regards to BD variations found in this study (Table 1), we understood that two models
would be necessary to describe more accurately a limiting soil penetration resistance (SPRL) as a
function of θ values. In this case, there would be the need for setting two groups: one for BD values
between 1.15 and 1.25 Mg m−3 and another for values between 1.25 to 1.32 Mg m−3, according to
the combined model groups presented in Table 2.
The BDc values, obtained from fit described in [eq. (2)], were calc ulated by [eq. (4)]. It was
considered the same values for the parameters a, b and c of [eq. (3)], since [eq. (4)] is its
modification.
888 . 2 / 1 276 . 1 r
/
0
.
257
θ
)
SPR
(
Dsc
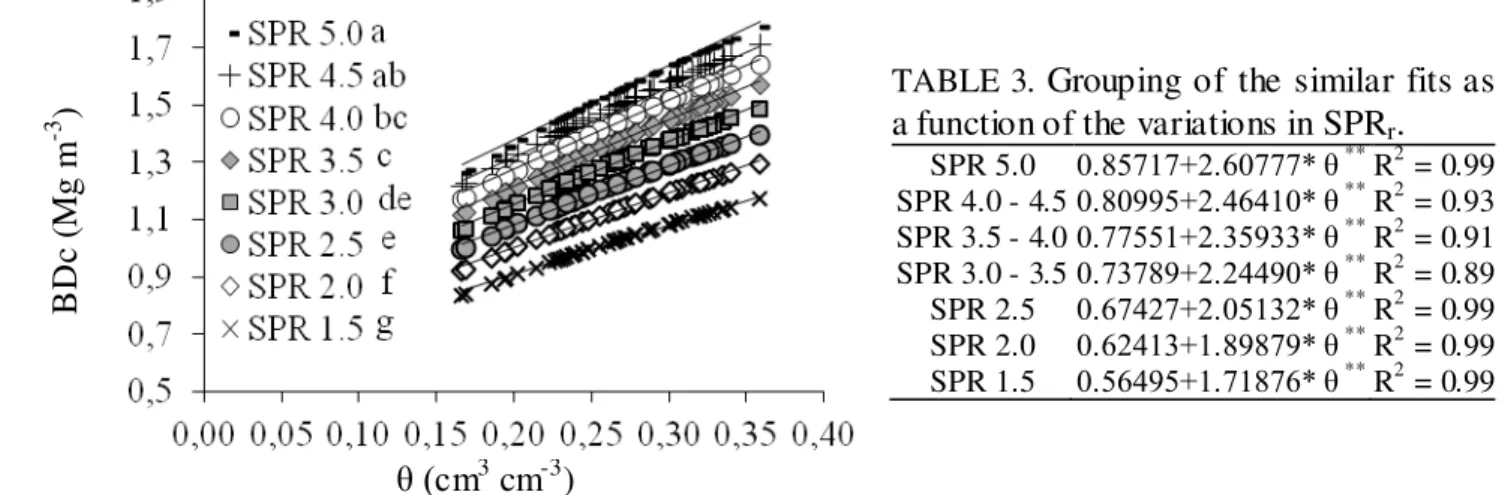
(4)With [eq. (4)], we obtained the BDc curve fittings as a function of θ for different fixed values
of restrictive soil penetration resistance (SPRr) to root development (Figure 5). Overall, we noted for all fittings that as moisture increases, higher BDc values are admitted for a same SPRr, corroborating results obtained by IMHOFF et al. (2000).
B
D
c (
M
g m
-3 )
TABLE 3. Grouping of the similar fits as
a function of the variations in SPRr.
SPR 5.0 0.85717+2.60777* θ ** R2 = 0.99
SPR 4.0 - 4.5 0.80995+2.46410* θ ** R2 = 0.93
SPR 3.5 - 4.0 0.77551+2.35933* θ ** R2 = 0.91
SPR 3.0 - 3.5 0.73789+2.24490* θ ** R2 = 0.89
SPR 2.5 0.67427+2.05132* θ ** R2 = 0.99
SPR 2.0 0.62413+1.89879* θ ** R2 = 0.99
SPR 1.5 0.56495+1.71876* θ ** R2 = 0.99
θ (cm3 cm-3)
FIGURE 5. Regression fit of critical soil bulk density estimated by Equation 4 as a function of volumetric moisture between FC and 65% of FC for different values of soil penetration resistance and limiting soil penetration resistance, in MPa.
Equal letters indicate no significant difference between the models according to the identity models test at 5% probability.
The test of identity models used to differentiate BDc has different fits to each SPRL value
between 1.5 and 2.5 MPa (Table 2). Yet for values between 3.0 and 4.5 MPa, these fits of BDc for
the same variation of θ can be combined with the ranges of 3.0–3.5, 3.5–4.0 and 4.0–4.5 MPa. This
indicates that from 3.0 MPa, there is a less influence of SPRr in the responses of BDc.
These results suggest that the choice of the SPRr value presents a great importance in
determinations of BDc, for evaluations of limiting effect of soil compaction on plant growth, since a
slight variation in the value of the adopted SPRr may lead to significantly different responses of
CONCLUSIONS
The modeling showed that the lower soil water content increase the variability of penetration resistance in soil profile.
For the same studied edaphic condition, small variations in the data of soil bulk density affect differently the response of soil resistance as a function of moisture.
Soil bulk density is an essential attribute for modeling soil penetration resistance and, even as the soil moisture, its variation in the field must be controlled for a correct modeling and data interpretation.
The good representation of the critical soil bulk density curve as limiting compaction indicator requires the proper choice of the restrictive soil resistance value for each crop.
REFERENCES
ASSIS, R.L.; LAZARINI, G.D.; LANCAS, K.P.; CARGNELUTTI FILHO, A. Avaliação da
resistência do solo à penetração em diferentes solos com a variação do teor de água. Engenharia
Agrícola, Jaboticabal, v.29, n.4, p.558-568, 2009.
BERNARDO, S. Manual de irrigação. Viçosa: Universidade Federal de Viçosa, 1986. 488p.
BETIOLI JÚNIOR, E.; MOREIRA, W.H.; TORMENA, C.A.; FERREIRA, C.J.B.; SILVA, A.P.; GIAROLA, N.F.B. Intervalo hídrico ótimo e grau de compactação de um Latossolo Vermelho após
30 anos sob plantio direto. Revista Brasileira de Ciência do Solo, Viçosa, MG, v. 36, p. 971-982,
2012.
BIANCHINI, A.; MAIA, J.C.; MAGALHÃES, P.S.G.; CAPPELLI, N.; UMEZU, C.K.
Penetrógrafo eletrônico automático. Revista Brasileira de Engenharia Agrícola e Ambiental,
Campina Grande, v.6, n.2, 2002.
BUSSCHER, W. J.; BAUER, P. J.; CAMP, C. R.; SOJKA, R. E. Correction of cone index for soil
water content differences in a coastal plain soil. Soil & Tillage Research, Amsterdam, v. 43, p.
205-217, 1997.
BUSSCHER, W. J.; SOJKA, R. E. Enhancement of subsoiling effect on soil strength by
conservation tillage. Transactions of the ASAE, St Joseph, v.30, n. 4, p.888-892, 1987.
BUSSCHER, W.J. Adjustment of flat-tipped penetrometer resistance data to a common water
content. Transactions of the ASAE, St Joseph, v.33, n.2, p.519-524, 1990.
CHEN, G.; WEIL, R.R.; HILL, R.L. Effects of compactation and cover crops on soil least limiting
water range and air permeability. Soil & Tillage Research, Amsterdam, v.136, p.61-69, 2014.
DEXTER, A.R.; CZYZ, E.A.; GAT, O.P.A method for prediction of soil penetration resistance. Soil & Tillage Research, Amsterdam, v.93, n.1, p.412-419, 2007.
EMBRAPA - EMPRESA BRASILEIRA DE PESQUISA AGROPECUÁRIA. Sistema brasileiro
de classificação de solos. Centro Nacional de Pesquisa em Solos. 2. ed. Rio de Janeiro: Embrapa Solos, 2013. 353p.
EMBRAPA-CNPS. Manual de métodos de análise de solo. 2. ed. Rio de Janeiro: EMBRAPA
Solos, 2011. 230 p.
FERMINO, M.H.; KAMPF, A.N. Impedância mecânica de substratos para plantas submetidos a
diferentes tensões hídricas. Pesquisa Agropecuária Gaúcha, Porto Alegre, v.12, n.1-2, p. 25-30,
2006.
FRANCHINI, J.C.; COSTA, J.M.; DEBIASI, H.; TORRES, E. Importância da rotação de
GONÇALVES, W.G.; SEVERIANO, E.C.; SILVA, F.G.; COSTA, K.A.P.; JUNNYOR, W.S.G.; MELO, G.B. Least limiting water range in assessing compaction in a Brazilian Cerrado Latosol
Growing Sugarcane. Revista Brasileira de Ciência do solo, Viçosa, MG, v. 38, p. 432-443, 2014.
GUBIANI, P.I.; REINERT, D.J.; REICHERT, J.M. Valores críticos de densidade do solo avaliados
por condições de contorno. Ciência Rural, Santa Maria, v.44, n.6, p.994-1000, 2014.
GUERRA, S.P.S.; LANÇAS, K.P.; MAZETTO, F.R. Utilização do GPS e do penetrômetro hidráulico-eletrônico para localização de pontos e avaliação da compactação do solo. REUNIÃO
CIENTÍFICA EM CIÊNCIAS AGRÁRIAS DO LAGEADO, 7., 2000, Botucatu. Resumos...
Botucatu: Universidade Estadual Paulista, 2000. p.85.
HINTZE, J. NCSS- Number Cruncher Statistical System, PASS and GESS. Kaysville, 2006.
IBM Corp. IBM SPSS statistics for Windows. Version 20.0. Armonk, 2011.
IMHOFF, S.; SILVA, A.P.; TORMENA, C.A. Aplicações da curva de resistência no controle da
qualidade física de um solo sob pastagem. Pesquisa Agropecuária Brasileira, Brasília, v.35,
p.1493-1500, 2000.
JUNIOR, D.D.V.; BIANCHINI, A.; VALADÃO, F.C.A.; ROSA, R.P. Penetration Resistance
according to penetration rate, cone base size and different soil conditions. Bragantia, Campinas,
v.73, n.2, p.171-177, 2014.
KIM, K.; PREZZI, M.; SALGADO, R.; LEE, W. Effect of Penetration Rate on Cone Penetration
Resistance in Saturated Clayey Soils. Journal of Geotechnical and Geoenvironme ntal
Engineering, New York, v.134, n.8, p.1142-1153, 2008.
KLEIN, V.A.; CAMARA, R.K. Rendimento da soja e intervalo hídrico ótimo em Latossolo
Vermelho sob plantio direto escarificado. Revista Brasileira de Ciência do Solo, Viçosa, MG,
v.31, n.2, p.221-227, 2007.
MIRRED, H.F.; KETCHESON, J.W. Influence of soil bulk density and matric pressure on soil
resistance to penetration. Canadian Journal of Soil Science, Ottawa, v. 52, p.477-483, 1972.
MOLIN, J.P.; MAGALHAES, R.P.; FAULIN, G.D.C. Análise espacial da ocorrência do índice de
cone em área sob semeadura direta e sua relação com fatores do solo. Engenharia Agrícola,
Jaboticabal, v.26, n.2, p.442-452, 2006.
MONTGOMERY, D.C.; RUNGER, G.C.; HUBELE, N.F. Estatística aplicada à engenharia. 2.
ed. Rio de Janeiro: LTC, 2004.
MORAES, M.T.; DEBIASI, H.; CARLESSO, R.; FRANCHINI, J.C.; SILVA, V.R. Critical limits
of soil penetration resistance in a Rhodic Eutrudox. Revista Brasileira de Ciência do Solo, Viçosa,
MG, v.38, p.228-298, 2014b.
MORAES, M.T.; DEBIASI, H.; FRANCHINI, J.C.; SILVA, V.R. Correction of resistance to
penetration by pedofunctions and a reference soil water content. Revista Brasileira de Ciência do
Solo, Viçosa, MG, v.36, n.6, p.1704-1713, 2012.
MORAES, M.T.; DEBIASI, H.; FRANCHINI, J.C.; SILVA, V.R. Soil penetration resistance in a
Rhodic Eutrudox affected by machinery traffic and soil water content. Engenharia Agrícola,
Jaboticabal, v.33, n.4, p.748-757, 2013.
MORAES, M.T.; SILVA, V.R.; ZWIRTES, A.L.; CALESSO, R. Use of penetrometers in
agriculture: A review. Engenharia Agrícola, Jaboticabal, v.34, n.1, p.179-193, 2014a.
MOREIRA, F.R.; DECHEN, S.C.F.; SILVA, A.P.; FIGUEIREDO, G.C.; DE MARIA, I.C. PESSONI, P.T. Intervalo hídrico ótimo em um Latossolo Vermelho cultivado em sistema
semeadura direta por 25 anos. Revista Brasileira de Ciência do Solo, Viçosa, MG, v.38,
MOREIRA, W.H.; PETEAN, L.P.; JUNIOR, E.B.; TORMENA, C.A.; FIGUEIREDO, G.C.; SILVA, A.P. Método alternativo para quantificação do intervalo hídrico ótimo em laboratório. Revista Brasileira Ciência do Solo, Viçosa, MG, v.36, p.1704-1713, 2014.
OTTO, R.; SILVA, A.P.; FRANCO, H.C.J.; OLIVEIRA, E.C.A.; TRIVELIN, P.C.O. High soil
penetration resistance reduces sugarcane root system development. Soil and Tillage Research,
Amsterdam, v.117, p.201–210, 2011.
PORTZ, G., SCHOENKNECHT, E., ALBUQUERQUE, M., TREIN, C. Ajuste dos valores obtidos por Resistência a Penetração (índice de cone), em função da Umidade e Densidade do Solo em condições de campo. In: CONGRESSO BRASILEIRO DE CIÊNCIA DO SOLO, 32., 2009,
Fortaleza. Anais...
REICHARDT, K. Capacidade de campo. Revista Brasileira de Ciência do Solo. Campinas, v.12,
n.13, p.211-216, 1988.
SILVA, A. P.; KAY, B. D.; PERFECT, E. Characterization of the least limiting water range. Soil
Science Society of America Journal, Madison, v.58, n.6, p.1775-1781, 1994.
SILVA, A.P.; TORMENA, C.A.; FIDALSKI, J.; IMHOFF, S. Funções de pedotransferência para as
curvas de retenção de água e de resistência do solo à penetração. Revista Brasileira de Ciência do
Solo, Viçosa, MG, v.32, p.1-10, 2008.
SILVEIRA, D.C.; FILHO, J.F.M.; SACRAMENTO, J.A.A.S.; SILVEIRA, E.C.P.; Relação umidade versus resistência à penetração para um Argissolo Amarelo Distrocoeso no recôncavo da
Bahia. Revista Brasileira de Ciência do Solo, Viçosa, MG, v.34, p.659-667, 2010.
TORMENA, C. A.; SILVA, A. P.; LIBARDI, P. L. Caracterização do intervalo hídrico ótimo de
um Latossolo Roxo sob plantio direto. Revista Brasileira de Ciência do solo, Viçosa, MG, v.22,
n.4, p.573-581, 1998.
TORRES, E.; SARAIVA, O. F. Camadas de impedime nto do solo em sistemas agrícolas com a
soja. Londrina: Embrapa Soja, 1999. p. 32-35 (Circular Técnica, 23).
VAZ, C.M.P.; MANIERI, J.M.; DE MARIA, I.C.; TULLER, M. Modeling and correction of soil
penetration resistance for varying soil water content. Geoderma, Amsterdam, v.166, n.1, p.92–101,
2011.
VAZ, C.M.P.; PRIMAVESI, O.; PATRIZZI, V.C. & IOSSI, M.F. Influência da umidade na resistência do solo medida com penetrômetro de impacto. São Carlos: Embrapa Instrumentação Agropecuária, 2002. 5p. (Comunicado Técnico, 51).
WARRICK, A.W.; NIELSEN, D.R. Spatial variability of soil physical properties in the field. In:
HILLEL, D. (Ed.) Applications of soil physics. New York: Academic Press, 1980. 385 p.
WHALLEY, W.R.; LEEDS-HARRISON, P.B.; CLARK, L.J. & GOWING, D.J.G. Use of effective
stress to predict the penetrometer resistance of unsaturated agricultural soils. Soil and Tillagge