Acta Scientiarum
http://periodicos.uem.br/ojs/acta ISSN on-line: 1807-8621
Doi: 10.4025/actasciagron.v40i1.34989 SOILS
Soil penetration resistance mapping quality: effect of the number of
subsamples
Osmar Henrique de Castro Pias1*, Maurício Roberto Cherubin2, Claudir José Basso3, Antônio
Luis Santi3, José Paulo Molin2 and Cimélio Bayer1
1
Departamento de Ciência do Solo, Universidade Federal do Rio Grande do Sul, Av. Bento Gonçalves, 7712, 91540-000, Porto Alegre, Rio Grande do Sul, Brazil. 2Escola Superior de Agricultura “Luiz de Queiroz”, Universidade de São Paulo, Piracicaba, São Paulo, Brazil. 3Universidade Federal de Santa Maria, Frederico Westphalen, Rio grande do Sul, Brazil. *Author for correspondence. E-mail: [email protected]
ABSTRACT. There is no consensus in the literature regarding how many subsamples are needed to perform accurate on-farm soil penetration resistance (SPR) mapping. Therefore, the objective of this study was to define the number of subsamples per sampling point needed to quantify the SPR. The experiment was performed in a 4.7 ha area and employed a 50 × 50 m grid system (18 sampling points). The SPR was evaluated using a digital penetrometer in two different years with 1, 2, 3, 4, 5, 6, 9, 12, and 15 subsamples per sampling point. The SPR maps produced with increasing numbers of subsamples were compared to the reference maps (15 subsamples) using the relative deviation coefficient and Pearson´s linear correlation. A reduction in the number of subsamples promoted an increase in the variability of the SPR data. Generally, the results from this study suggest the use of at least four subsamples per sampling point to achieve SPR maps with a coefficient of relative deviation less than 10% (30% maximum error per point around the mean) and significant correlation with the reference maps (15 subsamples).
Keywords: soil compaction, sampling protocol, precision agriculture, microvariability.
Qualidade do mapeamento da resistência do solo à penetração: efeito do número de
subamostras
RESUMO. Não existe consenso na literatura sob qual é o número de subamostras necessário para realizar o mapeamento da resistência do solo à penetração (RSP) de modo acurado. Dessa forma, o objetivo deste estudo foi definir o número de subamostras por ponto amostral para quantificar a RSP. O experimento foi realizado em uma área de 4,7 ha seguindo uma malha amostral de 50 × 50 m (18 pontos amostrais). A RSP foi avaliada com auxílio de um penetrômetro digital em dois anos seguidos utilizando-se 1, 2, 3, 4, 5, 6, 9, 12 e 15 subamostras por ponto amostral. Os mapas de RSP gerados com diferente número de subamostras foram comparados com o mapa referência (15 subamostras) utilizando o coeficiente de desvio relativo e de correlação linear de Pearson. A redução do número de subamostras por ponto amostral promove aumento da variabilidade da RSP. De maneira geral, esse estudo sugere o uso de pelo menos quatro subamostras por ponto amostral para atingir mapas de RSP com coeficiente de desvio relativo inferior a 10% (erro máximo de 30% em torno da média por ponto amostral) e correlação significativa com os mapas referência (15 subamostras).
Palavras-chave: compactação do solo, protocolo amostral, agricultura de precisão, microvariabilidade.
Introduction
Soil penetration resistance (SPR) is a measurement utilized to quantify the mechanical impedance of the soil for plant root growth (Bengough, Mckenzie, Hallet, & Valentine, 2011). Therefore, SPR is considered one of the main parameters for the diagnosis of the levels of soil compaction and determination of the most restrictive soil layers for root growth (Girardello et al., 2014). This tool has been widely used by researchers and service providers because it is rapid and easily used in the field compared to other more
conventional methods, such as soil bulk density (Molin, Dias, & Carbonera, 2012).
Page 2 of 11 Pias et al.
Acta Scientiarum. Agronomy, v. 40, e34989, 2018
fields. This method considers the spatial dependence among the sampling points and consequently the spatial variability of the SPR within the area (Molin et al., 2012). The objective of this methodological change is to identify the spatial variability (horizontal and vertical) of the SPR in the sampled area, which enables the creation of thematic maps to guide site-specific management of compacted subareas and soil layers in the field (Girardello et al., 2014).
Measurements of SPR values are highly influenced by diverse intrinsic (e.g., soil moisture, texture and structure) and extrinsic (e.g., management system) soil factors. As consequence, high coefficients of variation are usually observed (Beutler et al., 2007; Storck et al., 2016). Therefore, to correctly determine the spatial variability of the SPR, it is crucial to establish an adequate density of sampling points per area and select the number of subsamples that best represents each sampling point. Regarding the sampling density, studies have demonstrated that ideal sampling grids are approximately 50 × 50 m (i.e., four samples per ha) (Cherubin, Santi, Basso, Eitelwein, & Vian, 2011) or 30 × 30 m (i.e., more than 10 samples per ha) (Debiasi, Franchini, Oliveira, & Machado 2012). However, no study has defined the sampling point and its possible influence on the mapping of this variable.
In traditional sampling methodology, between 12 and 15 subsamples must be collected to compose a mean SPR value with maximum errors varying between 5 and 15% (Tavares Filho & Ribon, 2008; Molin et al., 2012). Georeferenced sampling normally uses many sampling points; therefore, a larger number of subsamples per sampling point increases the sampling cost and makes this method less attractive to farmers (Molin et al., 2012). There is no consensus in the literature concerning the number of subsamples used to collect the SPR data. Instead, reports vary with the use of one (Souza et al., 2006; Marasca et al., 2011), two (Debiasi et al., 2012), three (Tormena, Barbosa, Costa, & Gonçalves, 2002; Cherubin et al., 2011), five (Silva, Passos, & Beltrão, 2009) and ten subsamples (Secco, Reinert, Reichert, & Silva, 2009; Girardello et al., 2014) per sampling point. The use of an insufficient number of subsamples may result in inaccurate data collection, which generates recommendations for unnecessary interventions.
In this study, we tested the hypothesis that an insufficient number of subsamples per sampling point affected the representative of the assessment
and the accuracy of the generated SPR thematic maps. The aim of this study was to evaluate the impact of the number of subsamples per sampling point on the quality of the SPR mapping and to determine the number of subsamples necessary to generate thematic maps with adequate accuracy for on-farm precision agriculture in crop production systems based on no-till farming.
Material and methods
Description of the study area
This on-farm study was conducted in an agricultural area near Palmeira das Missões city in southern Brazil (latitude 28°72′62″ S and longitude 69°14′34″ W), with a mean altitude of 600 m. The relief of the area is smoothly undulating, and the soil presents a clay texture (636 g kg-1 of clay, 316 g kg-1
of silt and 48 g kg-1 of sand content) and is classified
as Rhodic Acrudox according to Soil Taxonomy (Soil Survey Staff, 2014) and “Latossolo Vermelho distrófico” according to the Brazilian System of Soil Classification (Santos et al., 2013). The area has been cultivated under a no-tillage cropping system without machinery traffic control since 1997 (i.e., 15 years when the study was performed), including crop succession with wheat in the winter season and soybean or eventually corn in the summer season.
Determination of the soil penetration resistance
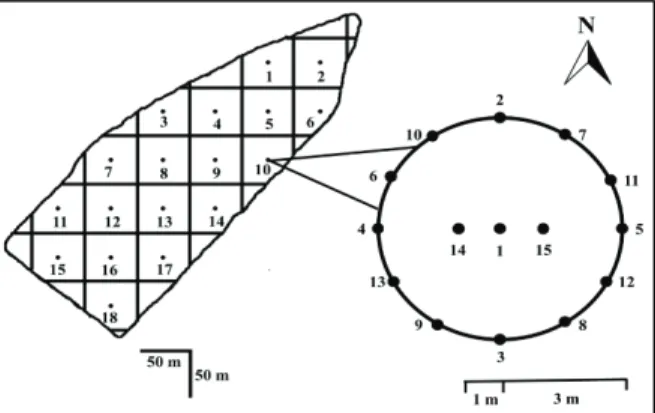
The study was performed in 2012 (year I) and reproduced in 2013 (year II). In both years, the data were collected in May after the soybean harvest. The 4.7 ha agricultural area was georeferenced and divided into a regular quadrangular sampling grid of 50 × 50 m to yield 18 sampling points (Figure 1). The SPR was determined down to a 0.30 m depth using a portable digital penetrometer (PenetroLOG®
model PLG 1020, Falker Automação, Porto Alegre, Rio Grande do Sul State, Brazil) with a cone diameter of 12.83 mm. The rod was inserted into the soil at a constant speed close to 20 mm s-1.
When the insertion speed surpassed 30 mm s-1,
the equipment registered an error and the measurement was remade. Fifteen subsamples were collected from each sampling point following the inter-row position of the previous crop within a radius of 3 m around the georeferenced point. The SPR evaluations were performed two days after a heavy rain. The whole procedure took only one working day in both years.
Number of subsamples on soil penetration resistance mapping Page 3 of 11
collected from the 0.00-0.15 m layer at three points (points 2, 9 and 16) (Figure 1). The average soil moisture was 310 and 330 g kg-1 for years I and II,
respectively.
Figure 1. Schematic representation of the sampling grid (50 x 50 m) used in this study area highlighting the distribution of the 15 subsamples of soil penetration resistance in each sampling point in Palmeira das Missões (RS), southern Brazil.
Mathematical and statistical analyses
The datasets from each sampling point (18 points) and soil layer (i.e., 0.00-0.05, 0.05-0.10, 0.10-0.15, 0.15-0.20, 0.20-0.25 and 0.25-0.30 m) composed of 15 subsamples were organized into a spreadsheet and subjected to outlier analysis. Any values that fell outside of the range of two standard deviations from the mean were considered outliers. Subsequently, the determination of the optimum number of subsamples was performed based on Equation 1 as proposed by Petersen and Calvin (1965):
n = tα 2
x S2
D2 (1)
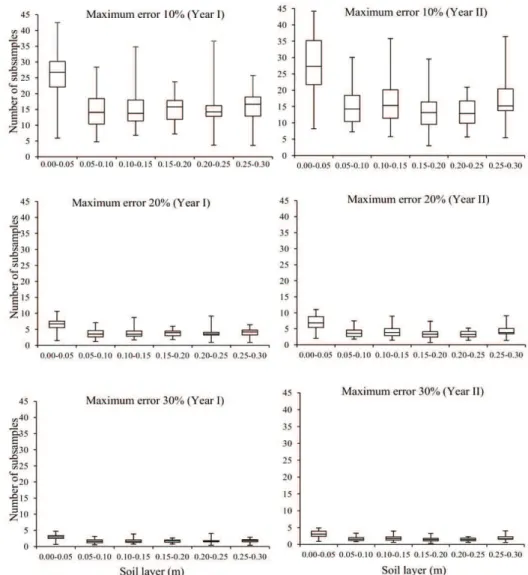
where n is the number of subsamples, t is the value from the distribution table for the function of the level of significance (α) and the degrees of freedom used to estimate the sample variance, S is the sample standard deviation of the mean (15 subsamples per sampling point) and D is the result of the SPR mean at each sampling point divided by the percentage variation enabled around the mean. The level of significance used was 0.05%, and the optimum number of subsamples for each sampling point was determined considering maximum errors of 10, 20 and 30% around the mean.
Soil penetration resistance mapping
The SPR maps were produced using the CR-Campeiro 7 software (Department of Geomatics, Federal University of Santa Maria, Rio Grande do Sul State, Brazil) by considering different numbers
of subsamples (i.e., 1, 2, 3, 4, 5, 6, 9, 12, and 15) per sampling point. A specific map was produced for each soil layer studied down to 0.30 m (i.e., 0.00-0.05, 0.05-0.10, 0.10-0.15, 0.15-0.20, 0.20-0.25, and 0.25-0.30 m). The reduced number of points (n < 50 points) limited the use of the geostatistical approach to verify the existence of spatial dependence among the samples (Webster & Oliver, 2007). Therefore, the maps were produced using the interpolator inverse square distance as broadly recommended in the literature (e.g., Coelho, Souza, Uribe-Opazo, & Pinheiro Neto, 2009; Wu, Hung, & Patton, 2013).
The SPR data from each soil layer considering the different numbers of subsamples were subjected to a descriptive statistical analysis to obtain the positional means (minimum, mean and maximum) and dispersion (coefficients of variation–CV, %). The CV values were used to classify the variability of the data into low (CV < 12%), medium (CV= 12 to 62%) and high (CV > 62%) as proposed by Warrick and Nielsen (1980). The normality hypothesis was tested and confirmed using the W test (p ≥ 0.05) (Shapiro & Wilk, 1965), and thus no data transformation was necessary. The data analysis was completed using the statistical package SAS (SAS, 2010).
Analysis of the soil penetration resistance mapping quality
Two parameters were used to evaluate the effect of the number of subsamples on the accuracy of the thematic maps: Pearson’s linear correlation coefficient (p ≤ 0.05) and the relative deviation coefficient (RDC, %) (Coelho et al., 2009). The mean SPR values from 15 subsamples per sampling point were considered as a reference (standard) for comparison with the other maps produced using different numbers of subsamples (i.e., 1, 2, 3, 4, 5, 6, 9, and 12).
The RDC, which is expressed as an absolute value, shows the dissimilarity between the two maps as demonstrated by the differences between the interpolated points of each map. The RDC was determined using Equation 2, which was adapted from the equations applied by Coelho et al. (2009) and Cherubin et al. (2015).
RDC = ∑ൣ൫SPRj - SPRref൯ / SPRref൧ x ሺ100 / nሻ (2)
Page 4 of 11 Pias et al.
Acta Scientiarum. Agronomy, v. 40, e34989, 2018
using different numbers of subsamples (i.e., 1, 2, 3, 4, 5, 6, 9, and 12).
Results and discussion
Number of subsamples per sampling point
After the preliminary analysis to detect outliers, 2.7% of the raw data was removed. This procedure is fundamental when the SPR is measured using portable penetrometers with manual operation because the roughness of the soil surface (Catania et al., 2013) and the variation in the speed of the rod going into the soil profile can influence the results (Valadão Jr, Biachini, Valadão, & Rosa, 2014).
The optimum number of subsamples per sampling point was similar in both years studied, indicating good consistency of the results (Figure2). The surface layer (0.00-0.05 m) required a larger number of subsamples to adequately represent the SPR of the sampling point. Therefore, 30 and 35
subsamples were required from each sampling in years I and II, respectively, to maintain 75% of the sampling points with a maximum error of 10%. If all of the sampling points (18) achieve this accuracy (i.e., a maximum error of 10%), 44 subsamples need to be collected. The higher microvariability observed in the surface soil layer (radius 3 m) is due to various factors, including the soil and crop management practices, effects of plant roots, wet-dry cycles, and the potential surface sealing that is commonly observed in no-tillage systems, especially when little straw is present (Cherubin et al., 2011; Silva, Bianchi & Cunha, 2016). High variation of microvariability of the SPR data was observed between sampling points (Figure 2). Thus, for some points in the surface layer, less than 10 subsamples were sufficient to obtain values with a maximum deviation of less than 10%.
Number of subsamples on soil penetration resistance mapping Page 5 of 11
For the surface soil layer in both years, 11 and 5 subsamples per sampling point were sufficient to obtain SPR values with maximum errors of 20 and 30% around the mean, respectively. However, the surface layer of the soil under a no-tillage system is periodically disturbed during the opening of the sowing row, thereby minimizing possible physical restrictions (i.e., high SPR values) for plant root growth (Moreira et al., 2016). Thus, when the SPR is determined, the major interest of the technician is an evaluation of the compaction state of the subsuperficial layers of the soil (below 0.05 m), where the higher SPR levels restrict the growth of roots at depth and may limit crop development, mainly due to water stress (Tormena et al., 2002; Cardoso et al., 2006). In a study of the effect of high SPR values on soybeans, Cardoso et al. (2006) observed that impediments to root growth in the subsurface caused the root system to concentrate in the soil surface layer (0.00-0.05 m), which was the zone that retained the lowest water content, thereby negatively influencing nutrient absorption.
For the deeper soil layers (0.05-0.30 m), the optimum numbers of subsamples per sampling point were similar. At these depths, the collection of 15 and 18 subsamples was necessary to obtain a maximum error of 10% around the mean for 75% of the sampling points for years I and II, respectively. However, 35 samples needed to be collected for all sampling points to attain this accuracy level, demonstrating that the high SPR microvariability among sampling point sob served in the surface soil layer persisted in the deeper soil layers. Only 8 and 4 samples would be required if we allowed maximum variations of 20 and 30% around the mean for the layers between 0.05 and 0.30 m in all sampling points, respectively. However, for 75% of the sampling points, only 5 (20% error) and 2 (30% error) subsamples were sufficient.
The use of reduced numbers of subsamples decreases the operational cost of field SPR sampling (less time-consuming). However, the low accuracy of the measurement (i.e., a higher level of error) can make the results less reliable and even technically unviable depending on the goal of the assessment (Tavares-Filho & Ribon, 2008). For example, suppose that the SPR in a soil layer at one specific point is 3.5 MPa and a 30% maximum error is allowed; in this scenario, the result of the evaluation could be between 2.5 and 4.55 MPa. These values encompass SPR values that are considered adequate for root growth or are highly restrictive. Allowing a 20% maximum error results in values that vary from 2.8 to 4.2, and allowing a maximum error of 10% results in a range of 3.15 to 3.8, which does not generate large differences in terms of soil management decisions. Thus, an increase in the robustness of sampling will increase the accuracy of the
information and in turn support management decisions that prevent unnecessary soil disturbances to alleviate compaction and its deleterious effects on soil ecosystem services. Nevertheless, the increased operational costs involved in more intensive soil sampling should always be considered to ensure that the evaluation is financially feasible for the farmer. Based on these factors, the decision concerning the number of subsamples that should be taken in an SPR evaluation depends on the accuracy required by the farmer/consultant (goals of the assessment) and the capacity for investments.
Descriptive statistics of the SPR sampling point data set
The highest mean SPR values (close to 3 MPa) were obtained from the soil layers below 0.15 m in depth in year I (Table 1) and the 0.10-0.15 and 0.15-20 m layers in year II (Table 2). Soil compaction in layers below the action zone of seeder disks and shank openers has been frequently detected in soils under the no-tillage system (Cardoso et al., 2006; Debiasi, Levien, Trein, Conte, & Kamimura, 2010; Cherubin et al., 2011; Moreira et al., 2016). The absence of soil disturbance, the low diversified cropping system and especially the systematic traffic of heavy machinery under soil moisture conditions favorable for compaction have been proposed as the main causes associated with soil compaction in no-tillage areas (Tormena et al., 2002; Debiasi et al., 2010).
The analyses of the mean SPRs from the whole area (18 sampling points), from the different soil layers and over the two year period showed that the number of subsamples did not largely influence the results. Therefore, if the objective of the SPR evaluation was to obtain a general diagnosis of the area (traditional sampling), the number of subsamples would not influence the results. This finding corroborates the results obtained by Tavares Filho and Ribon (2008) and Molin et al. (2012), which indicate that 12-15 subsamples are sufficient to obtain satisfactory results using conventional sampling.
However, the number of subsamples had an elevated influence on the amplitude of the SPR values (i.e., the range between the minimum and maximum values), resulting in a reduction of the amplitude of the data with an increase in the number of subsamples.
Page 6 of 11 Pias et al.
Acta Scientiarum. Agronomy, v. 40, e34989, 2018
Table 1. Descriptive statistics of soil penetration resistance (SPR, MPa) in the soil profiles obtained with different numbers of subsamples (1-15) per sampling point in year I in Palmeira das Missões (RS), southern Brazil.
Statistical Number of subsamples
parameters 1 2 3 4 5 6 9 12 15
0.00–0.05 (m) (year I)
Minimum 1.19 1.27 1.57 1.58 1.62 1.55 1.74 1.78 1.81
Mean 2.05 2.09 2.14 2.11 2.08 2.10 2.18 2.20 2.21
Maximum 3.36 3.06 2.83 2.76 2.69 2.79 2.87 2.84 2.78
CV (%)§ 28.66 23.19 15.05 14.18 14.70 15.08 13.43 13.07 13.60
0.05–0.10 (m) (year I)
Minimum 1.62 1.68 1.85 1.83 2.02 2.17 2.11 2.22 2.28
Mean 2.66 2.55 2.56 2.47 2.52 2.58 2.58 2.62 2.64
Maximum 3.58 3.55 3.22 3.04 2.95 2.92 2.98 3.06 3.05
CV (%) 21.56 19.42 14.25 13.96 12.08 9.91 10.15 9.64 8.69
0.10–0.15 (m) (year I)
Minimum 2.03 2.05 2.24 2.18 2.25 2.09 2.29 2.41 2.44
Mean 2.79 2.79 2.78 2.74 2.76 2.77 2.77 2.81 2.83
Maximum 4.19 3.96 3.79 3.52 3.36 3.32 3.12 3.10 3.27
CV (%) 22.06 16.31 14.78 12.85 11.12 10.93 8.12 7.23 7.07
0.15–0.20 (m) (year I)
Minimum 1.70 2.05 2.22 2.27 2.28 2.31 2.43 2.63 2.65
Mean 2.93 2.87 2.92 2.93 2.94 2.93 2.97 3.02 3.04
Maximum 4.76 3.84 3.68 3.77 3.55 3.53 3.30 3.38 3.40
CV (%) 27.86 17.44 14.95 13.51 12.67 12.05 9.25 7.85 7.48
0.20–0.25 (m) (year I)
Minimum 1.57 1.59 1.86 2.35 2.43 2.52 2.65 2.65 2.66
Mean 3.02 3.09 3.09 3.09 3.09 3.10 3.14 3.15 3.17
Maximum 4.37 4.30 3.80 3.74 3.71 3.71 3.82 3.61 3.64
CV (%) 25.36 20.38 16.19 13.05 12.14 10.9 9.23 8.29 8.47
0.25–0.30 (m) (year I)
Minimum 1.40 1.94 2.14 2.31 2.34 2.43 2.61 2.58 2.60
Mean 3.12 3.10 3.05 3.12 3.13 3.13 3.17 3.18 3.17
Maximum 4.86 4.61 3.92 4.09 3.89 3.77 3.77 3.81 3.78
CV (%) 29.04 21.77 17.34 16.2 16.04 14.27 11.38 10.01 9.96
§
CV = coefficient of variation.
Table 2. Descriptive statistics of soil penetration resistance (SPR, MPa) in the soil profiles obtained with different numbers of subsamples (1-15) per sampling point in year II in Palmeira das Missões (RS), southern Brazil.
Statistical Number of subsamples
parameters 1 2 3 4 5 6 9 12 15
0.00–0.05 (m) (year II)
Minimum 1.25 1.25 1.41 1.35 1.46 1.42 1.42 1.61 1.67
Mean 2.02 2.04 1.99 1.97 2.00 2.07 2.12 2.11 2.12
Maximum 3.08 3.88 2.47 2.46 2.55 2.55 2.48 2.53 2.53
CV (%)§ 22.48 22.66 16.68 15.72 15.74 15.81 14.27 13.66 12.09
0.05–0.10 (m) (year II)
Minimum 1.51 1.76 1.93 2.21 2.10 2.27 2.38 2.38 2.46
Mean 2.60 2.63 2.70 2.69 2.71 2.75 2.75 2.72 2.74
Maximum 3.65 3.46 3.29 3.15 3.29 3.25 3.13 3.05 3.03
CV (%) 24.13 20.91 15.30 11.90 12.39 10.97 7.74 7.31 5.79
0.10–0.15 (m) (year II)
Minimum 1.77 2.14 2.38 2.40 2.42 2.38 2.49 2.43 2.48
Mean 2.82 2.88 2.91 2.90 2.91 2.92 2.92 2.92 2.92
Maximum 3.93 4.20 3.49 3.47 3.53 3.46 3.30 3.22 3.17
CV (%) 22.73 18.47 11.47 11.79 10.96 9.82 8.08 7.75 6.60
0.15–0.20 (m) (year II)
Minimum 1.77 2.14 2.38 2.40 2.42 2.38 2.49 2.43 2.48
Mean 2.82 2.88 2.91 2.90 2.91 2.92 2.92 2.92 2.92
Maximum 3.93 4.20 3.49 3.47 3.53 3.46 3.30 3.22 3.17
CV (%) 16.52 11.73 8.55 7.95 8.75 8.18 8.40 7.59 7.16
0.20–0.25 (m) (year II)
Minimum 1.83 2.09 2.20 2.17 2.18 2.25 2.25 2.24 2.26
Mean 2.83 2.75 2.63 2.63 2.63 2.65 2.65 2.65 2.68
Maximum 3.80 3.38 3.07 3.06 3.11 3.08 3.05 3.11 3.18
CV (%) 16.9 12.63 11.14 10.45 11.24 10.69 9.48 9.31 8.65
0.25–0.30 (m) (year II)
Minimum 1.53 1.99 1.98 2.02 2.03 2.16 2.21 2.16 2.21
Mean 2.69 2.69 2.64 2.64 2.64 2.69 2.68 2.67 2.68
Maximum 3.68 3.53 3.39 3.42 3.67 3.53 3.29 3.28 3.19
CV (%) 21.96 17.87 16.74 15.51 15.73 13.80 10.23 10.76 9.76
Number of subsamples on soil penetration resistance mapping Page 7 of 11
Moreover, the errors resulting from possible sampling faults are diluted (Molin et al., 2012). For example, the maximum SPR value observed in year I using 15 subsamples was 3.27 MPa (0.10-0.15 m layer), whereas when using only one subsample the maximum at this location was 4.19 MPa. This evidence is important and emphasizes the need to correctly choose the number of subsamples when localized intervention in the field is guided by the spatial variability in the SPR as proposed by Girardello et al. (2014). The utilization of an insufficient number of subsamples can incorrectly indicate a need to conduct interventions in areas, which makes this type of management technically and economically inefficient (Tavares Filho & Ribon, 2008; Molin et al., 2012)
Generally, the data show CV values classified as low or medium. The coefficient of variation values were classified with low variation (< 12%) when more than six subsamples were used (Warrick & Nielsen, 1980). The exception was the samples collected from the 0.00-0.05 m soil layer, which were classified as medium (12 < CV < 62%), where only one subsample from years I and II reached values of 29 and 23%, respectively. Independent of the year of the study, a reduction in the number of subsamples resulted in an increase in the CV values (Tables 1 and 2). The observation of higher CV values is an indication of the existence of higher spatial variability of the attribute in that area (Oliveira et al., 2015), which requires the utilization of sampling plans that use a larger number of samples to faithfully reproduce the spatial variability at that location (Siqueira et al., 2014). Although we did not investigate different sampling grid sizes in this study, the results obtained indicate that using a higher number of subsamples per sampling point is an SPR mapping strategy to uses less dense sampling grids. This finding need to be confirmed in future studies.
Quality of the thematic SPR maps in the function of the number of subsamples
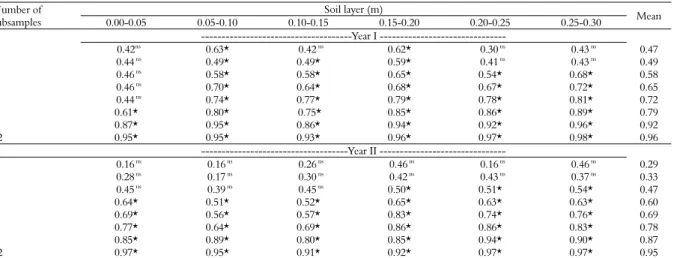
In the surface layer of the soil (0.00-0.05 m), we found a significant correlation with the reference maps (15 subsamples) when at least six and four subsamples were used in years I and II, respectively (Table 3).For the other soil layers, three (year I) and four (year II) subsamples were sufficient to obtain a significant correlation with the reference maps. For all of the layers measured, a reduction in the correlation coefficient was observed with a reduction in the number of subsamples collected. These results indicated that the maps obtained using lower numbers of subsamples per sampling point presented higher deviations in their estimates, thereby reducing the reliability of the information (Cherubin et al., 2015).
In both years, the SPR maps for the surface soil layer presented the lowest correlations with the reference maps (15 subsamples). This result is due to higher variation in the SPR values in this soil layer, as was previously discussed for the item numbers of subsamples per sampling point. Tavares Filho and Ribon (2008) compared no-tillage and conventional tillage systems, and Storck et al. (2016) studied an integrated crop-livestock system; both studies also found that the 0.00-0.10 m layer presented the highest variations and consequently needed a larger number of subsamples than any other soil layer to achieve a good level of reliability. However, considering that the surface layer of the soil under a no-tillage system is periodically disturbed during crop sowing, which minimizes possible physical restrictions to plant root growth, the decision of the subsample numbers per sampling point to provide penetration resistance measurements should be based on the microvariability of this parameter in the deeper soils layers (Moreira et al., 2016).
The RDC results (Figure3) were similar to the results obtained for the correlation analysis for the two study years and all of the soil layers measured, with a correlation of -0.88 between the RDC and Pearson´s correlation. A high correlation (r = 0.96) between the RDC and the Kappa index, which is another procedure used to evaluate the similarity between thematic maps, has been shown in the literature (Bazzi, Souza, Uribe Opazo, Nóbrega, & Neto, 2008). Independent of the soil layer measured, there was an increase in the deviation (sampling errors) in the maps with a reduction in the number of subsamples. The highest RDC values were found in the 0.00-0.05 m layer in year I, with a deviation of 21%, and in the 0.00-0.05 and 0.05-0.10 m layers in year II, with a deviation of 19%. The use of RDC analysis to compare SPR maps has not been documented in the literature, which characterizes this study as pioneering in this area. However, this coefficient has been used with success for other variables, such as grain yield (Bazzi et al., 2008; Coelho et al., 2009) and soil chemical attributes (Cherubin et al., 2015).
Page 8 of 11 Pias et al.
Acta Scientiarum. Agronomy, v. 40, e34989, 2018
Table 3. Correlation between the soil penetration resistance (SPR) maps obtained with different numbers of subsamples (1-12) per sampling point and the reference maps obtained with 15 subsamples in two years in Palmeira das Missões (RS), southern Brazil.
Number of subsamples
Soil layer (m)
Mean 0.00-0.05 0.05-0.10 0.10-0.15 0.15-0.20 0.20-0.25 0.25-0.30
---Year I ---
1 0.42ns
0.63* 0.42ns
0.62* 0.30ns
0.43 ns
0.47
2 0.44 ns 0.49* 0.49* 0.59* 0.41ns 0.43 ns 0.49
3 0.46 ns 0.58* 0.58* 0.65* 0.54* 0.68* 0.58
4 0.46 ns 0.70* 0.64* 0.68* 0.67* 0.72* 0.65
5 0.44 ns 0.74* 0.77* 0.79* 0.78* 0.81* 0.72
6 0.61* 0.80* 0.75* 0.85* 0.86* 0.89* 0.79
9 0.87* 0.95* 0.86* 0.94* 0.92* 0.96* 0.92
12 0.95* 0.95* 0.93* 0.96* 0.97* 0.98* 0.96
---Year II ---
1 0.16 ns
0.16 ns
0.26ns
0.46ns
0.16ns
0.46 ns
0.29
2 0.28 ns 0.17 ns 0.30ns 0.42ns 0.43ns 0.37 ns 0.33
3 0.45 ns 0.39 ns 0.45ns 0.50* 0.51* 0.54* 0.47
4 0.64* 0.51* 0.52* 0.65* 0.63* 0.63* 0.60
5 0.69* 0.56* 0.57* 0.83* 0.74* 0.76* 0.69
6 0.77* 0.64* 0.69* 0.86* 0.86* 0.83* 0.78
9 0.85* 0.89* 0.80* 0.85* 0.94* 0.90* 0.87
12 0.97* 0.95* 0.91* 0.92* 0.97* 0.97* 0.95
*and ns= significant and non-significant Pearson’s correlation coefficients (p < 0.05), respectively; n= 18 points.
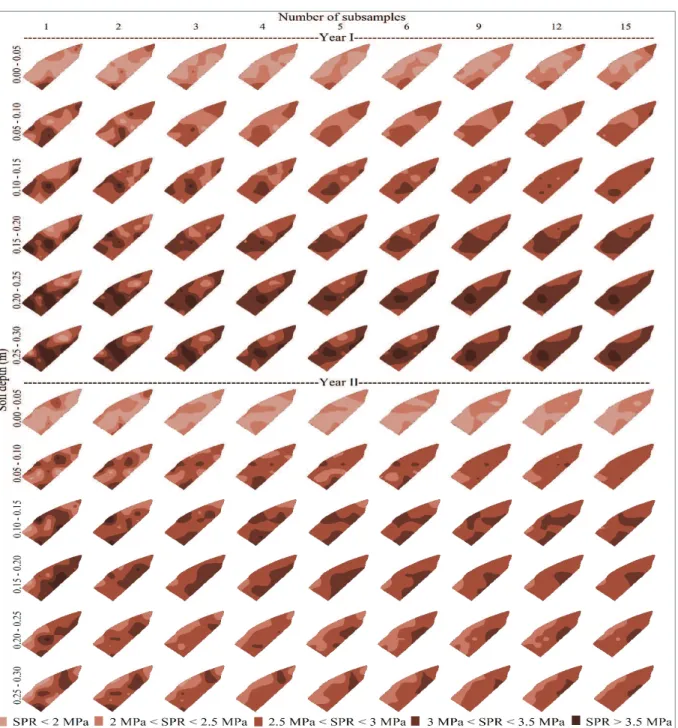
The SPR maps produced considering the different numbers of subsamples in years I and II are shown in Figure 4. Generally, we observed an increase in the dissimilarity in relation to the reference map (15 subsamples) with a reduction in the number of subsamples, resulting in a loss of accuracy in the maps that consequently could lead to erroneous interpretations concerning the real physical conditions of the soil. This loss of accuracy can be visualized by the increase in amplitude of the observed SPR values, with the maps produced with a smaller number of subsamples using more SPR classes (viz., colors). Therefore, the utilization of an insufficient number of subsamples overestimates the variability of the data and can indicate a necessity for denser sampling grids (viz., more sampling points), which increases the sampling cost.
In the literature, divergent opinions exist regarding the SPR value that should be considered the critical limit for plant root growth. These values
vary according to the characteristics of the soil, management practices and crops. Traditionally, SPR values between 2.0 and 2.5 MPa (Taylor, Robertson & Parker, 1966) are considered the critical limits for root growth. However, various studies have shown that plants tolerate higher SPR values (up to 3 MPa) in areas with no-tillage systems (Secco et al., 2009; Girardello et al., 2014; Moraes, Debiasi, Carlesso, Franchini, & Silva, 2014), probably due to the better soil structure and the greater presence of continuous biopores (Moraes et al., 2014). Independent of the critical limit considered, subareas with SPR values considered restrictive for root growth were detected using the mapping strategy. In this sense, this study could help farmers, consultants and researchers with decision-making regarding the sampling procedure that should be used for SPR evaluations in agricultural soils.
Figure 3. Relative deviation coefficient (RDC%) between soil penetration resistance maps (SPR, MPa) obtained with different numbers of subsamples (1-12) per sampling point and the reference maps (15 subsamples) for different soil layers in years I (a) and II (b) in Palmeira das Missões (RS), southern Brazil.
0 5 10 15 20 25
0.00-0.05 0.05-0.10 0.10-0.15 0.15-0.20 0.20-0.25 0.25-0.30
RDC (%)
Soil layer (m)
1 2 3 4
5 6 9 12
a)
0 5 10 15 20 25
0.00-0.05 0.05-0.10 0.10-0.15 0.15-0.20 0.20-0.25 0.25-0.30
Soil layer (m)
1 2 3 4
5 6 9 12
Number of subsamples on soil penetration resistance mapping Page 9 of 11
Figure 4. Thematic maps of soil penetration resistance (SPR) obtained by considering different numbers of subsamples (1-12) per sampling point and the reference maps (15 subsamples) for the different soil layers in two years in Palmeira das Missões (RS), southern Brazil.
Conclusion
The number of subsamples used to obtain the soil penetration resistance that properly represents a sampling point depends on the level of error tolerated in the mapping, with a higher number of subsamples resulting in more accurate maps.
A reduction in the number of subsamples promotes an increase in the variability of soil penetration resistance data. Generally, this study suggests that at least four subsamples per
sampling point achieves soil penetration resistance maps with a coefficient of relative deviation less than 10% (30% maximum error per point around the mean) and significant correlation with the reference maps (15 subsamples).
References
Page 10 of 11 Pias et al.
Acta Scientiarum. Agronomy, v. 40, e34989, 2018 colheita na precisão dos mapas de produtividade na
cultura do milho. Engenharia Agrícola, 28(2), 355-63. Bengough, A. E., Mckenzie, B. M., Hallet, P. D., &
Valentine, T. A. (2011). Root elongation, water stress, and mechanical impedance: A review of limiting stress and beneficial root tip trails. Journal of Experimental Botany, 62(1), 59-68.
Beutler, N. A., Cebturion, J. F., Centurion, M. A. P. C., Leonel, C. L., São João, A. C. E., & Freddi, O. S. (2007). Intervalo hídrico ótimo no monitoramento da compactação e da qualidade física de um Latossolo Vermelho cultivado com soja. Revista Brasileira de Ciência do Solo, 31(6), 1223-1232.
Cardoso, E. G., Zotarelli, L., Piccinin, J. L., Torres, E., Saraiva, O. F., & Guimarães, M. F. (2006). Sistema radicular da soja em função da compactação do solo no sistema plantio direto. Pesquisa Agropecuária Brasileira, 41(3), 493-501.
Catania, P., Vallone, P., Pipitone, F., Argento, G. F., Spartà, G., & Laudicina, V. A. (2013). Soil management effect on soil penetration resistance in the vineyard. Journal of Agricultural Engineering, 44(2), 344-347.
Cherubin, M. R., Santi, A. L., Basso, C. J., Eitelwein, M. T., & Vian, A. L. (2011). Variabilidade da resistência do solo à penetração em função da dimensão da malha amostral. Revista Plantio Direto, 125(5), 4-9.
Cherubin, M. R., Santi, A. L., Eitelwein, M. T., Amado, T. J. C., Simon, D. H., & Damian, J. M. (2015). Dimensão da malha amostral para caracterização da variabilidade espacial de fósforo e potássio em Latossolo Vermelho. Pesquisa Agropecuária Brasileira, 50(2), 168-177.
Coelho, E. C., Souza, E. G., Uribe-Opazo, M. A., & Pinheiro Neto, R. (2009). Influência da densidade amostral e do tipo de interpolador na elaboração de mapas temáticos. Acta Scientiarum Agronomy, 31(1), 165-174.
Debiasi, H., Levien, R., Trein, C. R., Conte, O., & Kamimura, K. M. (2010). Produtividade de soja e milho após coberturas de inverno e descompactação mecânica do solo. Pesquisa Agropecuária Brasileira, 45(6), 603-612.
Debiasi, H., Franchini, J. C., Oliveira, F. A., &Machado, T. M. (2012). Ajuste de grades amostrais para o mapeamento da resistência à penetração de um Latossolo Bruno. In: Inamasu, B. Y., Naime, J. M., Resende, A. V., & Bassoi, L. H. (Ed.). Agricultura de Precisão: Um novo olhar (p. 138-42). São Carlos: Embrapa CNPSo.
Empresa Brasileira de Pesquisa Agropecuária [Embrapa]. (1997). Manual de métodos de análise de solo (2a ed.). Rio de Janeiro, RJ: Embrapa.
Girardello, V. C., Amado, T. J. C., Santi, A. L., Cherubin, M. R., Kunz, J., & Teixeira, T. G. (2014). Resistência à penetração, eficiência de escarificadores mecânicos e produtividade da soja em Latossolo argiloso manejado sob plantio direto de longa duração. Revista Brasileira de Ciência do Solo, 38(4), 1234-1244.
Marasca, I., Oliveira, C. A. A., Guimarães, E. C., Cunha, J. P. A. R., Assis, R. L., Perin, A., & Menezes, L. A. S. (2011). Variabilidade espacial da resistência do solo à penetração e teor de água em sistema de plantio direto na cultura da soja. Bioscience Journal, 27(2), 239-246. Molin, J. P., Dias, C. T. S., & Carbonera, L. (2012).
Estudos com penetrometria: Novos equipamentos e amostragem correta. Revista Brasileira de Engenharia Agrícola e Ambiental, 16(5), 584-590.
Moraes, M. T., Debiasi, H., Carlesso, R., Franchini, J. C., & Silva, V. R. (2014). Critical limits of soil penetration resistance in a Rhodic Eutrudox. Revista Brasileira de Ciência do Solo, 38(1), 288-298.
Moreira, W. H., Tormena, C. A., Karlen, D. L., Silva, A. P., Keller, T., & Betioli Jr, E. (2016). Seasonal changes in soil physical properties under long-term no-tillage. Soil Tillage Research, 160(1), 53-64.
Oliveira, I. A., Junior, J. M., Campos, M. C. C., Aquino, R. E., Freitas, L., Siqueira, D. S., & Cunha, J. M. (2015). Variabilidade espacial e densidade amostral da suscetibilidade magnética e dos atributos de Argissolos da Região de Manicoré, AM. Revista Brasileira de Ciência do Solo, 39(3), 668-681.
Petersen, R. G., & Calvin, L. D. (1965). Sampling. In Black, C. A. (Ed.). Methods of soil analysis: Physical and mineralogical properties, including statistics of measurement and sampling (p. 54-71). Madison: American Society of Agronomy.
Santos, H. G., Jacomine, P. K. T., Anjos, L. H. C., Oliveira, V. A., Lumbreras, J. F., Coelho, M. R., Almeida, J. Á., Cunha, T. J. F., & Oliveira, J. B. (2013). Sistema Brasileiro de Classificação de Solos (3a ed.). Brasília, DF: Embrapa Solos.
Secco, D., Reinert, D. J., Reichert, J. M., & Silva, V. R. (2009). Atributos físicos e rendimento de grãos de trigo, soja e milho em dois Latossolos compactados e escarificados. Ciência Rural, 39(1), 58-64.
Shapiro, S. S., & Wilk, M. B. (1965). An analysis of variance test for normality: complete samples. Biometrika, 52(3/4), 591-611.
Silva, J. M., Passos, A. L. R., & Beltrão, F. A, S. (2009). Análise espacial da densidade, umidade e resistência do solo à penetração sob sistemas de cultivo. Engenharia Ambiental, 6(3), 103-118.
Silva, W. M.,Bianchini, A.,& Cunha, C. A. (2016). Modeling and correction of soil penetration resistance for variations in soil moisture and soil bulk density. Engenharia Agrícola, 36(3), 449-459.
Siqueira, D. S. J., Junior, M., Pereira, G. T., Barbosa, R. S., Teixeira, D. B., & Peluco, R. G. (2014). Sampling density and proportion for the characterization of the variability of Oxisol attributes on different materials. Geoderma, 232-234(1), 172-182.
Number of subsamples on soil penetration resistance mapping Page 11 of 11
Souza, Z. M., Campos, M. C. C., Cavalcante, I. H. L., Marques JR, J., Cesarin, L. G., & Souza, S. R. (2006). Dependência espacial da resistência do solo à penetração e do teor de água do solo sob cultivo continuo de cana-de açúcar. Ciência Rural, 36(1), 128-134.
Statistical Analysis System [SAS]. (2010). Sas/Stat user's guide: statistics, version 9.1.3. Cary, NC: SAS.
Storck, L., Kobata S. G. K., Brum, B., Soares, A. B., Modolo, A. J., & Assmann, T. S. (2016). Sampling plan for using a motorized penetrometer in soil compaction evaluation. Revista Brasileira de Engenharia Agrícola e Ambiental, 20(3), 250-255.
Tavares-Filho, J., & Ribon, A. A. (2008). Resistência do solo à penetração em resposta ao número de amostras e tipo de amostragem. Revista Brasileira de Ciência do Solo, 32(2), 487-494.
Taylor, H. M., Robertson, G. M., & Parker, J. J. (1966). Soil strength root penetration for mediun to coarse textured soil materials. Soil Science Society American Journal, 102(1), 18-22.
Tormena, C. A., Barbosa, M. C., Costa, A. C. S., & Gonçalves, A. C. A. (2002). Densidade, porosidade e resistência à penetração em Latossolo cultivado sob
diferentes sistemas de preparo de solo. Scientia Agrícola, 591(4), 795-801.
Valadão Jr, D. D., Biachini, A., Valadão F. C. A., & Rosa, R. P. (2014). Penetration resistance according to penetration rate, cone base size and different soil conditions. Bragantia, 73(2), 171-177.
Warrick, A. W., & Nielsen, D. R. (1980). Spatial variability of soil physical properties in the field. In Hillel, D. (Ed.), Applications of soil physics (p. 319-44). New York: Academic Press.
Webster, R., & Oliver, M. A. (2007). Geoestatitic for Enviromental Scientists (2nd ed.). Chichester, England: John Wiley & Sons Ltd.
Wu, Y. H., Hung, M. C., & Patton, J. (2013).Assessment and visualization of spatial interpolation of soil pH values in farmland. Precision Agriculture, 14(6), 565-585.
Received on January 25, 2017. Accepted on May 6, 2017.