using Ward‑MLM strategy
Pablo Diego Silva Cabral(1), Taís Cristina Bastos Soares(2), Leandro Simões Azeredo Gonçalves(1),
Antonio Teixeira do Amaral Júnior(1), Andreia Barcelos Passos Lima(2), Rosana Rodrigues(1)
and Frederico de Pina Matta(2)
(1)Universidade Estadual do Norte Fluminense Darcy Ribeiro, Avenida Alberto Lamego, no 2.000, CEP 28013‑602 Campos dos Goytacazes, RJ, Brazil. E‑mail: [email protected], [email protected], [email protected] (2)Universidade Federal do Espírito Santo, Alto Universitário, s/no, Caixa Postal 16, Guararema, CEP 29500‑000 Alegre, ES, Brazil. E‑mail: [email protected], [email protected], [email protected]
Abstract – The present work aimed at evaluating the divergence among common bean accessions by their agronomic, morphological and molecular traits, based on the Ward-MLM procedure. A collection of 57 accessions from the gene bank of Universidade Federal do Espírito Santo was used in this study, from which: 31 were landraces belonging to the community Fortaleza, in the municipality of Muqui, ES, Brazil; 20 accessions were provided by Embrapa Trigo; and 6 were commercial cultivars. Five agronomic traits (plant cycle, number of seeds per pod, number of pods per plant, weight of 100 seeds, and grain yield), five morphological traits (growth habit, plant size, seed shape, seed color, and commercial group) and 16 microsatellite primers were evaluated. High genetic variability was detected considering morphological, agronomic and molecular traits in the 57 common bean accessions studied. The Ward-MLM procedure showed that the ideal number of groups was five, according to the pseudo F and pseudo t2 criteria. The accessions from Andean origin had heavier seeds than others and formed a cluster. The Ward-MLM statistical procedure is a useful technique to detect genetic divergence and to cluster genotypes by simultaneously using morphological, agronomic and molecular data.
Index terms: Phaseolus vulgaris, genetic diversity, germplasm characterization, joint analysis, molecular markers, morphological markers.
Quantificação da diversidade entre acessos de feijoeiro‑comum
com uso da estratégia Ward‑MLM
Resumo – O objetivo deste trabalho foi avaliar a divergência de acessos de feijoeiro-comum por suas características agronômicas, morfológicas e moleculares, com base no procedimento Ward-MLM. Uma coleção de 57 acessos do banco de germoplasma da Universidade Federal do Espírito Santo foi utilizada neste estudo, dos quais: 31 acessos locais, pertencentes à comunidade Fortaleza, no Município de Muqui, ES; 20 acessos fornecidos pela Embrapa Trigo; e 6 cultivares comerciais. Foram avaliados cinco caracteres agronômicos (ciclo da planta, número de sementes por vagem, número de vagens por planta, peso de 100 grãos e produtividade de grãos), cinco caracteres morfológicos (hábito de crescimento, porte da planta, formato da semente, cor da semente e grupo comercial) e 16 iniciadores microssatélites. Detectou-se ampla variabilidade genética pelos dados morfológicos, agronômicos e moleculares nos 57 acessos de feijão. O procedimento Ward-MLM mostrou que cinco foi o número ideal de grupos, de acordo com os critérios do pseudo F e pseudo t2. Os acessos de origem andina tiveram sementes mais pesadas do que os outros e ficaram em um mesmo grupo. O procedimento Ward-MLM é uma técnica útil para detectar divergência genética e agrupar genótipos pelo uso simultâneo de descritores morfológicos, agronômicos e moleculares.
Termos para indexação: Phaseolus vulgaris, diversidade genética, caracterização de germoplasma, análise conjunta, marcadores moleculares, marcadores morfológicos.
Introduction
Common bean (Phaseolus vulgaris L.) is considered one of the main sources of proteins in the Brazilian diet, with a per capita consumption higher than 17 kg year-1 (Burle et al., 2010).
productivity and quality has led these farmers to use the genetically improved cultivars available in the market
and to abandon local varieties of great significance
for agrobiodiversity. To avoid “genetic erosion”, it is necessary to collect and preserve these varieties in germplasm banks, making them available for future breeding programs (Gepts, 2006). However, the value of a germplasm bank depends on the information used to promote its use. In this sense, the characterization and evaluation of accessions of germplasm banks are very important for allowing of better knowledge about these accessions, enabling the detection of possible genotypes to be used in plant breeding programs and
the identification of possible duplicates in the gene
banks.
Accession classifications and the genetic diversity quantification in germplasm banks aim at identifying
similar groups based on separate analyses of the quantitative trais (plant height, pod weight and days
for flowering) and the qualitative ones (seed color and
seed shape, the presence or absence of a certain trait, or a molecular marker)(Mohammadi & Prasanna, 2003; Crossa & Franco, 2004; Gonçalves et al., 2009). The knowledge of the accessions in a gene bank should
be detailed to allow of the identification of different
accession sets or clusters. The data set obtained during characterization is commonly analyzed considering separate types of descriptors or variables (quantitative or qualitative). However, joint analysis simultaneously considering results from qualitative and quantitative characterization data is an interesting alternative for breeders and curators of gene banks for a better
quantification of genetic variability (Gonçalves et al.,
2009).
The modified location model (MLM), proposed
by Franco et al. (1998), is an interesting strategy to quantify the variability using quantitative and qualitative variables simultaneously. The MLM has
two stages. In the first one, the Ward clustering method (Ward Junior, 1963) defines the groups using the
dissimilarity matrix of Gower (Gower, 1971). In the second stage, the vector average of the quantitative variable is estimated by MLM procedure, for each subpopulation, regardless of the qualitative variable values. This procedure have been used for different purposes and with various crops such as maize (Gutiérrez et al., 2003; Franco et al., 2005; Ortiz et al., 2008), oilseed radish (Padilha et al., 2005), tomato
(Gonçalves et al., 2009), snap bean (Barbé et al., 2010) and pepper (Sudré et al., 2010).
The present work aimed at evaluating the divergence among common bean accessions by simultaneously using the agronomic, morphological and molecular traits, based on the Ward-MLM procedure.
Materials and Methods
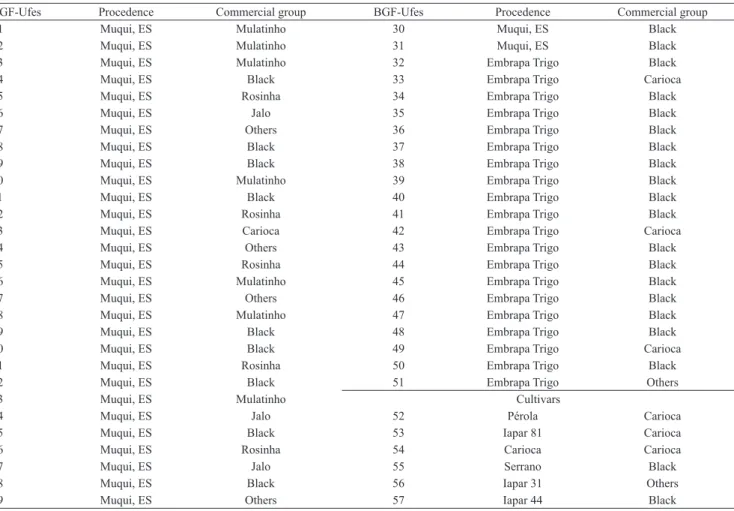
A collection of 57 common bean accessions from the gene bank of Universidade Federal do Espírito Santo (Table 1) was used in this study, from which: 31 local accessions belonging to the community Fortaleza, in the municipality of Muqui, ES, Brazil; 20 accessions provided by the Embrapa Trigo; and 6 commercial cultivars – Carioca, Serrano, Iapar 31, Iapar 44, Iapar 81 and Pérola.
The accessions were evaluated and characterized considering their morphological and agronomic descriptors. For the morphoagronomic characterization,
an experiment was carried out in field conditions in
Alegre municipality, ES, Brazil (20o45'49" S, 41o28'59"
W, 150 m altitude), in a randomized block design, with three replicates. The experimental unit was composed
of five 1.2 m length rows, spaced 0.5 m from each
other, with a seeding rate of 10 seeds per meter. First
and last rows and first and last plants of each row per
plot were considered as borders. Plants were managed in a conventional cultivation system following the crop recommendations indicated by Vieira et al. (2006), including soil preparation, pest and disease control, and harvest.
Ten descriptors were used for the morpho-agronomic
evaluation and characterization, five of which were
morphological, described as follows: growth habit (GH) – determinate bush, indeterminate bush, indeterminate prostrate, and indeterminate climber; plant size (PZ) – ranked as erect, semi-erect, and prostrate; seed shape (SS) – ranked as spherical, elliptical, oblong/short reniform, oblong/average reniform, and oblong/long reniform; seed color (SC) –
classified as uniform, and desuniform; and commercial
group (CG) – with the types White, Carioca, Jalo, Mulatinho, Black, Rosinha, Purple, and others. The
other five descriptors were agronomic characters: crop
The 57 accessions were sown in identified plastic
pots, containing commercial substrate, and placed in
a greenhouse until the first trifoliate leaves emerged. Samples of the first trifoliate leaves were collected
and immediately placed in liquid nitrogen; following,
they were identified and stored in biofreezer (‑86oC)
until DNA extraction step. The DNA extraction was carried out according to Doyle & Doyle (1987)
protocol, with modifications proposed by Abdelnoor
et al. (1995).
Sixteen pairs of SSR primers were selected for common bean (Gaitán-Solís et al., 2002; Blair et al., 2003). The criteria for the selection of these primers were the high polymorphism, SSR distribution in the linkage groups of bean consensus map – so as to achieve higher cover of the genome –, and correlation between the SSR with agronomic traits. Primer
amplification was carried out in a total volume of 15 μL, containing: MgCl2 (2.4 mmol L-1), Tris-KCl
pH 8,3 (0.25 mmol L-1), dNTP (0.25 mmol L-1 of each
nucleotide), 0.6 µmol L-1 of each primer, one unit of
Taq-polimerase, and 30 ng of DNA.
The amplifications were done in a thermocycler
Techne TC-412 (Techne, Staffordshire, UK) under the following conditions: an initial stage of 5 min at 94ºC, and 30 cycles of 1 min at 94ºC; 1 min at 50ºC, and 2
min at 72ºC; and a final stage of 10 min at 72ºC. For
the primers with two annealing temperatures, only the cycles were altered: 9 cycles at 94ºC for 20 seconds, 58ºC for 20 s, and 72ºC for 20 s; besides, 25 other cycles at 94ºC for 20 s, 60ºC for 20 s and 72ºC for 20 s.
The amplified fragments were separated by agarose
gel (3%) eletrophoresis, containing 0,02 µL mL-1
of ethidium bromide in SB1X buffer (0,04% v/v of NaOH and 0,25% v/v of boric acid), at 110 volts, for
approximately three hours. When the run was finished,
gels were photographed under ultraviolet light, using
BGF-Ufes Procedence Commercial group BGF-Ufes Procedence Commercial group
01 Muqui, ES Mulatinho 30 Muqui, ES Black
02 Muqui, ES Mulatinho 31 Muqui, ES Black
03 Muqui, ES Mulatinho 32 Embrapa Trigo Black
04 Muqui, ES Black 33 Embrapa Trigo Carioca
05 Muqui, ES Rosinha 34 Embrapa Trigo Black
06 Muqui, ES Jalo 35 Embrapa Trigo Black
07 Muqui, ES Others 36 Embrapa Trigo Black
08 Muqui, ES Black 37 Embrapa Trigo Black
09 Muqui, ES Black 38 Embrapa Trigo Black
10 Muqui, ES Mulatinho 39 Embrapa Trigo Black
11 Muqui, ES Black 40 Embrapa Trigo Black
12 Muqui, ES Rosinha 41 Embrapa Trigo Black
13 Muqui, ES Carioca 42 Embrapa Trigo Carioca
14 Muqui, ES Others 43 Embrapa Trigo Black
15 Muqui, ES Rosinha 44 Embrapa Trigo Black
16 Muqui, ES Mulatinho 45 Embrapa Trigo Black
17 Muqui, ES Others 46 Embrapa Trigo Black
18 Muqui, ES Mulatinho 47 Embrapa Trigo Black
19 Muqui, ES Black 48 Embrapa Trigo Black
20 Muqui, ES Black 49 Embrapa Trigo Carioca
21 Muqui, ES Rosinha 50 Embrapa Trigo Black
22 Muqui, ES Black 51 Embrapa Trigo Others
23 Muqui, ES Mulatinho Cultivars
24 Muqui, ES Jalo 52 Pérola Carioca
25 Muqui, ES Black 53 Iapar 81 Carioca
26 Muqui, ES Rosinha 54 Carioca Carioca
27 Muqui, ES Jalo 55 Serrano Black
28 Muqui, ES Black 56 Iapar 31 Others
29 Muqui, ES Others 57 Iapar 44 Black
Table 1. Identification, procedence and commercial group of the 57 accessions of common beans from Universidade Federal
the Biolocus L PIX photodocumentation system (Loccus Biotecnologia, São Paulo, Brazil).
The significance of the quantitative variables was first analyzed by F test, at 5% probability. As for the
molecular data, the polymorphic information content (PIC) was calculated.
Later, the quantitative and qualitative variables were analyzed simultaneously, using the Ward-MLM to compose the access groups through the cluster and IML procedures of the SAS program (SAS Institute, 2000). For the Ward clustering method, the distance matrix was provided by Gower’s algorithm (Gower,
1971). The definition of the ideal number of groups
was performed according to the pseudo F and pseudo t2 criteria (SAS Institute, 2000).
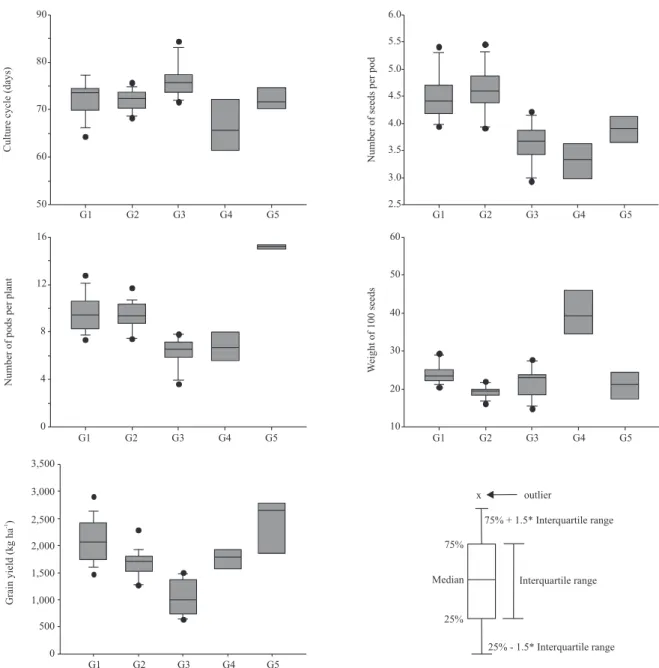
The boxplot analysis was carried out for the quantitative data to visualize the formed groups. Difference among groups, the correlation between the variables and the canonical variable were evaluated graphically using the Candisc procedure of the SAS program (SAS Institute, 2000). The distance for the distribution of the joint variables (quantitative and qualitative) proposed by Matusita (1955), adapted by Krzanowski (1983) and, later, by Franco et al. (1998), was used to determine the dissimilarity among the formed groups.
Results and Discussion
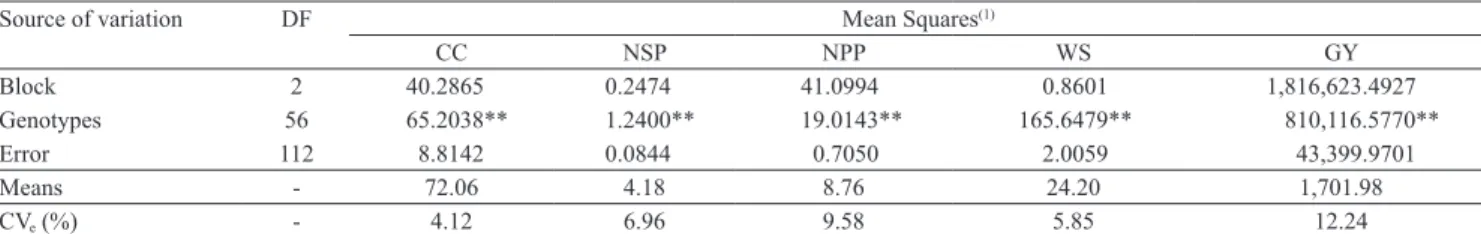
In the univariate analysis of the five quantitative variables used, a significant effect (p<0.01) was
observed for all the characters, which implies the existence of genetic variability among the studied accessions. Plant cycle, weight of 100 seeds, number of seeds per pod and number of pods per plant showed
environmental coefficient of variation (CVe) below
10%, which is considered low, indicating that these characteristics are less affected by environmental
variations (Table 2). For grain yield, the CVe was
12.24%, which is considered a medium value. In this context, the values achieved in the present work showed a good experimental accuracy, thus conferring reliability to the observed results.
Considering crop cycle, out of the 51 accessions from Embrapa Trigo and the community Fortaleza (Muqui, ES), 12 showed shorter cycles in comparison with the cultivar Carioca (69,33 days). These accessions were: BGF-51, BGF-7, BGF-27, BGF-37, BGF-25, BGF-26, BGF-48, BGF-24, BGF-30, BGF-14, BGF-21 and BGF-36, with 55.67, 61.33, 61.67, 64.33, 65.67, 65.67, 66.67, 67.67, 68.33, 68.67, 68.67, 68.67 days, respectively.
For grain yield, the accessions BGF-36, BGF-46, BGF-2, BGF-48, BGF-43 and BGF-40 had higher values, in comparison to the best performance control (Iapar 31, 2,414.40 kg ha-1), with 2,899.19, 2,768.15,
2,654.68, 2,567.17, 2,467.90 and 2,420.32 kg ha-1,
respectively. Comparing the evaluated accessions with Brazilian average grain yield of 915 kg ha-1 in
the 2008/2009 crop season, only the accessions BGF-29, BGF-8, BGF-12, BGF-13, BGF-5 and BGF-15 achieved values lower than this average. These results indicate a favorable perspective for the use of the accessions from the community Fortaleza and Embrapa Trigo in future genetic breeding programs of common bean, in the state of Espírito Santo.
The weight of 100 seeds ranged between 14.83 and 49.29 g per 100 grains, showing a wide variability among the evaluated accessions. The accessions BGF-27, BGF-6, BGF-29, BGF-26, BGF-7 and BGF-24 showed the highest values, with 49.29, 46.62, 43.53, 39.50, 39.21 and 38.57 g per 100 grains, respectively, and they are probably derived from the Andean gene pool, characterized by the predominance of cultivars with the "T" type phaseolin and larger seeds, while the Mesoamerican gene pool is characterized by
Source of variation DF Mean Squares(1)
CC NSP NPP WS GY
Block 2 40.2865 0.2474 41.0994 0.8601 1,816,623.4927
Genotypes 56 65.2038** 1.2400** 19.0143** 165.6479** 810,116.5770**
Error 112 8.8142 0.0844 0.7050 2.0059 43,399.9701
Means - 72.06 4.18 8.76 24.20 1,701.98
CVe (%) - 4.12 6.96 9.58 5.85 12.24
Table 2. Analysis of variance of the five traits evaluated in 57 accessions of common bean from the gene bank of Universidade
Federal do Espírito Santo.
cultivars with the "S" type phaseolin and smaller seeds (Gepts et al., 1986).
Concerning morphological data, 77.20% of the accessions had an indeterminate growth habit, while 12.28 and 10.52% showed indeterminate prostrate and determinate growth habit, respectively. As for plant size (PZ), 87.72% of the accessions showed erect PZ, while the accessions BGF-52, BGF-5, BGF-6 and BGF-33 had semi-erect PZ, and the accessions BGF-8, BGF-49 and BGF-54 had a prostrate PZ. As for seed
shape (SS), a wide variability was verified: 47.37%
oblong/reniform, 35.09% elliptical, 12.28% oblong/ long reniform and 5.26% oblong/average reniform. Seed color was predominantly uniform in 78.95% of the accessions.
In the commercial group classification, Black
(50.88%) predominated, followed by Carioca (12.28%), Mulatinho (12.28%), Others (10.53%), Rosinha (8.77%) and Jalo (5.26%). Fonseca et al. (2007) evaluated 122 accessions of beans, collected in 14 municipalities of the mountain region and southern
Espírito Santo, and verified the predominance of the
Black group, with 40.16%, which shows the higher acceptance of this group by producers and consumers
of that region. However, observing specifically the local
varieties of the community Fortaleza, it was found a wide variety of commercial groups cultivation: 11, 7, 5, 4, 3 and 1 accessions of the groups Black, Mulatinho, Rosinha, Others, Jalo and Carioca, respectively.
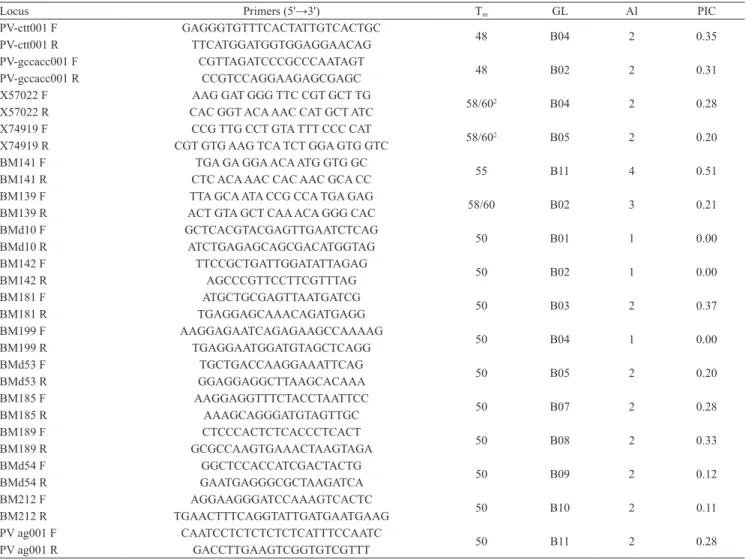
The molecular characterization of the 57 accessions showed that 13 out of the 16 evaluated primers were
Locus Primers (5'→3') Tm GL Al PIC
PV-ctt001 F GAGGGTGTTTCACTATTGTCACTGC
48 B04 2 0.35
PV-ctt001 R TTCATGGATGGTGGAGGAACAG
PV-gccacc001 F CGTTAGATCCCGCCCAATAGT
48 B02 2 0.31
PV-gccacc001 R CCGTCCAGGAAGAGCGAGC
X57022 F AAG GAT GGG TTC CGT GCT TG
58/602 B04 2 0.28
X57022 R CAC GGT ACA AAC CAT GCT ATC
X74919 F CCG TTG CCT GTA TTT CCC CAT
58/602 B05 2 0.20
X74919 R CGT GTG AAG TCA TCT GGA GTG GTC
BM141 F TGA GA GGA ACA ATG GTG GC
55 B11 4 0.51
BM141 R CTC ACA AAC CAC AAC GCA CC
BM139 F TTA GCA ATA CCG CCA TGA GAG
58/60 B02 3 0.21
BM139 R ACT GTA GCT CAA ACA GGG CAC
BMd10 F GCTCACGTACGAGTTGAATCTCAG
50 B01 1 0.00
BMd10 R ATCTGAGAGCAGCGACATGGTAG
BM142 F TTCCGCTGATTGGATATTAGAG
50 B02 1 0.00
BM142 R AGCCCGTTCCTTCGTTTAG
BM181 F ATGCTGCGAGTTAATGATCG
50 B03 2 0.37
BM181 R TGAGGAGCAAACAGATGAGG
BM199 F AAGGAGAATCAGAGAAGCCAAAAG
50 B04 1 0.00
BM199 R TGAGGAATGGATGTAGCTCAGG
BMd53 F TGCTGACCAAGGAAATTCAG
50 B05 2 0.20
BMd53 R GGAGGAGGCTTAAGCACAAA
BM185 F AAGGAGGTTTCTACCTAATTCC
50 B07 2 0.28
BM185 R AAAGCAGGGATGTAGTTGC
BM189 F CTCCCACTCTCACCCTCACT
50 B08 2 0.33
BM189 R GCGCCAAGTGAAACTAAGTAGA
BMd54 F GGCTCCACCATCGACTACTG
50 B09 2 0.12
BMd54 R GAATGAGGGCGCTAAGATCA
BM212 F AGGAAGGGATCCAAAGTCACTC
50 B10 2 0.11
BM212 R TGAACTTTCAGGTATTGATGAATGAAG
PV ag001 F CAATCCTCTCTCTCTCATTTCCAATC
50 B11 2 0.28
PV ag001 R GACCTTGAAGTCGGTGTCGTTT
polymorphic, with a total of 29 polymorphic alleles. The number of alleles per locus varied from 2 to 4, with an average of 2.23 (Table 3). The highest number of alleles was observed in the locus of the SSR BM141 primer, with 4 alleles. Similar number of alleles per locus were found in common beans by Campos et al. (2007), Hanai et al. (2007) and Kumar et al. (2009). The polymorphic information content (PIC) varied from 0 (BMd10, BM142 and BM199) to 0.51 (BM141), with 0.32 average (Table 2). Kumar et al. (2009) evaluated 115 accessions of common beans (70 Indian local varieties, 24 cultivars and 21 exotic varieties), using
17 SSR primers, and verified a PIC variation between
0 and 0.684, with 0.29 average, which agrees with the results achieved in the present work.
The Ward-MLM procedure determined that the ideal
number of groups was five, according to the pseudo F
and pseudo t2 criteria, since these parameters maximum
values were achieved at this point (Table 4). According to Mingoti (2007), the pseudo F and pseudo t2 tests,
which determine the ideal number of accessions groups in a cluster analysis, are similar to a hypothesis test in which each clustering step is related to a test to compare mean vectors of the two clusters jointed to form a new group. Nevertheless, focus should be given to larger values of pseudo F and pseudo t2, since they are related
to the least probability of test significance and rejecting the equality of means with major significance. If the
equality of mean vectors are rejected, two groups will not be united again in another different group.
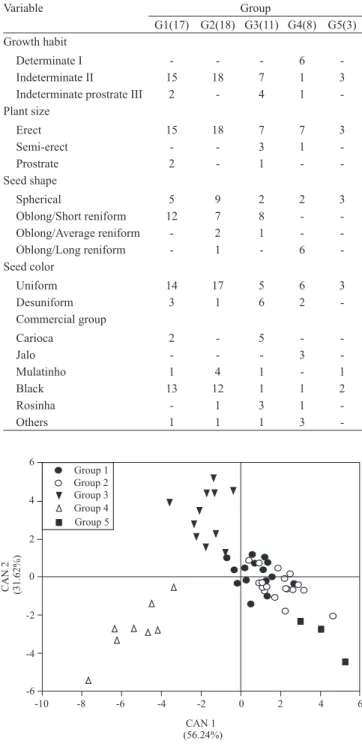
The groups 1 and 2 were formed by 61.40% of the accessions (Table 4). The group 1 was composed of 17 accessions: 12 accessions from Embrapa Trigo, three commercial cultivars (Carioca, IAPAR 31 and IAPAR 44) and two varieties of the community Fortaleza. The group 2 was composed of 18 accessions: 13 from the
community Fortaleza, four accessions from Embrapa Trigo, and one commercial cultivar (Serrano). These two groups revealed high similarity in their agronomic and morphological traits, and differences in higher magnitudes were observed in relation to weight of 100 seeds, grain yield and seed shape (Figure 1 and Table 5). As for the molecular data, a dissimilarity was observed in the bands between these groups, allowing their separation into different groups. Most accessions of the group 1 were from Embrapa Trigo, while varieties of community Fortaleza prevailed in group 2.
Group 3 was composed of 11 accessions: seven accessions from community Fortaleza, two commercial cultivars (Pérola and Carioca) and two accessions from Embrapa Trigo (Table 4). This group had the accessions with longer cycles (average of 76.09 days) and with the lowest yield (1,029.20 kg ha-1 average)
(Figure 1). As for the commercial group, the type
Carioca (five accessions) prevailed and was followed
by Rosinha, Mulatinho, Black and Others, with 3, 1, 1 and 1 accessions, respectively (Table 5). Group 4 was composed of seven accessions of community Fortaleza, and only one accession from Embrapa Trigo, and was the group with the highest average values for 100-seed weight (between 30.5 and 49.29 g per 100 grains) (Figure 1). This group also gathered only accessions that showed determined type I growth habit and oblong/long reniform seed shape (accessions BGF-7, BGF-24, BGF-25, BGF-26, BGF-27 and BGF-51). Group 5 comprised the accessions BGF-2, BGF-19 and BGF-46, which had higher number of pods per plant, with 15.23, 15.33, and 15.00, respectively (Figure 1). Accessions 3 and 51 were the most productive of all the evaluated accessions, with grain yield estimates of 2,654.69 and 2,768.15 kg ha-1, respectively.
An adequate separation of the accessions was noticed among the groups formed by simultaneously using the agronomic, morphological and molecular data with the Ward-MLM methodology. Ortiz et al. (2008) worked with 50 accessions of eight maize races from high altitude regions of Peru, with six agronomic descriptors, and concluded that the Ward-MLM
procedure soundly classifies the accessions and may be an additional refinement and a complement for the racial classification based on the visual evaluation.
Sudré et al. (2010), studied the genetic diversity of 56
Capsicum spp. accessions, using 26 morpho-agronomic
descriptors, and verified that the Ward‑MLM procedure
Groups Accessions
1 BGF-3, BGF-22, BGF-36, BGF-37, BGF-38, BGF-40, BGF-41, BGF-43, BGF-44, BGF-45, BGF-47, BGF-48, BGF-49, BGF-50, BGF-54 ('Carioca'), BGF-56 ('Iapar 31'), BGF-57 ('Iapar 44') 2 BGF-4, BGF-9, BGF-10, BGF-11, BGF-14, BGF-16, BGF-18,
BGF-20, BGF-21, BGF-23, BGF-28, BGF-30, BGF-31, BGF-32, BGF-34, BGF-35, BGF-39, BGF-55 ('Serrano')
3 BGF-1, BGF-5, BGF-8, BGF-12, BGF-13, BGF-15, BGF-17, BGF-33, BGF-42, BGF-52 ('Pérola'), BGF-53 ('Iapar 81') 4 BGF-6, BGF-7, BGF-24, BGF-25, BGF-26, BGF-27, BGF-29,
BGF-51
5 BGF-2, BGF-19, BGF-46
allowed of the separation of the species C. annuum, C. frutescens, C. baccatum and C. chinense into different groups.
The two first canonical variables explained 87.86%
of the variability between groups (Figure 2). This value indicates that the graphical representation of
the two first canonical variables is appropriate for the
visualization of the relationships among groups and among accessions inside the same group. The weight of 100 seeds showed the highest variable correlation
with the first canonical variable, followed by number
of pods per plant and number of seeds per pod, with values of -0.82, 0.73 and 0.71, respectively, while, for the second canonical variable, the highest correlation estimates occurred for crop cycle and grain yield, with 0.61 and -0.57, respectively.
Except for groups 1 and 2, all the others were separated by the graphical representation of the two
first canonical variables (Figure 2). Groups 1 and 2
revealed high similarity in their morpho-agronomic traits (Figure 1 and Table 5). Group 4 was the farthest from the other groups, possibly because the accessions
of this group are from the Andean gene pool,which has larger seeds, an important trait of this group (Figure 1). The distance between the groups agreed with the
graphic of canonical variables, and groups 1 and 2 were the closest, with distance of 5.81, while group 4 was the farthest from the other groups (Table 6).
Conclusions
1. There is genetic variability in the 57 common bean accessions studied considering the morphological, agronomic and molecular traits.
2. The Ward-MLM statistical procedure is a useful technique to detect genetic divergence and to cluster genotypes using data originated simultaneously from morpho-agronomic, agronomic and molecular descriptors.
References
ABDELNOOR, R.V.; BARROS, E.G. de; MOREIRA, M.A. Determination of genetic diversity within Brazilian soybean germplasm using random amplified polymorphic DNA techniques and comparative analysis with pedigree data. Revista Brasileira
de Genética, v.18, p.265-273, 1995.
BARBÉ, T. da C.; AMARAL JÚNIOR, A.T. do; GONÇALVES, L.S.A.; RODRIGUES, R.; SCAPIM, C.A. Association between advanced generations and genealogy in inbred lines of snap bean by the Ward‑Modified Location Model.
Euphytica, v.173, p.337-343, 2010.
BLAIR, M.W.; PEDRAZA, F.; BUENDIA, H.F.; GAITÁN-SOLÍS, E.; BEEBE, S.E.; GEPTS, P.; TOHME, J. Development of a genome-wide anchored microsatellite map for common bean (Phaseolus vulgaris L.). Theoretical and Applied Genetics, v.107, p.1362-1374, 2003.
BURLE, M.L.; FONSECA, J.R.; KAMI, J.A.; GEPTS, P. Microsatellite diversity and genetic structure among common bean (Phaseolus vulgaris L.) landraces in Brazil, a secondary center of diversity. Theoretical and Applied Genetics, v.121, p.801-813, 2010.
CAMPOS, T. de; BENCHIMOL, L.L.; CARBONELL, S.A.M.; CHIORATTO, A.F.; FORMIGHIERI, E.F.; SOUZA, A.P. de. Microsatellites for genetic studies and breeding programs in common bean. Pesquisa Agropecuária Brasileira, v.42, p.589-592, 2007.
Variable Group
G1(17) G2(18) G3(11) G4(8) G5(3) Growth habit
Determinate I - - - 6
-Indeterminate II 15 18 7 1 3
Indeterminate prostrate III 2 - 4 1 -Plant size
Erect 15 18 7 7 3
Semi-erect - - 3 1
-Prostrate 2 - 1 -
-Seed shape
Spherical 5 9 2 2 3
Oblong/Short reniform 12 7 8 -
-Oblong/Average reniform - 2 1 -
-Oblong/Long reniform - 1 - 6
-Seed color
Uniform 14 17 5 6 3
Desuniform 3 1 6 2
-Commercial group
Carioca 2 - 5 -
-Jalo - - - 3
-Mulatinho 1 4 1 - 1
Black 13 12 1 1 2
Rosinha - 1 3 1
-Others 1 1 1 3
-Groups G1 G2 G3 G4 G5
G1 - 5.81 19.20 47.33 34.98
G2 5.81 - 30.49 58.83 29.53
G3 19.20 30.49 - 50.45 83.31
G4 47.33 58.83 50.45 - 99.78
G5 34.98 29.53 83.31 99.78
-Table 5. Variables and number of accessions per group of qualitative characteristics, in each of the five groups (G1, G2, G3, G4 and G5) formed by the WARD-MLM strategy from 57 accessions of common bean.
Table 6. Distance between the groups formed by Ward-MLM, based on Franco et al. (1998).
Figure 2. Plot of the first two canonical variables of the
CROSSA, J.; FRANCO, J. Statistical methods for classifying genotypes. Euphytica, v.137, p.19-37, 2004.
DOYLE, J.J.; DOYLE, J.L. A rapid DNA isolation procedure for small quantities of fresh leaf tissue. Phytochemical Bulletin, v.19, p.11-15, 1987.
FONSECA, J.R.; MARQUES, E.M.G.; VIEIRA, E.H.N.; SILVA, H.T. Algumas características do germoplasma de feijão (Phaseolus vulgaris L.) coletado no Espírito Santo. Revista Ceres, v.54, p.358-362, 2007.
FRANCO, J.; CROSSA, J.; TABA, S.; SHANDS, H. A sampling strategy for conserving genetic diversity when forming core subsets. Crop Science, v.45, p.1035-1044, 2005.
FRANCO, J.; CROSSA, J.; VILLASEÑOR, J.; TABA, S.; EBERHART, S.A. Classifying genetic resources by categorical and continuous variables. Crop Science, v.38, p.1688-1696, 1998. GAITÁN-SOLÍS, E.; DUQUE, M.C.; EDWARDS, K.J.; TOHME, J. Microsatellite repeats in common bean (Phaseolus vulgaris L.): isolation, characterization, and cross‑species amplification in
Phaseolus ssp. Crop Science, v.42, p.2128-2136, 2002.
GEPTS, P. Plant genetic resources conservation and utilization: the accomplishments and future of a societal insurance policy. Crop
Science, v.46, p.2278-2292, 2006.
GEPTS, P.; OSBORN, T.C.; RASHKA, K.; BLISS, F.A. Phaseolin-protein variability in wild forms and landraces of the common bean (Phaseolus vulgaris L.): evidence for multiple centers of domestication. Economic Botany, v.40, p.451-468, 1986.
GONÇALVES, L.S.A.; RODRIGUES, R.; AMARAL JÚNIOR, A.T. do; KARASAWA, M.; SUDRÉ, C.P. Heirloom tomato gene bank: assessing genetic divergence based on morphological, agronomic and molecular data using Ward‑modified location model. Genetics and Molecular Research, v.8, p.364-374, 2009. GOWER, J.C. A general coefficient of similarity and some of its properties. Biometrics, v.27, p.857-874, 1971.
GUTIÉRREZ, L.; FRANCO, J.; CROSSA, J.; ABADIE, T. Comparing a preliminary racial classification with a numerical classification of the maize landraces of Uruguay. Crop Science, v.43, p.718-727, 2003.
HANAI, L.L.; CAMPOS, T. de; CAMARGO, L.E.A.; BENCHIMOL, L.L.; SOUZA, A.P.; MELOTTO, M.; CARBONELL, S.A.M.; CHIORATTO, A.F.; CONSOLI, L.;
FORMIGHIERI, E.F.; SIGUEIRA, M.V.B.M.; TSAI, S.M.; VIEIRA, M.L.C. Development, characterization, and comparative analysis of polymorphism at common bean SSR loci isolated from genic and genomic sources. Genome, v.50, p.266-277, 2007. KRZANOWSKI, W.J. Distance between populations using mixed continuous and categorical variables. Biometrika, v.70, p.235-243, 1983.
KUMAR, V.; SHARMA, S.; SHARMA, A.K.; SHARMA, S.; BHAT, K.V. Comparative analysis of diversity based on morpho-agronomic traits and microsatellite markers in common bean. Euphytica, v.170, p.249-262, 2009.
MATUSITA, K. Decision rules based on the distance, for problems of fit, two samples, and estimation. Annals of Mathematical
Statistics, v.26, p.631-640, 1955.
MINGOTI, S.A. Análise de dados através de métodos de
estatística multivariada: uma abordagem aplicada. Belo
Horizonte: UFMG, 2007. 297p.
MOHAMMADI, S.A.; PRASANNA, B.M. Analysis of genetic diversity in crop plants - salient statistical tools and considerations.
Crop Science, v.43, p.1235-1248, 2003.
ORTIZ, R.; CROSSA, J.; FRANCO, J.; SEVILLA, R.; BURGUEÑO, J. Classification of Peruvian highland maize races using plant traits. Genetic Resources and Crop Evolution, v.55, p.151-162, 2008.
PADILLA, G.; CARTEA, M.E.; RODRÍGUEZ, V.M.; ORDÁS, A. Genetic diversity in a germplasm collection of Brassica rapa subsp.
rapa L. from northwestern Spain. Euphytica, v.145, p.171-180, 2005.
SAS INSTITUTE. Statistical analysis system: user’s guide. Cary: SAS, 2000.
SUDRÉ, C.P.; GONÇALVES, L.S.A.; RODRIGUES, R.; AMARAL JÚNIOR, A.T. do; RIVA-SOUZA, E.M.; BENTO, C.S. Genetic variability in domesticated Capsicum spp. as assessed by morphological and agronomic data in mixed statistical analysis.
Genetics and Molecular Research, v.9, p.283-294, 2010.
VIEIRA, C.; PAULA JÚNIOR, T.J. de; BORÉM, A. (Ed.). Feijão. Viçosa: UFV, 2006. 600p.
WARD JUNIOR, J.H. Hierarchical grouping to optimize an objective function. Journal of the American Statistical Association, v.58, p.236-244, 1963.