Agronomic performance of the cowpea under different irrigation
depths and row spacing
1Desempenho agronômico do feijão-caupi sob diferentes lâminas de irrigação e
espaçamentos entre fileiras
Manoel de Jesus Nunes da Costa Junior2, Edson Alves Bastos3*, Milton José Cardoso3 and Aderson Soares de Andrade Júnior3
ABSTRACT - The cowpea is of great socioeconomic importance in the North, Northeast and Mid-West of Brazil, and its irrigated farming has recently been on the increase in these regions. The aim of this study was to evaluate the agronomic performance of the cowpea ‘BRS Tumucumaque’ for different row spacings and irrigation depths, under the conditions of soil and climate of Teresina, in the State of Piauí. The experiment was carried out from August to November 2014, in a Yellow Argisol at the Experimental Area of Embrapa Meio-Norte in Teresina. The experimental design was of randomised blocks in subdivided lots, with four replications. The treatments consisted of five irrigation depths (40% ETo, 70% ETo, 100% ETo, 130% ETo and 160% ETo) in the main plot, and four spacings between rows (0.36 m, 0.45 m, 0.60 m and 0.90 m) in the sub-lots. Leaf area index, pod length, number of grains per pod, number of pods per plant and grain productivity were evaluated. There was significant interaction (p<0.01) between irrigation depth and row spacing for grain productivity only. There was a significant increasing linear effect (p<0.01) from irrigation depth on pod length, number of pods per plant and number of grains per pod. The larger irrigation depths at the smaller row spacings give the greatest grain productivity. With leaf area index, there was a significant effect from irrigation depth and row spacing for the periods under evaluation.
Key words:Vigna unguiculata. Grain yield. Irrigation management. Plant density. BRS Tumucumaque.
RESUMO -O feijão-caupi possui grande importância socioeconômica nas regiões Norte, Nordeste e Centro-Oeste do Brasil e o seu cultivo irrigado tem crescido ultimamente nessas regiões. Objetivou-se avaliar o desempenho agronômico do feijão-caupi, cv. BRS Tumucumaque, em função de diferentes espaçamentos entre fileiras e lâminas de irrigação nas condições edafoclimáticas de Teresina, Piauí. O experimento foi conduzido no Campo Experimental da Embrapa Meio-Norte, em Teresina, entre agosto e novembro de 2014, em um Argissolo Amarelo. O delineamento experimental foi o de blocos casualizados em parcelas subdivididas, com quatro repetições. Os tratamentos foram compostos por cinco lâminas de irrigação (40% ETo; 70% ETo; 100% ETo; 130% ETo e 160% ETo) na parcela principal e quatro espaçamentos entre fileiras de plantas (0,36 m; 0,45 m; 0,60 m e 0,90 m) nas subparcelas. Avaliaram-se o índice de área foliar, comprimento de vagem, número de grãos por vagem, número de vagens por planta e produtividade de grãos. Houve interação significativa (p<0,01) entre as lâminas de
irrigação e os espaçamentos entre fileiras de plantas somente para produtividade de grãos. Houve efeito significativo (p<0,01)
das lâminas para o comprimento de vagem, número de vagens por planta e número de grãos por vagem, apresentando efeito linear crescente. As maiores lâminas de irrigação associadas aos menores espaçamentos entre fileiras proporcionam as maiores produtividades de grãos. Para o índice de área foliar, houve efeito significativo das lâminas de irrigação e dos espaçamentos entre fileiras para as épocas avaliadas.
Palavras-chave:Vigna unguiculata. Produtividade de grãos. Manejo de irrigação. Densidade de plantas. BRS Tumucumaque.
DOI: 10.5935/1806-6690.20170090 * Autor para correspondência
Recebido para publicação em 30/08/2016; aprovado em 10/01/2017
1Parte da Dissertação do primeiro autor apresentada no Programa de Pós-Graduação em Agronomia Produção Vegetal, da Universidade Federal do
Piauí/UFPI
2Programa de Pós-Graduação em Agronomia Produção Vegetal, Universidade Federal do Piauí, Teresina-PI, Brasil, costajr.agronomo@gmail.com 3Embrapa Meio-Norte, Av. Duque de Caxias 5650, Teresina-PI, Brasil, edson.bastos@embrapa.br, milton.cardoso@embrapa.br, aderson.
INTRODUCTION
Cultivation of the cowpea in the north and northeast of Brazil is one of the principal socioeconomic alternatives in the supply of food and generation of employment, due to its high nutritional value and low production costs, as well as helping to keep people working on the farms.
Despite its great importance, the average productivity of cowpea grain in these regions is still very low, due to the poor use of technology and the water deficit
caused by bad rainfall distribution. According to Shaoet
al. (2008), water deficit is currently the most important
problem for agriculture, and understanding the responses to this stress is of great importance in the development of strategies that would allow an improvement in the
productivity of agricultural crops (CATTIVELLI et al.,
2008; JALEELet al., 2009).
A water deficit affects the productive capacity of plants, and as the intensity of the deficit increases, various
metabolic changes occur (RIBEIRO et al., 2008) which
result in the loss of leaves (SANTANA; SOUTO, 2008). Other aspects related to water stress include a reduction in the uptake of mineral nutrients (GONZALEZ-DUGO; DURAND; GASTAL, 2010) and reduced plant growth
(BENGOUGHet al., 2011; SHAOet al., 2008).
Irrigation is one of the principal technologies for reducing the damage caused by water deficit. Various studies have shown that the cowpea is responsive to
irrigation (ANDRADE JÚNIORet al., 2014; AZEVEDO
et al., 2011; LOCATELLIet al., 2014; OLIVEIRAet al.,
2011; TAGLIAFERRE et al., 2013). However, research
into irrigation depth is necessary in order to suggest a system of rational water management with a view to optimising grain production.
In addition to irrigation, other factors can influence productive potential in the cowpea, especially plant population, as this has a marked influence on several characteristics of morphophysiology and grain yield
(BEZERRAet al., 2009).
According to Cardoso, Melo and Lima (2005), the lack or excess of plants in an area is one of the causes of low productivity of the cowpea in Brazil. For any crop, defining the optimal row spacing is essential for increasing productivity. However, the best arrangement of plants depends on the intrinsic characteristics of each variety, such as size, growth habit and plant architecture, as well as on the system of crop management.
Studies into combining row spacing with different levels of irrigation are of great importance for raising grain production in this crop. However, for the cowpea, no articles on this subject were found in the literature.
Incidentally, the effect of row spacing together with
plant density has been evaluated (BEZERRA et al.,
2009; CARDOSO; RIBEIRO, 2006) without a variation in irrigation depth being considered. Furthermore, the binomial relation of irrigation and row spacing has been little studied in other crops, a noteworthy exception being
the work of Batistaet al. (2008) with the watermelon. This
research therefore is innovative in character, and useful for a more technical system of irrigation management in the cowpea, promoting the rationalisation of water use and of agricultural inputs, as well as an increase in grain productivity.
To this effect, the aim of this work was to evaluate the effect of different irrigation depths together with different row spacings on the agronomic characteristics of the cowpea ‘BRS Tumucumaque’, under the conditions of soil and climate of Teresina, in the State of Piauí (PI).
MATERIAL AND METHODS
The experiment was carried out from August to November 2014, at the Experimental Area of Embrapa Meio-Norte, in Teresina, Piauí (05°05’S, 42°48’W, at an altitude of 74.4 m). The climate in the area according to the Thornthwaite and Mather classification (1955) is C1sA’a’, characterised as dry, sub-humid megathermic, with moderate a water surplus during the summer. The average annual relative humidity and rainfall are 72.6% and 1,343.3 mm respectively, with the main part of the rainfall concentrated from January to April (BASTOS; ANDRADE JÚNIOR, 2014). The soil of the experimental area is a eutrophic Yellow Argisol (MELO; ANDRADE JÚNIOR; PESSOA, 2014) of a sandy-loam texture, whose physical and hydraulic characteristics are described in Table 1.
In relation to the chemical characteristics at a depth of 0 to 0.2 m, the following are noteworthy:
organic matter 7.7 g kg-1, pH 6.1, base saturation 66.8%,
Pb content 34.8 mg dm-3, and levels of K+, Na+, Ca2+,
Mg2+, Al3+, H++Al3+ e CTC equal to 0.2, 0.04, 2.2, 0.5,
0.05, 1.4 and 4.5 cmolc dm-3 respectively.
The soil was prepared by cutting, ploughing and one harrowing to level the ground. Base fertilisation consisted of the application of 40 kg P2O5 ha-1 (single superphosphate)
and 40 kg of K2O ha-1 (potassium chloride). Twenty days
after seedling emergence, 20 kg N ha-1 (urea) were applied
as cover fertiliser, as the soil is sandy with less than 10 g kg-1
organic matter (EMBRAPA, 2003).
Table 1 - Physical and hydraulic characteristics of the soil in the experimental area of Embrapa
Source: Soil laboratory, Embrapa Meio-Norte. FC: field capacity. PWP: Permanent wilting point. bd: bulk density (g cm-3)
Depth (m) Granulometry (g kg-1) (% volume)
Course sand Fine sand Silt Clay FC PWP bd
0.0 – 0.2 451.8 190.4 164.5 193.3 22.0 9.3 1.4
0.2 – 0.4 471.3 180.2 168.0 178.7 20.8 11.0 1.2
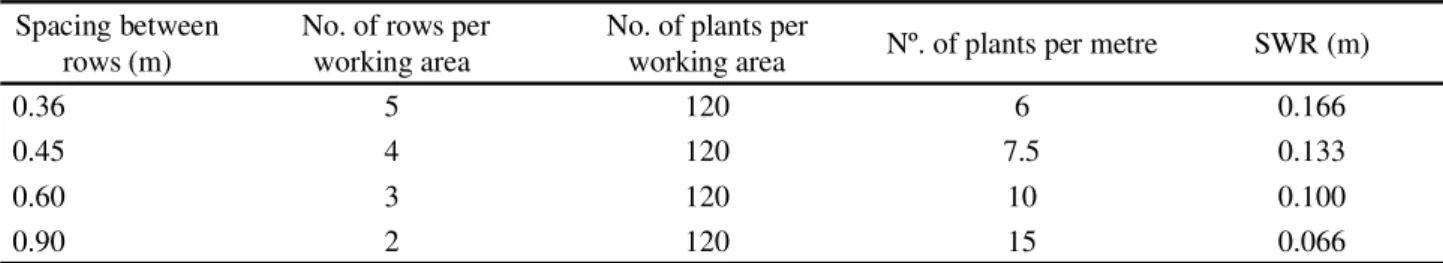
120 plants in the working area of each sub-lot. To maintain this number, it was necessary to establish a different number of rows in each working area (Table 2), since at the larger spacings there were more plants per row, and at the smaller spacings there were fewer plants per row. The desired plant population was established at 166,000 plants per hectare, which proved to be adequate for semi-erect cultivars.
The soil water content was monitored in 0.1 m layers to a depth of 0.7 m by means of a Diviner 2000® capacitor probe, with 20 PVC access tubes (four in each irrigation regime) having been installed at 15 days after sowing.
The irrigation system consisted of fixed
conventional sprinklers with a flow of around 1.6 m3
h-1 spaced 12 x 12 m apart. To quantify the irrigation
depth collected in each regime (%ETo), 16 collectors were installed, each located between four sprinklers at a spacing of 3.0 x 3.0 m, giving a total of 80 collectors in the experimental area. Before the various irrigation depths were applied, irrigation management was based on the Kc of the cowpea crop, adapted from
Bastos et al. (2008), and on the values for reference
evapotranspiration (ETo) estimated by the
Penman-Monteith method (ALLEN et al., 1998) with climate
data obtained from the automatic agricultural weather station of Embrapa Meio-Norte, located 1000 m from the experimental area. The different irrigation depths were applied from 35 days after sowing, and irrigation management was carried out according to the variation in ETo as a function of the pre-defined depths.
Table 2 - Row spacing and number of plants per working area of the cowpea ‘BRS Tumucumaque’
Spacing between rows (m)
No. of rows per working area
No. of plants per
working area Nº. of plants per metre SWR (m)
0.36 5 120 6 0.166
0.45 4 120 7.5 0.133
0.60 3 120 10 0.100
0.90 2 120 15 0.066
SWR - Plants spacing within a row
The treatments consisted of four row spacings: S1 - 0.36 m, S2 - 0.45 m, S3 - 0.60 m and S4 - 0.90 m, and five levels of irrigation: I1 - 40%, I2 - 70%, I3 - 100%, I4 - 130% and I5 - 160% of the ETo. The experimental design was of randomised blocks with four replications. The irrigation depths comprised the plots, with the row spacings comprising the sub-lots.
The following were evaluated:
a) pod length: 10 pods randomly chosen in the working area of the plot;
b) number of pods per plant: ratio between the total number of pods and the stand;
c) number of grains per pod: average of the grain counted in10 pods.
Grain weight was corrected for a moisture content
of 13%, and the actual grain productivity (kg ha-1) and the
corrected grain productivity (kg ha-1) were then calculated
as per equations 1 and 2 respectively.
PRODGatual = (1)
where:PRODGactual: actual grain productivity (kg ha-1); 10: used for converting g into kg;7.2: working area of the plot
(m2);GW: grain weight (g).
PRODG
corrected = (2)
where:PRODG
corrected: corrected grain productivity
(kg ha-1); PRODG: actual grain productivity (kg ha-1);
M
atual: initial moisture found in the grain at harvest (%);
d) leaf area index: determined weekly, immediately after applying the different treatments, from 43 to 64 days after sowing, giving a total of four readings. Two readings were taken in each sub-lot, at the centre of the working area, using the LAI-2000 portable equipment; an average value was then estimated.
The data were submitted to analysis of variance using the ASSISTAT 7.6 beta statistical software, and the means compared by the Tukey’s test. The Table Curve (2D) software was used to find the regression coefficients of the agronomic characteristics. The coefficients found were organised into Excel spreadsheets and plotted as graphs.
RESULTS AND DISCUSSION
Application of the 40, 70, 100, 130 and 160% fractions of the ETo during the crop cycle resulted in the following total irrigation depths: 198.5 mm (I1); 243.0 mm (I2); 271.3 mm (I3); 305.4 mm (I4) and 376.4 mm (I5) respectively.
From 35 DAS, with the application of the five imposed irrigation depths, it was possible to see a difference in soil moisture between the treatments, which
Figure 1 - Variation in soil water content at a depth of 0.00 – 0.20 m, from 36 to 65 days after sowing (DAS) in the cowpea for applied
irrigation depth. FC - field capacity; CM - critical moisture and PWP - permanent wilting point (%volume)
varied between 7%, imposed with the smallest irrigation depth, and below the lower limit of water availability, i.e. below the permanent wilting point (9%), and 28%, imposed by the treatment of the greatest irrigation depth, which remained above field capacity (22%) (Figure 1).
Differences in the levels of water deficit were found. It can be seen that for the smallest irrigation depths (40% and 70%), almost 100% of the water in the soil was depleted during the period when the different depths were applied, indicating a severe water deficit. Only the treatments where 130% and 160% were replaced gave a soil moisture content above critical moisture (15%), noting that the greatest irrigation depth resulted in excess moisture, as it presented values above field capacity (21%) from 47 days after sowing.
Table 3 shows a summary of the analysis of variance and the respective coefficients of variation for pod length (PL, cm), number of pods per plant (NPP), number of grains per pod (NGP) and grain productivity (GP , Kg ha-1).
Only grain productivity showed a statistical influence from the interaction between irrigation depth and
row spacing (b ≤ 0.01). The irrigation depth influenced all
Table 3 - Summary of the analysis of variance and coefficients of variation for pod length (PL, cm), number of pods per plant (NPP), number of grains per pod (NGP) and grain productivity (GP, kg ha-1), in the BRS Tumucumaque cultivar for five irrigation depths and
four row spacings
*, ** and ns - significant at 5% and 1%, and not significant respectively by F-test
row spacing significantly affected only grain yield (p ≤
0.01), as shown in Table 3. All the production components displayed a linear response to irrigation depth. The lower
values were obtained in treatments with the smaller
irrigation depths, as a result of the water deficit causing the closure of stomata, and consequently reducing the production of photoassimilates, and impairing plant growth and development. On the other hand, the increasing linear response indicates that the cowpea is highly responsive to irrigation, agreeing with results obtained by Andrade
Júnioret al. (2014), Azevedoet al. (2011) and Oliveiraet
al. (2011).
With the mean values seen for pod length as a function of irrigation depth (Figure 2), it was found that this variable fitted an increasing linear function in the BRS Tumucumaque cultivar, reaching a maximum value of 20.5 cm, very close to the mean pod length for this
cultivar, which is 21 cm, according to Freire Filhoet al.
(2009).
Mean Square
SV DF PL NPP NGP GP
Blocks 3 1.01ns 3.64ns 2.60* 347449.46**
Irrigation Depth (a) 4 10.62** 46.28** 22.48** 4212229.75**
Residual (a) 12 0.48 1.42 0.46 51123.43
Spacing (b) 3 0.66ns 0.53ns 0.35ns 254551.28**
Interraction Ta x Tb 12 0.83ns 1.71ns 0.71ns 115695.87**
Residual (b) 45 0.76 1.09 1.53 38339.36
CV (%) (a) - 3.49 28.91 5.29 23.82
CV (%) (b) - 4.40 25.47 9.67 20.63
Analysing the number of pods per plant, a positive linear response was found as a function of the applied irrigation depths, where the maximum value was 8.3 (Figure 3). Similar results were obtained by
Locatelli et al. (2014), who evaluated performance
in the cowpea under five irrigation depths, grown on straw in a Yellow Latosol, in Boa Vista in the State of Roraima. Those authors found a significant effect from irrigation depth, with a maximum value of around 12.4, 11.08 and 9.5 for the BRS Novaera, BRS Pajeú and
BRS Guariba cultivars respectively. Tagliaferre et al.
(2013) found a similar effect from water deficit on plant growth and development (SANTANA; SOUTO, 2011; SHAOet al., 2008), with a reduced number of pods per
plant. The increasing linear trend shows that the cowpea is responsive to irrigation.
There was an increasing linear effect from irrigation depth for the number of grains per pod. The values found ranged from 11.3 to 15.4 (Figure 4).
Figure 2 - Pod length for total irrigation depth in the cowpea
BRS Tumucumaque
Figure 3 - Number of pods per plant for total irrigation depth in
Lower values were obtained by Locatelliet al. (2014),
who saw a significant effect from irrigation depth in the BRS Pajeú, BRS Guariba and BRS Novaera cultivars, obtaining maximum values for NGP of 13.8, 12.3 and 7.96 respectively. The different varieties, as well as the conditions of soil and climate, may explain
these differences. Tagliaferre et al. (2013) obtained a
significant effect for NGP, with a maximum value of 11.96; results that differ from those found in this study.
Figure 4 - Number of grains per pod for total irrigation depth in
the cowpea BRS Tumucumaque
Figure 5 shows the effect of the interaction between irrigation depth and row spacing on grain productivity (GP). It can be seen that the lowest values for GP (from 300
to 500 kg ha-1) were obtained with the smallest irrigation
depths (200 to 220 mm). These results can be explained by the harmful effect of the water deficit, which reduces the number of pods per plant, the number of grains per pod and the weight of the grain, compromising the final grain yield. In this scenario of water deficit, there is little influence from row spacing, which can be seen from the small slope of the response curves. As an example, a grain
yield of 500 kg ha-1 can be obtained with an irrigation
depth of approximately 220 mm, at any spacing from 0.4 to 0.9.
On the other hand, the highest values for GP were obtained with the greatest irrigation depths at the smallest row spacings. For example, to obtain a value for GP of
over 1,500 kg ha-1, irrigation depths greater than 320 mm
should be applied at row spacings ranging from 0.4 to 0.6 m. This can be explained by the smaller row spacings having fewer plants per row, which reduces intraspecific competition and avoids self-shading, the opposite to conditions seen at the larger row spacings (greater number of plants per row, higher intraspecific competition, more self-shading and lower GP).
Similar results were obtained by Oliveira et al.
(2015), who evaluated the effect of different irrigation regimes together with different plant densities on growth and grain productivity in the BRS Itaim variety of cowpea, grown in a Red-Yellow Argisol, in Teresina PI. Those authors found a maximum value for GP of
1,668.86 kg ha-1 with an irrigation depth of 390.88 mm.
Cardoso and Ribeiro (2006), when evaluating productive performance in the cowpea ‘Rouxinol’, using three rows spacings and four plant densities, in a Yellow Argisol in Teresina PI, achieved a maximum value for grain
productivity of 1,670 kg ha-1.
results were found by Oliveira et al. (2015), where
significant reductions in the LAI were seen in treatments under a water deficit.
A quadratic effect can be seen on the LAI (Table 5) for each irrigation depth, agreeing with the results
obtained by Bastoset al. (2012), Freitaset al. (2014) and
Nascimentoet al. (2011). This effect occurs because the
cowpea, like most annual species, exhibits slow vegetative growth at the beginning of the cycle, which gradually increases, reaches a peak during the reproductive period, followed by a reduction in LAI due to leaf senescence.
With row spacing, there was a statistical significance for all periods. The different number of plants per row between these treatments probably causes different levels of self-shading, generating intraspecific competition of differing proportions, thereby influencing the results (Table 4). The LAI curves, as a function of row Table 4 - Summary of the analysis of variance for leaf area index in the BRS Tumucumaque cultivar for five irrigation depths and four row spacings
Mean Square
SV DF 43 DAS 50 DAS 57 DAS 63 DAS
Blocks 3 1.524ns 0.428ns 0.541ns 0.019*
Irrigation Depth (a) 4 1.203ns 5.061** 4.988** 0.807ns
Residual (a) 12 0.941 0.742 0.542 0.403
Spacing (b) 3 7.072** 3.281** 6.056** 1.021*
Interraction Ta x Tb 12 0.191ns 0.242ns 0.527ns 0.592ns
Residual (b) 45 0.438 0.422 0.456 0.306
CV (%) (a) - 46.99 34.24 33.62 44.71
CV (%) (b) - 32.05 25.83 30.83 38.12
*, ** and ns - significant at 5% and 1%, and not significant respectively by F-test. DAS - days after sowing
Figure 6 - Values for the leaf area index (LAI) for applied irrigation depth from 43 to 63 days after sowing in the cowpea ‘BRS Tumucumaque’
Table 5 - Regression equations for the leaf area index (LAI) as a function of different irrigation depths (I) and different row spacings (S)
Treatment Equation R2
Irrigation Depth
40% IAF = 0.6619 + 0.0583L - 0.0007L2 R2 = 0.7428*
70% IAF = 3.2455 + 0.2436L - 0.0027L2 R2 = 0.9152*
100% IAF = 29.08 + 1.2305L - 0.0119L2 R2 = 0.9944*
130% IAF = - 18.555 + 0.8323L - 0.0082L2 R2 = 0.9197*
160% IAF = - 27.992 + 1.2084L - 0.0117L2 R2 = 0.999*
Row Spacing
0,36 m IAF = - 17.092 + 0.8008E - 0.008E2 R2 = 0.9956*
0,45 m IAF = - 15.845 + 0.7444E - 0.0074E2 R2 = 0.9835*
0,60 m IAF = 15.254 + 0.6903E - 0.0067E2 R2 = 0.9975*
0,90 m IAF = - 13.999 + 0.6089E - 0.0059E2 R2 = 0.7461*
spacing (Figure 7), indicate that the smaller the spacing, the higher the values for LAI, which ranged from 1.58 to 2.9 in the treatments at a row spacing of 0.36 m, whereas at the largest spacing (0.9 m) this variation was from 1.12 to 1.96.
Figure 7 - Values for leaf area index (LAI) in the cowpea ‘BRS
Tumucumaque’ from 43 to 63 days after sowing, at each row spacing
Considering row spacing only, the regression equations (Table 5) also indicate a quadratic response of the LAI at each spacing, similar to the response of the LAI to irrigation depth, and following the same trend
as results obtained by Bastoset al. (2012), Freitaset al.
(2014) and Nascimentoet al. (2011).
CONCLUSIONS
1. The greatest irrigation depths together with the smaller row spacings give the highest values for grain productivity;
2. There is no influence from row spacing on the production components;
3. The pod length, number of pods per plant and number of grains per pod show an increasing linear effect as a function of irrigation depth.
REFERENCES
ALLEN, R. G.et al.Crop evapotranspiration: guidelines for computing crop water requirements. Roma: FAO, 1998. 328 p. (FAO. Irrigation and Drainage Papers, 56).
ANDRADE JÚNIOR, A. S. et al. Medidas de crescimento em cultivares de feijão-caupi submetidas a diferentes regimes hídricos.Comunicata Scientia, v. 5, n. 2, p. 187-195, 2014. AZEVEDO, B. M.et al. Efeito de lâminas de irrigação na cultura
do feijãoVigna de cor preta.Agropecuária Técnica, v. 32, n. 1,
p. 152-159, 2011.
BASTOS, E. A. et al. Evapotranspiração e coeficiente de
cultivo do feijão-caupi no vale do Gurguéia-PI.Irriga, v. 13, n. 2, p. 182-190, 2008.
BASTOS, E. A.et al. Parâmetros fisiológicos e produtividade de
grãos verdes do feijão-caupi sob déficit hídrico.Water Resources and Irrigation Management, v. 1, n. 1, p. 31-37, 2012.
BASTOS, E. A.; ANDRADE JÚNIOR, A. S. Boletim agrometeorológico de 2013 para o município de Teresina, Piauí. Teresina: Embrapa Meio-Norte, 2014. 38 p. (Embrapa Meio-Norte. Documentos, 228).
BATISTA, P. F.et al. Produtividade da melancia irrigada por
gotejamento submetida a diferentes espaçamentos e lâminas de irrigação.Horticultura Brasileira, v. 26, n. 2, p. S5706-S5709, 2008. CD ROM. Suplemento.
BENGOUGH, A. G.et al. Root elongation, water stress, and
mechanical impedance: a review of limiting stresses and beneficial root tip traits.Journal of Experimental Botany, v. 62, n. 1, p. 59-68, 2011.
BEZERRA, A. A. de C. et al. Características de dossel e de
rendimento em feijão-caupi ereto em diferentes densidades populacionais.Pesquisa Agropecuária Brasileira, v. 44, n. 10, p. 1239-1245, 2009.
CARDOSO, M. J.; MELO, F. de B.; LIMA, M. G. de.
Ecofisiologia e manejo de plantio.In: FREIRE FILHO, F. R.; LIMA, J. A. de A.; RIBEIRO, V. Q. (Ed.).Feijão-caupi: avanços tecnológicos.Brasília: Embrapa Informação Tecnológica, 2005. p. 212-228.
CARDOSO, M. J.; RIBEIRO, V. Q. Desempenho agronômico do feijão-caupi, cv. Rouxinol, em função de espaçamentos entre linhas e densidades de plantas sob regime de sequeiro.Revista Ciência Agronômica, v. 37, n. 1, p. 102-105, 2006.
CATTIVELLI, L.et al. Drought tolerance improvement in crop
plants: an integrated view from breeding to genomics. Field Crops Research, v. 105, n. 1/2, p. 1-14, 2008.
EMBRAPA MEIO-NORTE.Cultivo do feijão-caupi. Teresina: Embrapa Meio-Norte, 2003. 108 p. (Embrapa Meio-Norte. Sistemas de Produção, 2).
FREIRE FILHO, F. R. et al.BRS Tumucumaque: cultivar de feijão-caupi com ampla adaptação e rica em ferro e zinco. Teresina: Embrapa: Centro de Pesquisa Agropecuária do Meio-Norte, 2009. FREITAS, R. M. O. et al. Crescimento de feijão-caupi sob
efeito de veranico nos sistemas de plantio direto e convencional.
Bioscience Journal, v. 30, n. 2, p. 393-401, 2014.
JALEEL, C. A. et al. Drought stress in plants: a review on morphological characteristics and pigments composition.
International Journal of Agriculture & Biology, v. 11, n. 1, p. 100-115, 2009.
LOCATELLI, V. da E. R. et al. Componentes de produção, produtividade e eficiência da irrigação do feijão-caupi no cerrado de Roraima. Revista Brasileira de Engenharia Agrícola e Ambiental, v. 18, n. 6, p. 574-580, 2014.
MELO, F. de B.; ANDRADE JÚNIOR, A. S. de; PESSOA, B. L. de O. Levantamento, zoneamento e mapeamento pedológico detalhado da área experimental da Embrapa
Meio-Norte em Teresina, PI. Teresina: Embrapa
Meio-Norte, 2014. 47 p. (Embrapa Meio-Norte. Documentos, 231).
NASCIMENTO, S. P. et al. Tolerância ao déficit hídrico em genótipos de feijão-caupi.Revista Brasileira de Engenharia Agrícola e Ambiental, v. 15, n. 8, p. 853-860, 2011.
OLIVEIRA, G. O.et al. Resposta do feijão-caupi as lâminas de
irrigação e as doses de fósforo no cerrado de Roraima.Revista Ciência Agronômica, v. 42, n. 4, p. 872-882, 2011.
OLIVEIRA, S. R. M. et al. Interação de níveis de água e densidade de plantas no crescimento e produtividade do feijão-caupi, em Teresina – PI.Irriga, v. 20, n. 3, p. 502-513, 2015.
RIBEIRO, R. V. et al. Photochemical heat-shock response
in common bean leaves as affected by previous water deficit.
Russian Journal of Plant Physiology, v. 55, n. 3, p. 350-358, 2008.
SANTANA, J. A. S.; SOUTO, J. S. Produção de serapilheira na Caatinga da região semi- árida do Rio Grande do Norte, Brasil. Idesia, v. 29, n. 2, p. 87-94, 2011.
SHAO, H. B. et al. Water-deficit stress-induced anatomical
changes in higher plants.Comptes Rendus Biologies, v. 331, n. 1/3, p. 215-225, 2008.
TAGLIAFERRE, C.et al. Características agronômicas do
feijão-caupi inoculado em função de lâminas de irrigação e de níveis de nitrogênio.Revista Ceres, v. 60, n. 2, p. 242-248, 2013.
THORNTHWAITE, C. W.; MATHER, J. R. The water
balance. New Jersey: Drexel Institute of Technology.