Recebido em March 1, 2010 and accepted February 23, 2011. Corresponding author: [email protected]
Curtain color and lighting program in broiler production: I – general
performance
Valéria Maria Nascimento Abreu1, Paulo Giovanni de Abreu1, Arlei Coldebella1, Fátima Regina Ferreira Jaenisch1, Jonas Irineu dos Santos Filho1, Doralice Pedroso de Paiva1
1 Embrapa Suínos e Aves, BR 153, km 110, Caixa Postal 21 - 89700-000, Concórdia, Santa Catarina, Brazil.
ABSTRACT - The objective of the present study was to evaluate mortality and performance, darkling beetle population (Alphitobius diaperinus), light intensity, electrical energy consumption and economic efficiency of broilers reared under
two lighting programs (nearly continuous or intermittent) and two curtain colors (yellow or blue). The experiment was conducted between June, 2004 and May, 2005. Six flocks were sequentially housed in four 12 × 10 m broiler houses divided into 4 pens with 200 birds each. Litter was reused six times or until flock 6. Body weight and feed conversion were determined on days 21, 35, and 42 of each flock. Mortality was recorded daily. Electrical energy consumption was recorded at the end of the grow-out of each flock (every 42 days). A completely randomized design in a 6 × 2 × 2 factorial arrangement (flocks, lighting programs, curtains) with four replicates per treatment was applied. Broilers reared in houses with yellow curtains and under nearly continuous lighting programs presented the best feed conversion ratio and the highest body weight. Nearly continuous lighting programs resulted in 1.48 times more sudden deaths and 1.34 times higher general mortality when compared with intermittent lighting programs. Electrical energy consumption was 2.12 times higher in nearly continuous lighting programs in relation to intermittent lighting programs. The presence of darkling beetles was higher in broiler houses with blue curtains and intermittent lighting program. The economic analysis showed the feasibility of using a mixed system, with intermittent light program in winter and spring and nearly continuous lighting program in the summer and autumn, both in broiler houses with yellow curtains.
Key Words: Alphitobius diaperinus, economic analysis, electric energy, intermittent, lighting intensity, semi-continuous
www.sbz.org.br
Introduction
The objective of lighting programs is to regulate feed intake. Genetics, management practices, feed nutrient density, and feed intake should be taken into account when defining lighting programs for broilers (Fussel et al., 2003). According to these authors, season and latitude where the broiler houses are located should also be considered, as they interfere with day length. Types of poultry house affect lighting programs. For instance, controlled environments, such as those provided by dark houses, allow controlling lighting period during the 24 hours of the day, whereas open-sided broiler houses are subject to natural day length. According to Rutz & Bermudez (2004), regardless of house type, the principles and essential objectives of lighting programs for broilers are the same.
Different lighting schemes (continuous or intermittent) and different light intensities have been proposed to promote higher weight gain, better feed conversion ratio and carcass quality, with no metabolic changes (Rutz et al.,
2000). Continuous photoperiods include continuous (24Light:0Dark) and nearly continuous (23Light:1Dark, 16Light:8Dark) lighting programs. Long duration continuous lighting programs allow consistent access to feed during the entire day, resulting in maximum feed intake and weight gain by stimulating feed intake during regular periods. Intermittent lighting synchronizes better feed intake with feed passage through the digestive tract of broilers (Rutz & Bermudez, 2004). Moraes et al. (2007) studied the effect of lighting programs on the feeding behavior of broilers and concluded that feed intake varies according to light availability.
electric power consumption, and the economic efficiency of broiler houses equipped with yellow or blue curtains and two lighting programs (nearly continuous and intermittent).
Material and Methods
This experiment was carried out at Embrapa Suínos e Aves, Brazil, between June 24, 2004 and May 12, 2005. Six consecutive broiler flocks were reared in four broiler houses measuring 12 m × 10 m, internally divided into four pens housing 200 birds each.
A total of 19,200 Ross males was distributed according to a completely randomized experimental design in a 6 × 2 × 2 factorial arrangement [six flocks, two lighting programs (nearly continuous or intermittent) and two curtain colors (yellow or blue)], with four replicates per treatment. The first flock was housed on a new litter, which was reused by the subsequent flocks. Litter was replaced only in the brooding area. Light was provided by 60 W incandescent light bulbs. Birds were distributed according to the following combinations of lighting programs (nearly continuous = 23L:1D; intermittent: 16L:2D + 1 L + 2 D, where L = hours of light and D = hours of dark) with curtain color (yellow or blue): house 1 = blue curtain and intermittent light; house 2 = yellow curtain and intermittent light; house 3 = yellow curtain and nearly continuous light; house 4 = blue curtain and nearly continuous light.
Birds and feeds were weighed weekly, and the following parameters were evaluated: live weight, weight gain, feed intake and feed conversion ratio of broilers at 21, 35 and 42 days of age. Mortality was daily recorded and classified as ascitis, sudden death, or other causes. Total mortality was also analyzed. Electric power consumption was also recorded at flock housing and removal. Light intensity (in lux) received by birds was measured using a lux meter.
Performance data were analyzed considering the average results applying the theory of mixed models, using the effects of flock, curtain, light, age and their interactions and 15 variance and covariance matrix structures analyzed by the MIXED procedure of SAS statistical package (SAS Institute Inc., 2003), according to Xavier’s proposal (2000). The covariance matrix was chosen based on the Akaike information criterion (AIC). Mortality was analyzed by logistic regression, considering the effects of flock, light, curtain and their interactions.
Darkling beetle (Alphitobius diaperinus) population was evaluated by collecting three litter sub-samples per pen, considering three sub-habitats, as described by Safrit & Axtel (1984): close to the wall, below a tube feeder, and
in an open area, between waterer and feeder lines. Three collections were performed per flock: before housing, when the flock was 20 days of age, and immediately before flock removal. Samples were taken using a 10 cm long × 5 cm wide PVC tube vertically inserted in the litter by rotational movements. The three sub-samples were pooled in a single flask. In the laboratory, insects were identified and counted. Considering the presence of other species neglectable, only A. diaperinus adults and larvae (more than 1 mm long, visible by naked eye) were counted and preserved in 70% alcohol. Data on darkling beetle population were submitted to analysis of variance according to a completely randomized experimental design in split plots, with the curtain and light effects associated to the plot, effecrs of flock to the subplot, and effects of collection to the sub-subplot. Data were log(y+1) transformed for analysis.
Economic evaluation was done by calculating the production cost according to the methodology described by Santos Filho et al. (1999) and Canever et al. (1996). The Monte Carlo method of simulation was applied. The following random parameters were used: prices of corn and soybean meal, feed intake during the starting, growing, and finishing phases, and market weight. Corn and soybean meal prices were estimated as the average wholesale prices paid in the last five years. As the results are expressed in terms of possibilities, the choice took into consideration the three assumptions of decision-making under risk conditions (Resende Filho et al., 2000).
Results and Discussion
Feed conversion ratio and feed intake data were analyzed according to a variance and covariance matrix of first antedependence type, whereas live weight analysis used a non-structured matrix, both based on AIC value. There was a significant effect of the interaction × light × curtain × flock on all parameters studied (Table 1).
Source DF4 Live weight1 Feed intake2 Feed conversion ratio3
Flock 5 <0.0001 <0.0001 <0.0001
Light 1 0.0033 0.4511 0.0194
Light × flock 5 0.0017 0.5809 <0.0001
Curtain 1 <0.0001 0.0015 0.0014
Curtain × flock 5 0.2402 0.3119 0.6026
Light × curtain 1 0.9247 0.9610 0.9562
Light × curtain × flock 5 0.0247 <0.0001 <0.0001
Age 2 <0.0001 <0.0001 <0.0001
Age × flock 1 0 <0.0001 <0.0001 <0.0001
Age × light 2 0.0378 0.0016 0.0002
Age × light × flock 1 0 <0.0001 0.0432 <0.0001
Age × curtain 2 0.0002 0.4333 0.0012
Age × curtain × flock 1 0 0.0045 0.5152 0.0022
Age × light × curtain 2 0.0561 0.7314 0.0619
Age × light × curtain × flock 1 0 0.0017 0.0403 <0.0001
1 – non-structured; 2 – first antedependence; 3 – first antedependence; 4 – Degrees of freedom.
Table 1 - Summary of the analyses of variance of live weight, feed intake and feed conversion ratio
conventional open-sided houses, and were equipped only with ventilation fans and completely manual curtain management. After birds were 21 days, curtains remained open virtually until birds were removed. Moreover, during the hot seasons, feed withdrawal was used, particularly after week 5. When morning temperature was around 26-27 ºC, feed was withdrawn, and the feeders were filled only in the evening, when temperature was not so high. Temperature ranges were very wide, even during the same grow-out. This demonstrates the challenge of keeping internal house environment within the thermal comfort limits established for broilers rearing, as well as the effort made by birds to maintain body temperature and, at the same time, to grow. According to Abreu & Abreu (2001), optimal air temperature values are 23 ºC to 26 ºC; 20 to 23 ºC and 20 ºC for four-, five, and six-week-old broilers. The recommended relative humidity is 60 to 70%, regardless of broiler age.
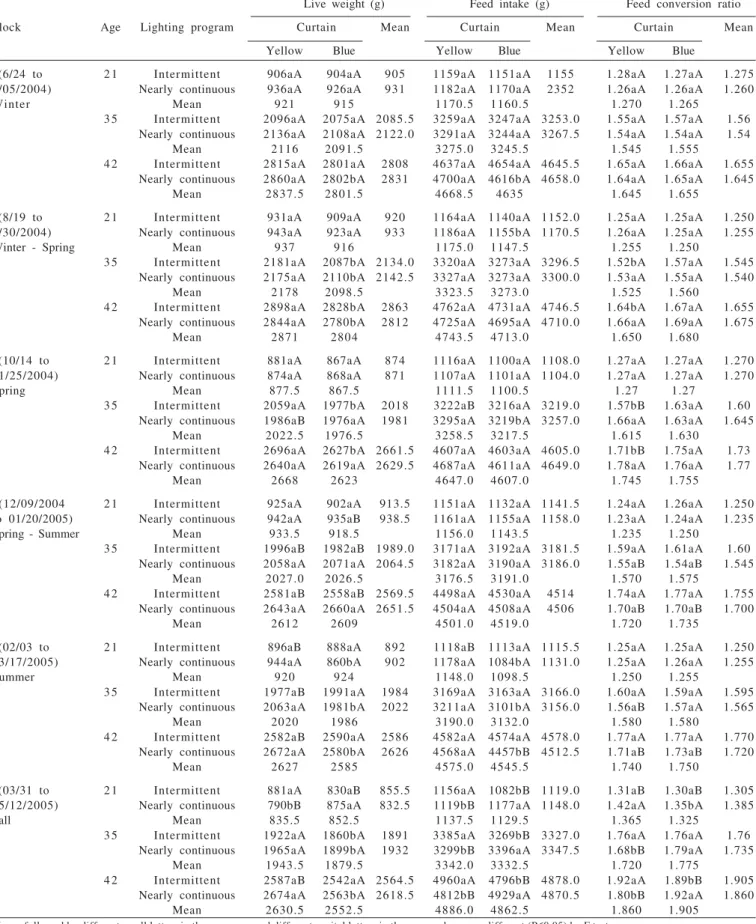
Live weight at 21 days of age in flock 5 was different (P<0.05) in broilers reared in houses with yellow curtains, where nearly continuous light promoted better live weight, and in flock 6, with the best result obtained with intermittent light. In houses with blue curtains, only flock 6 was different, with nearly continuous light promoting better live weight. Live weight at 21 days is important because at this age, brooding is completely removed. During the coldest months of the year, houses remained longer with the curtains closed, which may explain the higher effect of curtain color. In flock 6, when intermittent light was used, the best live weight results were obtained with the yellow curtain. On the other hand, when nearly continuous light was used, the best results were found in flocks reared with houses with blue curtains.
Feed intake at 21 days was different in flock 2, whose highest values were obtained with the use of nearly
continuous light and yellow curtains. In flock 5, feed intake was higher when birds were reared with nearly continuous light and yellow curtains, whereas in flock 6, birds with nearly continuous light and blue curtains and with intermittent light and yellow curtains presented higher feed intake.
Feed conversion ratio at 21 days presented significant differences only in flock 6, when both yellow and blue curtains promoted better results when lighting was intermittent (1.76), whereas with nearly continuous light, the best feed conversion ratio was found with blue curtains (1.68).
Evaluation at 35 days of age is particularly relevant to assess if growth was not normal, because compensatory growth may happen between 28 and 35 days. According to Zubair & Lesson (1996), temporary unfavorable growth conditions cause abnormal growth, but when favorable conditions are reestablished, broilers usually present growth acceleration. Therefore, those authors define compensatory growth as abnormal rapid growth.
Live weight of 35-day-old broilers was not influenced by lighting program and/or curtain color only in flock 1. In flock 2, with the use of intermittent light and nearly continuous light, birds in houses with yellow curtain presented higher live weight. In flock 3, the best result was found with intermittent light and yellow curtains. In flock 4, regardless of curtain color, the best response was obtained with nearly continuous light. In flock 5, nearly continuous light and yellow curtains also produced the best results. In flock 6, regardless of the lighting program, the best live weights were obtained by broilers reared in houses with yellow curtains.
Live weight (g) Feed intake (g) Feed conversion ratio
Flock Age Lighting program Curtain Mean Curtain Mean Curtain Mean
Yellow Blue Yellow Blue Yellow Blue
1(6/24 to 2 1 Intermittent 906aA 904aA 905 1159aA 1151aA 1155 1.28aA 1.27aA 1.275
8/05/2004) Nearly continuous 936aA 926aA 931 1182aA 1170aA 2352 1.26aA 1.26aA 1.260
Winter Mean 921 915 1170.5 1160.5 1.270 1.265
3 5 Intermittent 2096aA 2075aA 2085.5 3259aA 3247aA 3253.0 1.55aA 1.57aA 1.56
Nearly continuous 2136aA 2108aA 2122.0 3291aA 3244aA 3267.5 1.54aA 1.54aA 1.54
Mean 2116 2091.5 3275.0 3245.5 1.545 1.555
4 2 Intermittent 2815aA 2801aA 2808 4637aA 4654aA 4645.5 1.65aA 1.66aA 1.655
Nearly continuous 2860aA 2802bA 2831 4700aA 4616bA 4658.0 1.64aA 1.65aA 1.645
Mean 2837.5 2801.5 4668.5 4635 1.645 1.655
2(8/19 to 2 1 Intermittent 931aA 909aA 920 1164aA 1140aA 1152.0 1.25aA 1.25aA 1.250
9/30/2004) Nearly continuous 943aA 923aA 933 1186aA 1155bA 1170.5 1.26aA 1.25aA 1.255
Winter - Spring Mean 937 916 1175.0 1147.5 1.255 1.250
3 5 Intermittent 2181aA 2087bA 2134.0 3320aA 3273aA 3296.5 1.52bA 1.57aA 1.545
Nearly continuous 2175aA 2110bA 2142.5 3327aA 3273aA 3300.0 1.53aA 1.55aA 1.540
Mean 2178 2098.5 3323.5 3273.0 1.525 1.560
4 2 Intermittent 2898aA 2828bA 2863 4762aA 4731aA 4746.5 1.64bA 1.67aA 1.655
Nearly continuous 2844aA 2780bA 2812 4725aA 4695aA 4710.0 1.66aA 1.69aA 1.675
Mean 2871 2804 4743.5 4713.0 1.650 1.680
3(10/14 to 2 1 Intermittent 881aA 867aA 874 1116aA 1100aA 1108.0 1.27aA 1.27aA 1.270
11/25/2004) Nearly continuous 874aA 868aA 871 1107aA 1101aA 1104.0 1.27aA 1.27aA 1.270
Spring Mean 877.5 867.5 1111.5 1100.5 1.27 1.27
3 5 Intermittent 2059aA 1977bA 2018 3222aB 3216aA 3219.0 1.57bB 1.63aA 1.60
Nearly continuous 1986aB 1976aA 1981 3295aA 3219bA 3257.0 1.66aA 1.63aA 1.645
Mean 2022.5 1976.5 3258.5 3217.5 1.615 1.630
4 2 Intermittent 2696aA 2627bA 2661.5 4607aA 4603aA 4605.0 1.71bB 1.75aA 1.73
Nearly continuous 2640aA 2619aA 2629.5 4687aA 4611aA 4649.0 1.78aA 1.76aA 1.77
Mean 2668 2623 4647.0 4607.0 1.745 1.755
4(12/09/2004 2 1 Intermittent 925aA 902aA 913.5 1151aA 1132aA 1141.5 1.24aA 1.26aA 1.250
to 01/20/2005) Nearly continuous 942aA 935aB 938.5 1161aA 1155aA 1158.0 1.23aA 1.24aA 1.235
Spring - Summer Mean 933.5 918.5 1156.0 1143.5 1.235 1.250
3 5 Intermittent 1996aB 1982aB 1989.0 3171aA 3192aA 3181.5 1.59aA 1.61aA 1.60
Nearly continuous 2058aA 2071aA 2064.5 3182aA 3190aA 3186.0 1.55aB 1.54aB 1.545
Mean 2027.0 2026.5 3176.5 3191.0 1.570 1.575
4 2 Intermittent 2581aB 2558aB 2569.5 4498aA 4530aA 4514 1.74aA 1.77aA 1.755
Nearly continuous 2643aA 2660aA 2651.5 4504aA 4508aA 4506 1.70aB 1.70aB 1.700
Mean 2612 2609 4501.0 4519.0 1.720 1.735
5(02/03 to 2 1 Intermittent 896aB 888aA 892 1118aB 1113aA 1115.5 1.25aA 1.25aA 1.250
03/17/2005) Nearly continuous 944aA 860bA 902 1178aA 1084bA 1131.0 1.25aA 1.26aA 1.255
Summer Mean 920 924 1148.0 1098.5 1.250 1.255
3 5 Intermittent 1977aB 1991aA 1984 3169aA 3163aA 3166.0 1.60aA 1.59aA 1.595
Nearly continuous 2063aA 1981bA 2022 3211aA 3101bA 3156.0 1.56aB 1.57aA 1.565
Mean 2020 1986 3190.0 3132.0 1.580 1.580
4 2 Intermittent 2582aB 2590aA 2586 4582aA 4574aA 4578.0 1.77aA 1.77aA 1.770
Nearly continuous 2672aA 2580bA 2626 4568aA 4457bB 4512.5 1.71aB 1.73aB 1.720
Mean 2627 2585 4575.0 4545.5 1.740 1.750
6(03/31 to 2 1 Intermittent 881aA 830aB 855.5 1156aA 1082bB 1119.0 1.31aB 1.30aB 1.305
05/12/2005) Nearly continuous 790bB 875aA 832.5 1119bB 1177aA 1148.0 1.42aA 1.35bA 1.385
Fall Mean 835.5 852.5 1137.5 1129.5 1.365 1.325
3 5 Intermittent 1922aA 1860bA 1891 3385aA 3269bB 3327.0 1.76aA 1.76aA 1.76
Nearly continuous 1965aA 1899bA 1932 3299bB 3396aA 3347.5 1.68bB 1.79aA 1.735
Mean 1943.5 1879.5 3342.0 3332.5 1.720 1.775
4 2 Intermittent 2587aB 2542aA 2564.5 4960aA 4796bB 4878.0 1.92aA 1.89bB 1.905
Nearly continuous 2674aA 2563bA 2618.5 4812bB 4929aA 4870.5 1.80bB 1.92aA 1.860
Mean 2630.5 2552.5 4886.0 4862.5 1.860 1.905
Means followed by different small letters in the same row and different capital letters in the same column are different (P≤0.05) by F test.
continuous light promoted the highest feed intake. The same results were obtained in flock 5. In flock 6, yellow curtains with intermittent light (and vice-versa) and blue curtains with nearly continuous light (and vice-versa) promoted higher feed intake.
In flocks 2 and 3, feed conversion ratio at 35 days was obtained with intermittent light with yellow curtains, whereas in flock 4, regardless of curtain color, nearly continuous light resulted in the best feed conversion ratio. In flocks 5 and 6, the best results were obtained with yellow curtains and nearly continuous light.
Flocks were removed at 42 days, and therefore, results at this age reflect all the influences to which birds were submitted.
Live weight at 42 days presented significant differences, with the best results obtained in flock 1 with the use of nearly continuous light and yellow curtains; in flock 2, with nearly continuous light and with intermittent light and yellow curtains; in flock 3, with intermittent light and yellow curtains; in flock 4, with yellow curtains and with blue curtains and nearly continuous light; and in flocks 5 and 6, with yellow curtains and nearly continuous light.
The best feed intake results at 42 days were obtained: in flock 1, using nearly continuous light and yellow curtains; in flock 5, using blue curtains with intermittent light and nearly continuous light, with yellow curtains; and in flock 6, the highest feed intake with yellow curtains was obtained with intermittent light, and with blue curtains when nearly continuous light was used. Therefore, the results show that the intermittent lighting program associated with yellow curtains promoted higher feed intake, whereas the highest feed intake with nearly continuous light was obtained when blue curtains were used.
Feed conversion ratio at 42 days was better in flocks 2 and 3 with intermittent light and yellow curtains, and in flocks 4 and 5 with yellow or blue curtains with nearly continuous light. In flock 6, the best values were obtained with yellow curtains and nearly continuous light or with blue curtain and intermittent light. When intermittent light was used, the best feed conversion ratio was obtained with
blue curtains, but for nearly continuous light, the best results were found with yellow curtains.
Live weight and feed conversion ratio were worse as seasons became hotter. In flocks 1, 4, 5 and 6, both live weight and feed conversion ratio were better when yellow curtains were used with nearly continuous lighting program. In flocks 2 and 3, the best results were also obtained with yellow curtains, but with the intermittent lighting program. Flocks 4, 5 and 6 were reared in the hotter seasons, when there is more light during the night, and birds wait for cooler environmental temperatures to feed. These results are partially consistent with the findings of Classen (1992), quoted by Rutz et al. (2000), that continuous lighting programs allow consistent access of the birds to the feed during the whole day, thereby promoting maximum feed intake and weight gain due to feed ingestion stimulation. Buyse et al. (1996) evaluated the live performance of broilers submitted to intermittent (1 hour of light and 3 hours of dark) or nearly continuous (23 hours of light and 1 hour of darkness) lighting programs and showed that, up to 28 days of age, broiler body weight was higher with nearly continuous lighting program, but at 41 days, this difference disappeared and bird performance was similar at both programs. Renden et al. (1996) observed an effect of the lighting program on weight gain, but not on the feed efficiency of 49-day-old broilers submitted to four different lighting programs. Moraes (2007), studying the effect of lighting programs on the feeding behavior of broilers, concluded that feed intake changes according to light availability during a 24h period, and that feed intake during the night was higher in broilers under artificial light supplementation, and that birds submitted to a 23-hour photoperiod presented constant feed intake during the 24 hours of the day.
It is assumed that blue curtains promote better performance due to the lower energy expenditure resulting from lower physical activity. However, this may also result in lower performance, because as birds move less, they may not be properly fed. The curtain color results indicate that, in general, broilers reared in houses with yellow curtains had better performance.
Degrees of freedom Sudden death Ascitis Other causes Total
Flock 5 0.0027 0.4719 <.0001 0.0021
Light 1 0.0024 0.9795 0.9328 0.0485
Flock × light 5 0.9115 0.9990 0.9983 0.9496
Curtain 1 0.5134 0.9828 0.9983 0.3838
Flock × curtain 5 0.9885 0.9955 0.9618 0.9599
Light × curtain 1 0.7839 0.9883 0.9983 0.5396
Flock × light × curtain 5 0.7846 0.5977 0.9890 0.9625
Mortality causes were divided into sudden death, ascitis, other causes and total mortality per flock. There were flock and lighting program effects only on mortality rate due to sudden death and total mortality (Table 3).
Whether for live weight or feed conversion ratio, the nearly continuous lighting program was generally better, this program increased sudden death and total mortality rates (Table 4).
These findings are justified by the fact that broilers submitted to continuous lighting present very fast growth rate when young, which may cause cardiac overload, leading to heart attacks, which characterize sudden death, particularly between 30 and 40 days of age, i.e., close to flock removal. Broiler mortality at this age causes significant losses to the producers.
Moreover, the analysis showed that the nearly continuous lighting program promoted 1.48 times more mortality due to sudden death (odds ratio) and 1.34 times more total mortality (Table 5).
There was no difference in mortality due to ascitis, which is in disagreement with the findings of Buys et al. (1998) who reported that intermittent lighting program reduced the incidence of ascitis, and argued that broilers submitted to intermittent lighting program presented significant lower heat production and oxygen consumption during the period of darkness. According to Jaenisch et al. (2005), tissue oxygenation reduction triggers ascitis in broilers, i.e., the higher the bird’s oxygen requirements, the higher the chances of ascitis in broilers. Situations that increase bird metabolism, such as low temperatures, increase oxygen requirements and increase mortality due to ascitis (Jaenisch et al., 2001). According to Buyse at al. (1994), oxygen demand has been appointed as the main cause of ascitis, and therefore, the
possible lower oxygen consumption of broilers reared under intermittent light may reduce the incidence of ascitis. Classen (1996) observed that broilers submitted to long periods of dark presented better metabolic status. Therefore, the use of continuous or semi-continuous light should be questioned in broiler rearing.
When establishing a lighting program, several factors should be considered, including light intensity. According to Castello et al. (1991), birds can be seen at 0.1 Lx, but they do not perform any activity; at 1 Lx, birds can be easily managed and they present some activity, and at 5 Lx, birds can be perfectly seen, and they fully develop their activities. For this reason, Classen (1996) recommends
Mortality causes(%) Lighting program
Intermittent Nearly continuous
Sudden death 2.69b 3.91a
Ascitis 0.14a 0.24a
Other causes 0.73a 0.52a
Total mortality 4.77b 6.57a
Means followed by different letters in the same row are different (P≤0.05) by the
χ2 test.
Table 4 - Mortality rates due to sudden death, ascitis, other causes and total mortality rate as a function of lighting program
Contrast Odds ratio Pr > χ2
Intermittent × nearly continuous light (sudden death) 1.4825 0.0024
Intermittent × nearly continuous light (total mortality) 1.3437 0.0485
Table 5 - Odds ratio and χ2 test for the contrast between intermittent light and nearly continuous light for sudden death and total mortality
rates
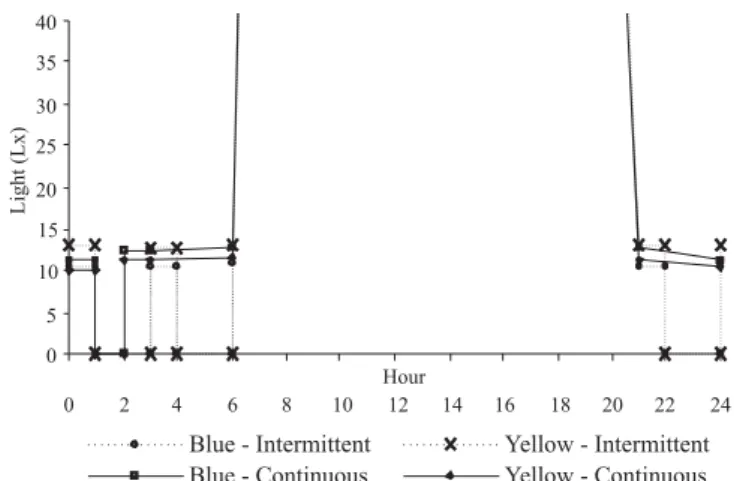
Figure 1 - Average light intensity inside the broiler houses during the 24 hours of the day.
light intensities at the height of the broiler’s eye of 20 Lx for 7 days and 5 Lx later on. Sunlight intensity varies daily with sun position, presence of clouds, pollution, and relative air humidity. Moreover, day duration changes according to the position of the Earth relative to the sun (North & Bell, 1990). In open-sided houses, there is wide variation in light intensity due to sunlight incidence (Figure 2). Because of excessive lighting during the day in open-sided houses, lighting programs should be evaluated for their efficiency during the night.
During the night, broilers received 10 to 13 Lx (Figure 1; Table 6), showing that the two 60W light bulbs distributed inside the house (120 m2 of each house) were sufficient to supply the light intensity required.
North & Bell (1990) recommend that each Watt cover 0.37 m2 of floor to supply 10 Lx of light, and to take into account lamp height and distribution, considering that light bulbs with more than 60W do not provide uniform lighting. Another factor that must be analyzed in the present study is the light intensity obtained in houses with blue curtains. The results showed that curtain color did not influence light intensity inside the houses.
Time Intermittent light Nearly continuous light
Blue curtain Yellow curtain Yellow curtain Blue curtain
House 1 House 2 House 3 House 4
0 10.4 13.0 10.2 11.3
3 10.5 12.9 11.3 12.4
6 10.8 13.1 11.6 12.7
9 397.1 468.9 465.9 425.6
1 2 624.9 718.3 728.4 659.8
1 5 599.2 627.7 626.5 581.5
1 8 242.7 234.9 212.6 204.1
2 1 10.6 13.0 11.4 12.6
2 4 10.7 13.0 10.4 11.3
Table 6 - Light intensity (Lx) inside the poultry houses as a function of lighting program and curtain color
Causes of variation Pr > F
Larvae + adults
Curtain 0.0235
Light 0.1328
Curtain × light 0.0236
Flock <0.0001
Curtain × flock 0.0004
Light × flock 0.1147
Curtain × light × flock 0.5643
Collection <0.0001
Curtain × collection 0.1583
Light × collection 0.0431
Flock × collection 0.0029
Curtain × light × collection 0.5711
Light × flock × collection 0.0777
Curtain × flock × collection 0.0777
Table 7 - Analysis of variance of the darkling beetle (A. diaperinus)
population
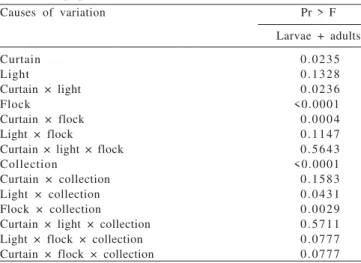
The analysis of the darkling beetle populations indicated significant effects (P<0.05) of curtain, flock, collection and of the interactions curtain × light, curtain × flock, flock × collection and light × collection (Table 7). The presence of darkling beetles was significantly higher (P<0.05) in houses with blue curtains and intermittent lighting program (Figure 3a).
Despite the significant interaction between flock and curtain color for the incidence of adult darkling beetles and for the sum of adults and larvae, significant differences (P<0.05) between curtain color were found only in flock 2 for the sum of darkling beetle adults and larvae.
The number of darkling beetles increased as litter was reused, regardless of curtain color, except in flock 5, where the number of larvae and the sum of larvae and adults decreased (Figure 3b).
After flock 3, collection 1 (pre-housing) presented significantly lower numbers of darkling beetle larvae, whereas for adults, significant differences among collections were observed only in flocks 2 and 3, with collection 3 (42 days, before broiler removal)’s flock 2 presenting higher values when compared with pre-housing and in flock 3, values higher then collection 2 (20 days). The count of the sum of darkling beetle larvae + adults in collection 1 (pre-housing) was significantly lower than in the other collections in flocks 2, 3 and 4 (Figure 3c).
Before flock 5 was housed, there was unplanned mechanical interference. A flame-thrower was used against the visible darkling beetles and significantly reduced their incidence. This mechanical action not only interrupted the evolution of the darkling beetle population, but also eradicated them efficiently. Further studies on the use of this practice in litter management among flocks should be carried out to determine its convenience and effectiveness against darkling beetles.
The decision on the lighting program should also take power consumption into consideration, which must be evaluated along with flock performance. In the present
study, average electrical energy consumption for intermittent lighting was 44 KWh and 93.16 KWh for the nearly continuous program. This program consumed, in average, 2.12 times more energy than the intermittent lighting program. This was expected, as in the nearly continuous lighting program, lights remained on 12 hours per day, in average, whereas in the intermittent program, only 6 hours. These results show the importance of performing economic analysis because, although the nearly continuous lighting program improves live weight and feed conversion ratio, it causes higher mortality due to sudden death and total mortality, and to consuming more electrical energy.
The economic results of the deterministic models, i.e., using the most probable values (Table 8), showed that, in the first three flocks, the best results, expressed in the lowest production cost, were observed when the intermittent lighting program and yellow curtains were used. This lighting program was first used in June (the first flock was housed on June 24) and last on October 14. On the other hand, for the three last flocks, the best results were obtained when the nearly continuous lighting program and yellow curtains were used.
The cost difference between lighting programs when the same curtain color is used is only due to the placement of a timer that allows changing the lighting program between two periods (winter/spring and summer/fall). The increase in energy demand due to the longer time of lighting in the nearly continuous program must also be considered.
In practical terms, broiler farmers have three different options (Table 8). If the intermittent lighting program and yellow curtains are used during the entire year, the total cost with the six flocks would be R$ 9,510.75 per metric ton. The second option is to use the nearly continuous lighting program during the entire year, with a cost of R$ 9,506.98 per metric ton for the six flocks. Finally, a mixed program could be used, alternating an intermittent lighting program and yellow curtains during winter and spring and a nearly
Flock Lighting program/curtain color
Intermittent/yellow Intermittent/blue Nearly continuous/yellow Nearly continuous/blue Mixed/yellow
1 1505.08 1512.23 1515.32 1527.28 1505.08
2 1480.87 1517.40 1530.81 1565.70 1480.87
3 1560.88 1604.32 1638.11 1628.87 1560.88
4 1613.70 1613.70 1586.52 1586.52 1586.52
5 1620.69 1620.36 1590.46 1612.87 1590.46
6 1729.54 1692.12 1645.76 1753.94 1645.76
Total 9510.75 9560.13 9506.98 9675.17 9369.56
Mixed/yellow: intermittent lighting program and yellow curtain in the winter and spring and nearly continuous lighting program and yellow curtain in the summer and fall.
continuous lighting program and yellow curtains during summer and fall, with a cost of R$ 9,369.56 per metric ton for the six flocks.
The difference between the mixed program and the intermittent program was of R$ 141.20 per metric ton, whereas it was R$ 137.42 between the mixed program and the nearly continuous program. The decision should be made as for which program provides the lowest production cost during the entire year. Using the results obtained, and considering an expected average production of 34 metric tons of chicken per flock and an average number of 6.40 flocks produced per year, it is possible to estimate an annual profit with a 1,200 m2 poultry house of R$ 4,983.88 with the use of the mixed lighting program (intermittent in winter/spring and nearly continuous in summer/fall) and yellow curtains.
The use of the Monte Carlo simulation, with 1,000 simulations, aiming to include risk analysis, confirms the results obtained with the deterministic model. Hence, the use of the mixed model proposed in the present study brings positive results both for poultry companies and for independent and contracted farmers.
Conclusions
In general, a nearly continuous lighting program and yellow curtains provide better broiler performance. However, this program causes increases in mortality rate and electrical energy consumption. On the other hand, houses with blue curtains and intermittent lighting programs have a higher population of darkling beetles. Finally, the economic analysis including the studied factors supports the recommendation of yellow curtains and intermittent lighting program during winter and spring and nearly continuous lighting program during summer and fall.
References
ABREU, V.M.N.; ABREU, P.G. Diagnóstico bioclimático para produção de aves no Oeste Paranaense. In: CONGRESSO BRASILEIRO DE ENGENHARIA AGRÍCOLA, 30., 2001. Anais... Foz do Iguaçu: CONBEA, 2001. (CD-ROM). BUYS, N.; BUYSE, J.; HASSANZADEH-LADMAKHI, M. et al.
Intermittent lighting reduces the incidence of ascites in broilers: an interaction with protein content of feed on performance and the endocrine system. Poultry Science, v.77, p.54-61, 1998. BUYSE, J.; DECUYPERE, E.; MICHELS, H. Intermittent lighting
and broiler production. Effect on energy and on nitrogen metabolism. Archiv fur Geflugelkunde, v.58, p.78-83, 1994. BUYSE, J.; SIMONS, P.C.M.; BOSHOUWERS, F.M.G. et al. Effect of intermittent lighting, light intensity and source on the
performance and welfare of broilers. World’s Poultry Science Journal, v.52, p.121-130, 1996.
CANEVER, M.D.; TALAMINI, D.J.D.; CAMPOS, A.C. et al. Custos de produção do frango de corte no Brasil e Argentina. Concórdia: EMBRAPA-CNPSA, 1996. 37p.
CASTELLO, J.A.; FRANCO, F.; GARCIA, E. Manejo de los pollos. In: __. Producción de carne de pollo. Barcelona: Tecnograf, 1991. p.112-116.
CLASSEN, H.L. Principios sobre el manejo de luz em pollos de engorde. Avicultura Professional, v.14, n.2, p.21-27, 1996. FUSSEL, L.W.; DIPLOMATE, M.A.M.; ROSSI, A. Lighting programs and Cobb 500 broiler performance. Technical Focus, v.1, p.1-4, 2003.
JAENISCH, F.R.F.; CUCCHI, V.; BITENCOURT, G. et al. Histopatologia em pulmões e corações de frangos suplementados com oxigênio durante a fase de incubação. Ciência Rural, v.35, n.3, p.633-638, 2005.
JAENISCH, F.R.F.; AVILA, V.S.; MAZZUCO, H. et al. Síndrome da hipertensão pulmonar: a ascite em frangos de corte. Concórdia: Embrapa Suínos e Aves, 2001. 16p. (Documentos, 27). MORAES, D.T.; GONZALES, M.L.; BAIÃO, N.C. et al. Efeito dos
programas de luz sobre o comportamento alimentar em frangos de corte. Revista Brasileira de Ciência Avícola, v.9, p.12, 2007 (supl. 8).
NORTH, M.O.; BELL, D. Lighting management. In: __. Commercial chicken production manual. 4.ed. London: Chapman & Hall, 1990. p.407-431.
RENDEN, J.A.; MORAN JUNIOR, E.T.; KINCAID, S.A. Lighting programs for broilers that reduce leg problems without loss of performance or yield. Poultry Science, v.75, p.1345-1350, 1996.
RESENDE FILHO, M.A.; BRAGA, M.J.; RODRIGUES, R.V. Sistemas de terminação em confinamento: perspectivas para dinamização da cadeia produtiva da carne bovina em Minas Gerais. Revista Brasileira de Economia, v.55, n.1, p.105-129, 2 0 0 1 .
RUTZ, F.; ROLL, V.F.B.; XAVIER, E. G. Manejo de luz para frangos e reprodutoras. In: CONFÊRENCIA APINCO DE CIÊNCIA E TECNOLOGIA AVÍCOLAS, 2000, Campinas. A n a i s... Campinas: FACTA, 2000. p.213-240.
RUTZ, F.; BERMUDEZ, V.L. Fundamentos de um programa de luz para frangos de corte. In: MENDES, A.A.; NAAS, I.A.; MACARI, M. (Eds.) P r o d u ç ã o d e f r a n g o s d e c o r t e. Campinas: FACTA, 2004. p.157-168.
SAFRIT, R.D.; AXTELL, R.C. Evaluations of sampling methods for darkling beetles (Alphitobius diaperinus) in the litter of turkey and broiler houses. Poultry Science, v.63, p.2368-2375, 1984.
SANTOS FILHO, J.I.; CANEVER, M.D.; CHIUCHETTA, O. et al. Aspectos econômicos e viabilidade da criação de frangos nos sistemas convencional e automatizado. In: SIMPÓSIO INTERNACIONAL DE AMBIÊNCIA E SISTEMA DE PRODUÇÃO AVÍCOLA, 1998, Concórdia. Anais... Concórdia: Embrapa Suínos e Aves, 1998. v.1. p.1-13.
STATISTICAL ANALYSES SYSTEM - SAS. System for Microsoft Windows: release 9,1. Cary: 2002-2003. (1 CD-ROM). XAVIER, L.H. M o d e l o s u n i v a r i a d o e m u l t i v a r i a d o p a r a
análise de medidas repetidas e verificação da acurácia do modelo univariado por meio de simulação. 2000. 91f. Dissertação (Mestrado em Agronomia) - Escola Superior de Agricultura “Luiz de Queiroz”, Piracicaba.