http://dx.doi.org/10.1590/1806-9061-2016-0263
Range) with some Nonlinear Models
Author(s)
Sogut BI Celik SI Ayasan TII Inci HI
I Department of Animal Science, Faculty of Agriculture, Bingol University, Turkey
II Eastern Mediterranean Agricultural Resear-ch Institute
Mail Address
Corresponding author e-mail address Dr. Bunyamin Sogut
Department of Animal Science, Fakulty of Agriculture, Bingol University Bingol/ TURKEY.
Email: [email protected]
Keywords
Breeding system, growth models, large white turkey, live weight.
Submitted: March/2016 Approved: May/2016
ABSTRACT
The objective of this study was to identify the growth curve of live weight of turkeys reared in different systems (intensive and free- range) with the best mathematical model. To achieve this goal, the live weight of male and female turkeys (Large White) reared for 0-18 weeks were used. Logistic, Gompertz, Von Bertalanffy, and Gauss were used to determine the best model for the turkeys. In comparison of the models, values of Coefficient of Determination (R2), Mean Squares of Error
(MSE) and Model Efficiency (ME) were used. In Von Bertalanffy model, the coefficient of determinations for males and females were found as 0.9974 and 0.99915 in intensive system and 0.9794 and 0.9804 in Free-Range system, respectively.
As a result of this study, because the highest R2 and the lowest MSE
were observed in Von Bertalanffy model, it was the best among the models to identify growth curve of the turkeys.
INTRODUCTION
Growth is the change in weight and body sizes of the living organism, and it is an economically important feature in livestock breeding (Alpan and Arpacık, 1998; Akçapınar and Özbeyaz, 1999). Exposure of the economic importance of the features about live weight and growth rate has aroused of scientist´s and grower´s interest, and it has increased their interest in analyzing the weight-age relationship (Ngeno et al.
2010; Rizzi et al. 2013; Eleroglu et al. 2014).
The growth of the animals is showed up as a result of complex metabolic activities thus, researchers have tried to explain numerically the growth characteristics by improving various mathematical models to express this complex biologic situation better. Obtaining the expected performance of the animals at mature ages is related to these animal´s growth and development. The changes related to the age in the growth of an animal is called the growth curve (Akbaş and colleagues, 1999; Malhado et. al., 2008; Agudelo-Gomez, 2009; Bayram and Akbulut, 2009; Prestes, 2012). Briefly, the changes shown in living growth and body sizes, based on the age, can be defined as growth curve (Goonewardene et. al. 198: Kocabaş et al., 1997). In the process of time that growth ends and the animal reaches the weight of mature living, biologic parameters which have an important place in explaining growth physically can be guessed (Behr et. al., 2001). Şengül and Kiraz (2005) have examined the growth curves of Large White turkeys, and have determined that Gompertz´s, Logistic´s, Richards´s, and Morgan-Mercer-Flodin´s models, gave nearly the same coefficient of determinations (99%).
of health of the living, to identify the age that it can be used in breeding, to identify the age of sexual maturity (Doğan, 2003), to investigate the effects of selection on growth curve parameters, etc. (Bilgin et al. 2004;
Tariq et al. 2011; Tariq et al. 2013).
The growth orbit measured as body mass and body weight is defined with proper mathematical methods relevant to growth curves, especially of poultry (Aggrey, 2002; Reddish and Lilburn, 2004; Norris et al., 2007).
Growth is an important economic feature in broiler industry, and it can be defined as the increase of body size per unit, in time (Schulze et al., 2001). The estimation of growth curve parameters can be of importance to the economy of production. Biological implications of the model parameters, and their relationship with other production features, provide a sound basis for developing a breeding strategy to modify the growth curve (Lambe et al. 2006; Abegaz
et al. 2010; Ayied et al. 2011; Saghi et al. 2012). The
growth, influenced by genetic and environmental factors, is explained by some non-linear models (Brody, Von Bertalanffy, Gompertz, Logistic, and Richard’s) (Kum et al. 2010). Briefly, studies on nonlinear growth
models provide useful information for breeding intentions (Topal et al. 2004; Keskin and Daşkıran
2007; Kucuk et al. 2008). Bayram et al. (2004) has examined the growth features of Brown Swiss and Friesian cows with only Richard´s model. Eyduran
et al. (2008) reported that Gompertz´s model was
more effective than Logistic´s, monomolecular´s and Richard´s at early phases of Kivircik and Morkaraman Breeds. Aksoy et al. (2011) denoted that the log-linear model was more appropriate than the linear model in Holstein and Brown Swiss Calves. Şahin et al. (2014) reported that the growth performance, sexual maturity age, breeding age and appropriate slaughtering age in male and female Anatolian buffalo calves, could be estimated by using Richard´s model.
The objective of this study was to examine the live weight of Large White turkeys in both genders, reared in intensive and Free-Ranged systems by some nonlinear models and, to determine the best model.
MATERIAL AND METHOD
This research was carried out in poultry facilities of Agriculture Faculty in Bingol University-Turkey. Totally 60 Large White turkey poults were divided into 2 groups (intensive and Free-with 3 replicates (10 in each).
All the groups were kept inside from 0 to 8 weeks and fed with the feed including 26-28% crude protein and 2800-2900 kcal/kg ME (NRC, 1994). The
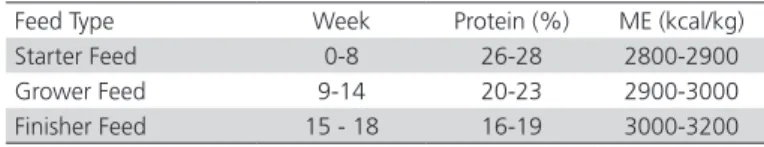
birds were fed and watered adlib. The groups reared in Intensive system were kept on the ground with litters until the end of 18 weeks fattening period. The lightening program was 23L:1D through the fattening period. Nutritional values and the values of protein and energy of feeds used in the study is shown in Table 1.
Table 1 – Values of protein and energy of feeds used in the study
Feed Type Week Protein (%) ME (kcal/kg)
Starter Feed 0-8 26-28 2800-2900
Grower Feed 9-14 20-23 2900-3000
Finisher Feed 15 - 18 16-19 3000-3200
Free-Range groups had free access to the field in the beginning of the third week, and were held until the end of the fifteenth week of age. A shelter was provided for the birds to keep away from the sunshine during the daytime. Free-Range groups did not receive the concentrated feed during the grazing. The compositions of the grass grazed by the birds were of plants like clover, grass, trefoil, vetch, wheat and barley. After the fifteenth day of fattening, the turkeys were fed the same ration as the indoor groups until the eighteenth weeks of age. The study was carried out between June and October 2014. The birds were wing banded at the beginning of the trail and weighted weekly.
Feeding with intensive and free-range system affected fattening performance of turkeys. Grow growth is also affected by gender. For this reason, the birds were separated by gender and feeding systems and turkeys used in this study were not evaluated all together. This has already been said in the previous sentence.
Von Bertalanffy, Logistic, Gompertz and Gauss models were applied in the weekly analyses of live weights of turkeys in the study.
Von Bertalanffy´s growth model is as shown below;
Y = A *(1- b *e
t -kt 3)
and it has been presented by Von Bertalanffy (1934) with three-parameters, and improved by Beverton & Holt (1957).
Logistic´s growth model is expressed as (Graybill & Iyer, 1994);
Y = A /(1+ e
)
t
-(b+kt)
Gompertz´s growth model is expressed as (Winsor, 1932);
Y = A *e
t-be-kt
Gauss´ growth model is expressed as (Norusis, 2005);
Y = A *(1-ke
)
t
Here,
Y
t is: the weight observed in the age; A is:
the asymptotic limit of weight while the age goes to infinity; that is, the highest weight that an animal can reach. This parameter which shows the mature live weight is guessed as the same in all growth curve models; b: the rate of the first weight achieved after birth to mature weight; k is: the speed of getting mature; that is, the speed of the approach of live weight to mature age. The value of e=2.71828 is the base of logarithm. Measures such as coefficient of determination (
R
2). AdjustR
2, error mean squares (MSE) and model efficiency, are used in comparing the effectiveness of models impending the observed valueY
t and expected value
Y = E(Y X )
tˆ
t t .Coefficient of determination (
R
2) is;∑
∑
R =
RKT
GKT
=
(Y - Y)
(Y - Y)
2 t 2 t=1 n t 2 t=1 nˆ
It is the total of RKT: Regression mean squares and GKT: General mean squares. The values of Coefficient of determination is between 0-1. As the value approaches to 1, the consistency of the model increases.
Coefficient of determination (Adjust-
R
2) is;(
)
= −
−
−
−
R
R
n
n
k
1 1
1
2 2
as defined (Gujarati, 2003). Here, n is: number of observation, k: number of parameter.
Error mean squares (MSE) is showed as;
=
MSE
SSE
n
SSE: Error sum of squares; n: Observation (Seber & Wild, 1989).
Model efficiency (ME) is expressed as:
∑
∑
ME =
1-(Y - Y )
(Y - Y)
t t 2 t=1 n t 2 t=1 n
ˆ
Y
tˆ
: Expected value,Y
t: observed value. The
efficiency value of the model should be up to 90% for being efficient (Mohanty & Painuli, 2004).
Durbin-Watson statistics (Ünver et al. 2011); e
i: Residuals;
∑
∑
(
)
=
=−
− =DW
e
e
e
i n i i i n i 2 1 2 1 2Akaike Information Criterion (AIC),
σ
AIC = nln(
ˆ
2)+2M
Schwartz Bayesian Criterion (SBC);
σ
SBC = nln(
ˆ
2)+ Mln(n)
as defined (Wei, 2006). Here,
σ
ˆ
2is the maximum likelihood of
σ
, M is the number of parameters in the model, and n is the effective number of observations.A, B and k parameters, were determined as a result of Levenberg Marquardt iteration technique by using SPSS 22.0 statistical program. While iteration was done, 1.0E-8 was used as convergence criteria (Akbaş
et al. 2001).
In comparing the models, the measures of coefficient of determination (R2), Error mean squares
(MSE) which shows the difference between the points belongs to true growth and growth curve determined to the model, and model efficiency were used.
RESULTS AND DISCUSSION
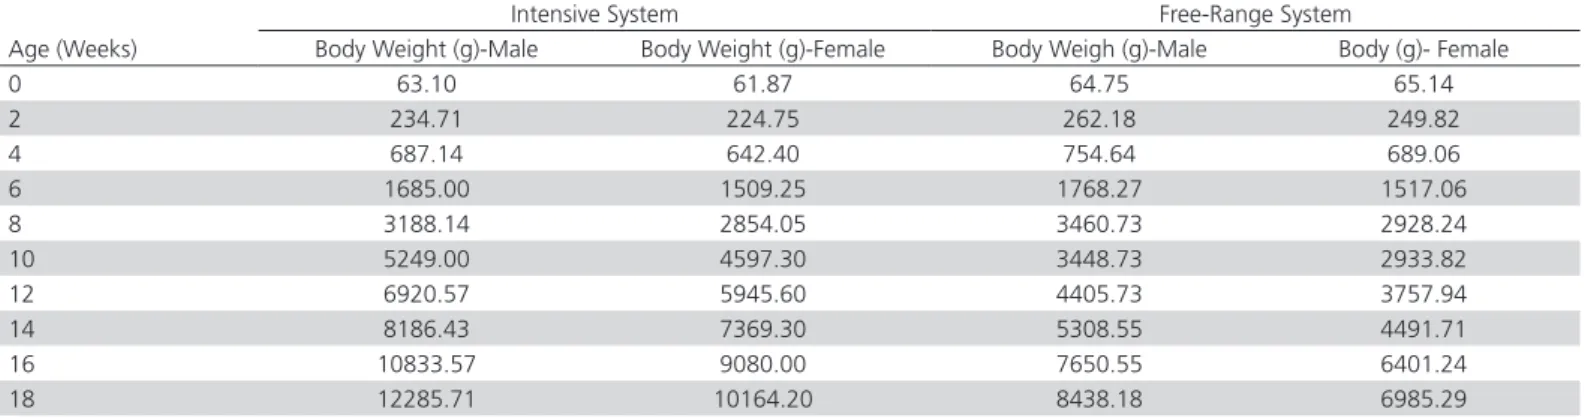
Live weight averages of male and female turkeys in the weeks of 0-18 is shown in Table 2.
Table 2 – Live weights (g) of male and female turkey´s growth in Intensive and free-range systems according to the weeks
Intensive System Free-Range System
Age (Weeks) Body Weight (g)-Male Body Weight (g)-Female Body Weigh (g)-Male Body (g)- Female
0 63.10 61.87 64.75 65.14
2 234.71 224.75 262.18 249.82
4 687.14 642.40 754.64 689.06
6 1685.00 1509.25 1768.27 1517.06
8 3188.14 2854.05 3460.73 2928.24
10 5249.00 4597.30 3448.73 2933.82
12 6920.57 5945.60 4405.73 3757.94
14 8186.43 7369.30 5308.55 4491.71
16 10833.57 9080.00 7650.55 6401.24
Hatching weight for male and female birds were 63.10 and 61.87g in commercial groups, 64.75 and 65.14 g in Free-Range groups, respectively. While the live weights of the turkeys for male and female were 12285.71 and 10164.20 g in commercial groups, and 8438.18 g and 6985.29 g in Free-Range groups at the end of the trail, respectively.
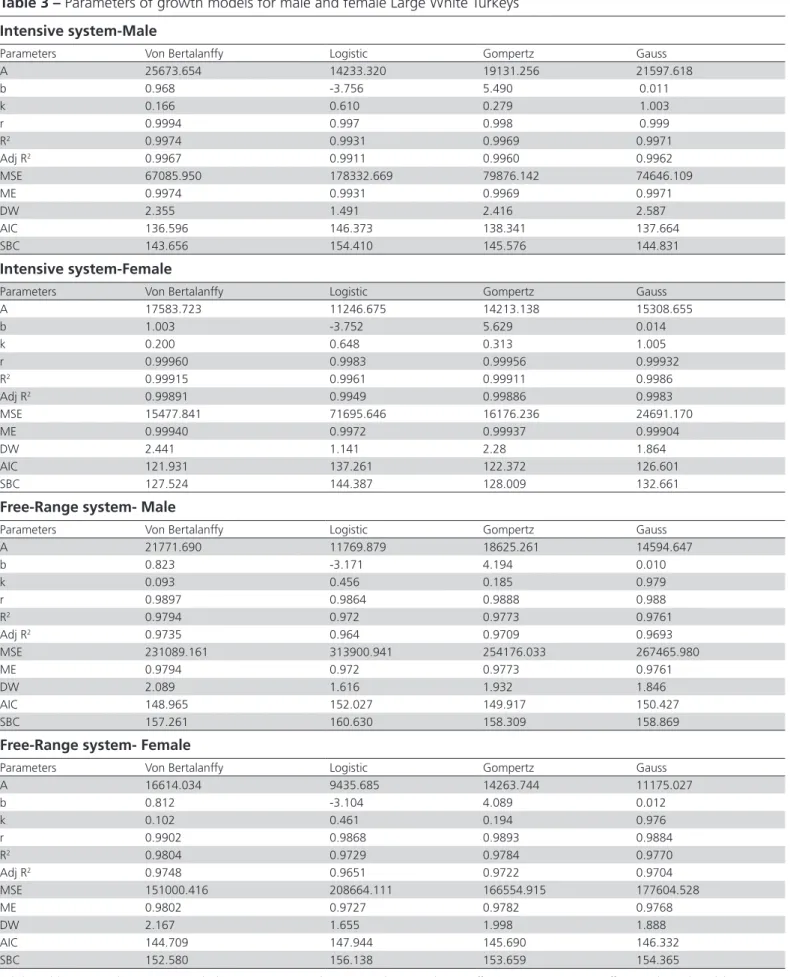
Live weight values of turkeys were comparatively observed by Von Bertalanffy, Logistic, Gompertz and Gauss models, and the results are shown in Table 3.
As it is seen in Table 3, the turkeys raised in intensive system had the values of Error mean squares (MSE) = 67085.950, Coefficient of correlation (r) = 0.9994, and growth speed =0.166 g according to Von Bertalannffy´s model. Determination coefficients (R2)
=0.9974, Adjusted-R2=0.9967, Model efficiency (ME)
=0.9974, DW=2.335, AIC=136.596 and SBC=143.656. According to the results obtained with the Logistic´s model were MSE=178332.669, r=0.997 and growth speed 0.610 g. R2=0.996, Adj-R2=0.994, ME=0.990,
DW=1.491, AIC=146.373 and SBC=154.410. The results obtained with Gompertz´s model were MSE=79876.142, r=0.998 and growth speed 0.279 g. R2=0.9969, Adj-R2=0.9960, and ME=0.9969,
DW=2.416, AIC=138.341 and SBC=145.576. The results obtained with Gauss´s model were MSE=74646.109, r=0.999 and growth speed 0.011 g, R2=0.9971, Adj-R2=0.9962, and ME=0.9971,
DW=2.587, AIC=137.664 and SBC=144.831.
In female turkeys grown in intensive system; in Von Bertalannffy´s model, the results were calculated as MSE=15477.841, r=0.99960, the growth speed=0.200 g. R2=0.99915, Adjusted-R2=0.99891, model
efficiency (ME) =0.99940, DW=2.441, AIC=121.931 and SBC=127.524. In Logistic´s model, the results were calculated as MSE=71695.646, r=0.9983, and the growth speed= 0.648 g. R2 =0.9961, Adj- R2=0.9949,
and ME=0.9972, DW=1.141, AIC=137.261 and SBC=144.387. In Gompertz´s model, the results were calculated as MSE=16176.236, r=0.99956, and the growth speed= 0.313 g. R2=0.99911, Adj- R2=0.99886,
and ME=0.99937, DW=2.280, AIC=122.372 and SBC=128.009. In Gauss´s model, the results were calculated as MSE=24691.170, r=0.99932, and the growth speed=0.014 g. R2=0.9986, Adj- R2=0.9983,
and ME=0.99904, DW=1.864, AIC=126.601 and SBC=132.661.
According to the Gompertz´s model, growth speeds in different studies were 0.2137 in male partridges and 0.2255 in female partridges (Çetin et. al., 2007); 0.010 in sheep (Tariq et al., 2013), 0.218 in male calves and 0.309 in female calves (Şahin et al. (2014), 0.010 in
female Anatolian buffalo and 0.007 in male Anatolian buffalo (Sosyal et al. 2015). According to the Von
Bertalanffy´s model, the growth speeds were 0.0044 in sheep (Tariq et al., 2013) and 0.005 in male buffalo and 0.012 in female buffalo (Soysal et al. 2015).
In Von Bertalannffy´s model, male turkeys reared in Free-Range system the results were found as follow; MSE= 231089.161, r=0.9897 and growth speed= 0.093, R2=0.9794, adjusted-R2=0.9735, model
efficiency (ME) =0.9794, DW=2.089, AIC=148.965 and SBC=157.261. In the results obtained in Logistic´s model, MSE=313900.941, r=0.9897, growth speed = 0.456 g, R2=0.972, Adj- R2=0.964, ME=0.972,
DW=1.616, AIC=152.027 and SBC=160.630. According to Gompertz´s model, the results were; MSE =254176.033, r=0.9888, and the growth speed= 0.185g, R2=0.9773, Adj- R2=0.9709, ME= 0.9773,
DW=1.932, AIC=149.917 and SBC=158.309. In Gauss´s model, the results were; MSE=267465.980, r=0.988, and the growth speed is found as 0.010 g. R2=0.9761, Adj-R2=0.9693, ME= 0.9761, DW=1.846,
AIC=150.427 and SBC=158.869.
In Von Bertalannffy´s model for female turkeys reared in Free-Range system, the results were; MSE is 151000.416, r= 0.9902, and the growth speed=0.102g, R2 =0.9804, Adjusted-R2 = 0.9748,
model efficiency (ME)=0.9802, DW=2.167, AIC=144.709 and SBC=152.580. In Logistic´s model; MSE=208664.111, r= 0.9868, and growth speed=0.461, R2 =0.9729, Adj-R2 =0.9651, ME=
0.9727, DW=1.655, AIC=147.944 and SBC=156.138. In Gompertz´s model; MSE=166554.915, r= 0.9893, and growth speed= 0.194 g, R2 = 0.9784, Adj-R2 =
0.9722, ME= 0.9782, DW=1.998, AIC=145.690 and SBC=153.659. In Gauss´s model; MSE= 177604.528, r= 0.9884, growth speed= 0.012 g, R2 = 0.977, Adj-
R2 = 0.9704, ME=0.9768, DW=1.888, AIC=146.332
and SBC=154.365. In all models, the most appropriate model, in which MSE value is the least, was selected.
Table 3 – Parameters of growth models for male and female Large White Turkeys
Intensive system-Male
Parameters Von Bertalanffy Logistic Gompertz Gauss
A 25673.654 14233.320 19131.256 21597.618
b 0.968 -3.756 5.490 0.011
k 0.166 0.610 0.279 1.003
r 0.9994 0.997 0.998 0.999
R2 0.9974 0.9931 0.9969 0.9971
Adj R2 0.9967 0.9911 0.9960 0.9962
MSE 67085.950 178332.669 79876.142 74646.109
ME 0.9974 0.9931 0.9969 0.9971
DW 2.355 1.491 2.416 2.587
AIC 136.596 146.373 138.341 137.664
SBC 143.656 154.410 145.576 144.831
Intensive system-Female
Parameters Von Bertalanffy Logistic Gompertz Gauss
A 17583.723 11246.675 14213.138 15308.655
b 1.003 -3.752 5.629 0.014
k 0.200 0.648 0.313 1.005
r 0.99960 0.9983 0.99956 0.99932
R2 0.99915 0.9961 0.99911 0.9986
Adj R2 0.99891 0.9949 0.99886 0.9983
MSE 15477.841 71695.646 16176.236 24691.170
ME 0.99940 0.9972 0.99937 0.99904
DW 2.441 1.141 2.28 1.864
AIC 121.931 137.261 122.372 126.601
SBC 127.524 144.387 128.009 132.661
Free-Range system- Male
Parameters Von Bertalanffy Logistic Gompertz Gauss
A 21771.690 11769.879 18625.261 14594.647
b 0.823 -3.171 4.194 0.010
k 0.093 0.456 0.185 0.979
r 0.9897 0.9864 0.9888 0.988
R2 0.9794 0.972 0.9773 0.9761
Adj R2 0.9735 0.964 0.9709 0.9693
MSE 231089.161 313900.941 254176.033 267465.980
ME 0.9794 0.972 0.9773 0.9761
DW 2.089 1.616 1.932 1.846
AIC 148.965 152.027 149.917 150.427
SBC 157.261 160.630 158.309 158.869
Free-Range system- Female
Parameters Von Bertalanffy Logistic Gompertz Gauss
A 16614.034 9435.685 14263.744 11175.027
b 0.812 -3.104 4.089 0.012
k 0.102 0.461 0.194 0.976
r 0.9902 0.9868 0.9893 0.9884
R2 0.9804 0.9729 0.9784 0.9770
Adj R2 0.9748 0.9651 0.9722 0.9704
MSE 151000.416 208664.111 166554.915 177604.528
ME 0.9802 0.9727 0.9782 0.9768
DW 2.167 1.655 1.998 1.888
AIC 144.709 147.944 145.690 146.332
SBC 152.580 156.138 153.659 154.365
A, b, k: Model parameters, (A: Asymptotic weight; b: Integration constant, k: Maturing index, r: Correlation coefficients, R2: Determination coefficients, Adj R2: Adjusted determination
When we compare growth models of male turkeys reared in Intensive system, the values for Von Bertalanffy´s, Logistic´s, Gompertz´s, and Gauss´s models were; MSE=67085.950, 178332.669, 79876.142, and 74646.109; coefficient of determinations (R2)=0.9974,
0.9931, 0.9969, and 0.9971; adjusted coefficient of determinations (Adjust-R2)= 0.9967, 0.9911, 0.9960,
and 0.9962, respectively. Again for the same models and in the same order; ME were 0.9967, 0.9911, 0.9960, and 0.9962. DW were 2.355, 1.491, 2.416, and 2.587; AIC were 136.596, 146.373, 138.341, and 137.664; SBC were 143.656, 154.410, 145.576, and 144.831, respectively. Von Bertalanffy´s model had the lowest MSE AIC and SBC values, and highest R2,
Adj-R2, and ME values; and Logistic´s model was the
one which had the highest MSE, AIC and SBC values and the lowest R2, Adj-R2, and ME values. Thus, the
most relevant model for estimation of growth curve was Von Bertalanffy´s growth model. In other words, it was determined that Von Bertalanffy´s growth model identifies the growth curve of male turkeys in intensive breeding system best, and Logistic´s model identifies the growth curve the least.
Comparing growth models for female turkeys reared in intensive system, the values for Von Bertalanffy´s, Logistic´s, Gompertz´s, and Gauss´ models were; MSE=15477.841, 71695.646, 16176.236, and 24691.170; coefficient of determinations (R2)=
0.99915, 0.9961, 0.99911, and 0.9986; adjusted
coefficient of determinations (Adjust-R2)= 0.99891,
0.9949, 0.99886, and 0.9983, respectively. Again for the same models in same order; ME= 0.9994, 0.9972, 0.9993, and 0.99904. DW were 2.441, 1.141, 2.280 and 1.864; AIC were 121.931, 137.261, 122.372 and 126.601; SBC were 127.524, 144.387, 128.009 and 132.661, respectively. Von Bertalanffy´s model had the lowest MSE, AIC and SBC values and highest R2, Adj-R2, and ME values; and Logistic´s
model was the one which had the highest MSE, AIC and SBC values and the lowest R2, Adj-R2, and ME
values. Thus, the most relevant model for estimation of growth curve of female turkeys was seen in Von Bertalanffy´s growth model. In other words, the best model was Von Bertalanffy´s model and the worst one was Logistic´s model for female turkeys in intensive breeding system. The results obtained in coefficient of determinations in accordance with the results of approximate (0.99) coefficient of determinations were Gompertz´s, Logistic´s, Richard´s and Morgan-Mercer-Flodin´s models in growth curves of Large White turkeys.
When we compare growth models for male turkeys reared in Free-Range system, the calculated values for Von Bertalanffy´s, Logistic´s, Gompertz´s, and Gauss´ models were; MSE=231089.161, 313900.941, 254176.033, and 267465.980; coefficient of determinations (R2)= 0.9794, 0.972, 0.9773, and
0.9761; adjusted coefficient of determinations
Table 4 – Functions belonging to growth curves of turkeys
Intensive system
Models Functions
Male Female
Von Bertalanffy
Y = 25673.654(1- 0.968e
-0.166t 3)
Y = 17583.723(1-1.003e
-0.200t 3)
Logistic
Y = 14233.320/(1+ e
-3.756+0.610t)
Y = 11246.675/(1+ e
-3.752+0.648t)
Gompertz -5.490e-0.279t
Y = 19131.256(e
)
Y = 14213.138(e
-5.629e-0.313t)
Gauss -0.011t2
Y = 21597.618(1-1.003e
)
Y = 15308.655(1-1.005e
-0.014t2)
Free-Range system
Model Function
Male Female
Von Bertalanffy
Y = 21771.690(1- 823e
-0.093t 3)
Y = 16614.034(1- 812e
-0.102t 3)
Logistic
Y = 11769.879/(1+ e
-3.171+0.456t)
Y = 9435.685/(1+ e
-3.104+0.461t)
Gompertz
Y = 18625.261(e
-4.194e-0.185t)
Y = 14263.744(e
-4.089e-0.194t)
Gauss -0.010t2
(Adjust-R2)= 0.9735, 0.964, 0.9709, and 0.9693,
respectively. Again for the same models in same order, ME were 0.9794, 0.972, 0.9773, and 0.9761. DW were 2.089, 1.616, 1.932 and 1.846; AIC were 148.965, 152.027, 149.917 and 150.427; SBC were 157.261, 160.630, 158.309 and 158.869, respectively. Von Bertalanffy´s model had the lowest MSE, AIC and SBC values and highest R2, Adj-R2, and ME values; however,
Logistic´s model had the highest MSE, AIC and SBC values and the lowest R2, Adj-R2, and ME values. In
other words, Von Bertalanffy´s growth model best identifies growth curve values and Logistic´s model identifies the growth curves the least for male turkeys reared in Free-Range system.
When we compare growth models for female turkeys, the calculated values for Von Bertalanffy, Logistic, Gompertz, and Gauss models were: MSE=151000.416, 208664.111, 166554.915, and 177604.528; coefficient of determinations (R2) =
0.9804, 0.9729, 0.9784, and 0.9770; adjusted coefficient of determinations (Adjust-R2) = 0.9748,
0.9651, 0.9722, and 0.9704, respectively. For the same models in the same order, ME= 0.9802, 0.9727, 0.9782, and 0.9768. DW were 2.167, 1.655, 1.998 and 1.888; AIC were 144.709, 147.944, 145.690 and 146.332; SBC were 152.580, 156.138, 153.659 and 154.365, respectively. Von Bertalanffy model had the lowest MSE, AIC and SBC values and highest R2,
Adj-R2, and ME values; but Logistic model had the
highest MSE, AIC and SBC values and the lowest R2,
Adj-R2, and ME values. Thus, the most relevant model
for estimation of growth curve of live weight of female turkeys was Von Bertalanffy growth model, and the least relevant was Logistic model. Similar results for Von Bertalanffy model were also reported by Akbaş
et al. (2001) in Holstein Friesians cows, and by Soysal et al. (2015) in male buffalo. However, the best fitted
model in Anatoilan buffalo was Richards model (Şahin
et al. 2014).
The results obtained in coefficient of determinations were 0.99 with Gompertz, Logistic, Richards, Morgan-Mercer-Flodin models in growth curves of Large White turkeys. In both of the systems, Von Bertlanffy model had the highest mature weight, and, Logistic model had the least in both gender.
In this study, estimation curves identified with 4 different growth models were in Figure 1 and 2 for male and female turkeys reared in Intensive system, and in Figure 3 and 4 for male and female turkeys reared in Free-Range system, respectively. Even if the values observed in the models were so close to each other, Von Bertalanffy model was more relevant than the others.
Many measures such as the consistence of growth models, R2, MSE, their biologic relevancies, and
consistency of estimations can generally be used in comparison of growth curve models characterizing the growth in livestock production (Torres and Ortiz, 2005; Malhado et. al., 2008, Torres et. al., 2012).
In the comparison of growth curve models in which R2 and MSE values were scored together, the model
which had the highest R2 value and the least MSE
values, explain the live weight changes according to the age. (Quirino et. al. 1999; Bayram % Akbulut; 2009; Yıldız et al. 2009; Kucuk & Eyduran 2009;
Mohammed, 2015).
Çetin et al. (2007), calculated DW values for
Gompertz, Richards and Logistic as 1.9543, 1.6179, 0.4017 in male partridges; 1.1763, 1.2025 and 0.5426 in female partridges, respectively. Faridi et al. (2011), AIC were 5980.53, 5632.6, 5525.255, 5912.12 and 5713.70; SBC were 6002.34, 5658.82, 5555.45, 5920.85 and 5726.80 by using NT1, NT2, NT3, Gompertz
Figure 2 – Growth curves of female Large White turkeys in Intensive system
and Richards models for growth in broiler breeder flocks, respectively. Narinc et al. (2013) calculated AIC as -301.43, -299.56, -282.51 and -307.47; SBC as -295.57, -291.75, -274.71 and -297.71 for Gamma, McNally, Modified compartmental and Adams-Bell models in egg production in Japanese quail, respectively. Besides AIC were found as -176.75, -195.92, -356.32 and -386.56; SBC were as-171.02, -188.27, -346.76 and -378.95, respectively by using Gamma, McNally, Modified compartmental and Adams-Bell models in egg production (Narinc et al. (2014) .
CONCLUSION
In this research, growth models of male and female turkeys reared in Intensive and Free-Range systems from their hatching to the 18th week of age were compared.
The 4 models have been applied for live weight data of turkeys. The values of R2 and Adj-R2 of all the models
have been found very high. The efficiency value of the model was up to 0.90 in all models and that means that models were efficient.
In conclusion, Von Bertalanffy model explained the weight-age change of male and female turkeys reared in different systems best.
REFERENCES
Abegaz S, Van Wyk JB, Olivier JJ. Estimation of genetic and phenotypic parameters of growth curve and their relationship with early growth and productivity in Horro sheep. Archic Tierzucht 2010;53(1):85–94.
Aggrey SE. Comparison of three nonlinear and spline regression models for describing chicken growth curves. Poultry Science 2002;81(12):1782– 1788.
Agudelo-Gómez D, Hurtado-Lugo N, Cerón-Muñoz MF. Growth curves and genetic parameters in colombian buffaloes (Bubalus bubalis Artiodactyla, Bovidae). Revista Colombiana Ciencias Pecuárias 2009;22(2):178-188.
Akbaş Y, Taşkın T, Demirören E. Comparison of several models to fit the growth curves of kıvırcık and dağlıç male lambs. Turkish Journal of Veterinary and Animal Science 1999;23(Suppl 3):537-544.
Akbaş Y, Akbulut Ö, Tüzemen N. Growth of Holstein cows in high altitude of Turkey. Indian Journal Animal Science 2001;71(5):476-479.
Aksoy A, Külekçi M, Bayram B, Akbulut Ö. Linear and log-linear model approach on determining the factors affecting live weight gain of holstein and brown swiss calves. Journal of Agricultural Faculty of Atatürk University 2011;41(2):123-127.
Alpan O, Arpacık R. Sığır yetiştiriciliği. Baskı: Şahin Matbaası; 1998. Akçapınar H, Özbeyaz C. Hayvan Yetiştiriciliği Temel ilkeleri. Ankara:
Kariyer Matbaacılık; 1999;.
Ayied AY, Al-Hello F, Al-Jassim EF. Growth patterns of Arabi sheep in South of Iraq. Journal of Tikrit University for Agricultural Science 2011;11:384–391
Bayram B, Akbulut Ö. Analysis of growth curve in brown swiss and holstein friesian cattle using linear and non-linear models. Hay Üretim 2009;50(2):33-40.
Bayram B, Akbulut Ö, Yanar M, Tüzemen N. Analysis of growth characteristics using the richards model in female brown swiss and holstein friesian cattle. Turkish Journal of Veterinary and Animal Scienca 2004;28: 201-208.
Behr V, Hornick JL, Cabaraux JF, Alvarez A, Istasse L. Growth patterns of Belgian Blue replacement heifers and growing males in commercial farms. Livestock Production Science 2001;71(2-3):121-130.
Bertalanffy LV. Wandlungen des biologischen Denkens, Neue Jahrbücher für Wissenschaft und Jugendbildung 1934;10:339-366.
Beverton RJH, Holt SJ. On the dynamics of exploited fish populations. London : Her Majesty’s Stationery Office, 1957; v.19, p.533.
Bilgin OC, Emsen E, Davis ME. Comparison of nonlinear models for describing growth of scrotal circumference in Awassi male lambs. Small Ruminant Research 2004;52:155–160.
Çetin M, Şengül T, Söğüt B, Yurtseven S. Comparison of growth models of male and female partridges. Journal of Biological Sciences 2007;7:964-968.
Doğan, İ. The Evaluation of Growth of Lambs by Multidimensional Scaling. Uludağ Üniversitesi Journal of the Faculty Veterinary Medicine 2003;22(1-3):33-37.
Eleroglu H, Yıldırım A, Şekeroğlu A, Çoksöyler FN, Duman M. Comparison of growth curves by growth models in slow–growing chicken genotypes raised the organic system. International Journal of Agriculture and Biology 2014;16:529–535.
Enders, W. Applied econometric time series. 3rd ed. New York: John Wiley & Sons; 2010.
Eyduran E, Kucuk M, Karakus K, Ozdemir T. New approaches to determination of the best onlinear describing growth at early phases of kivircik and morkaraman breeds. Journal of Animal and Veterinary Advances 2008;7(7):799-804.
Faridi A, Mottaghitalab, Rezaee F, France J. Narushin-Takma models as flexible alternatives for describing economic traits in broiler breeder flocks. Poultry Science 2011;90:507-515.
Graybill, FA, Iyer, H K. Regression analysis: concepts and applications. New York: Hardcover; 1994.
Gujarati, DN. Basic econometrics. 4 th ed. New York: McGraw-HiII; 2003.
Kucuk M., Eyduran E. The determination of the best growth model for akkaraman and german lackheaded mutton x akkaraman b1 crosbreed lambs. Bulgarian Journal of Agricultural Science 2009;15(1):90-92.
Kum D, Karakus K, Ozdemir T. The best nonlinear function for body weight at early phase of Norduz female lambs. Trakia Journal Science 2010;8(2):62-67.
Lambe NR, Navajas EA, Simm G, Bünger LA genetic investigation of various growth models to describe growth of lambs of two contrasting breeds. Journal of Animal Science 2006;84:2642–2654.
Malhado, CHM, Ramos AA, Carneiro PLS, Souza JC, Wechsler FS, Eler JP, et al. Nonlinear models to describe the growth of the buffaloes of murrah
breed. Archives Zootecnia 2008;57(220):497-503.
Mohammed, F. A. Comparison of three nonlinear functions for describing chicken growth curves. Scientific Agriculture 2015;9(3):=120-123.
Mohanty M., Painuli, D. K. Modelling rice seedling emergence growth and under tillage and residue management in a rice-wheat system on vertisol in Central India. Soil and Tillage Research 2004;76:167-174.
Narinc D, Karaman E, Aksoy T, Firat MZ. Investigation of nonlinear models to describe long-term egg production in Japanese quail. Poultry Science 2013;92:1376-1682.
Narinc D, Uckardes F, Aslan E. Egg production curve analyses in poultry science. World’s Poultry Science Journal 2014:70:817-828.
Ngeno K, Bebe BO, Kahi AK. Estimation of growth parameters of indigenous chicken populations intensively reared in Kenya. Egerton Journal of Science Technology 2010;11:13-28
Norris D, Ngambi JW, Benyi K, Makgah-lela, ML, Shimelis HA, Nesamvuni, EA. Analysis of growth curves of indigenous male venda and naked neck chickens. South African Journal of Animal Science 2007;37:21-26.
Norusis MJ. SPSS 14.0 advanced statistical procedures companion. New Jersey: Prentice Hall; 2005.
NRC. Nutrient Requirements of Poultry. 9th ed. Washington: National Academy Press; 2005.
Prestes AM, Garnero ADV, Marcondes CR, Damé MC, Janner EA, Rorato PRN. Estudo da curva de crescimento de bubalinos da raça Murrah criados no estado do Rio Grande do Sul. Anais do 9º Simpósio Brasileiro de Melhoramento Animal; 2012 Jun 20-26; João Pessoa: ABMA; 2012.
Quirino CR, Bergmann JA, Vale Filho, VR, Andrade VJ, Pereira, JC. Evaluation of four mathematical functions to describe scrotal circumference maturation in Nellore bulls. Theriogenology 1999;52(1):25-34.
Reddish JM, Lilburn MS. A comparison of growth and development patterns in diverse genotypes of broilers. Pullet growth. Poultry Science 2004;83:1072-1076.
Rizzi C, Contiero B, Casandro M. Growth patterns of Italian local chicken populations. Poultry Science 2013;92(8):2226-2235.
Saghi DA, Aslaminejad A, Tahmoorespur M, Farhangfar H, Nassiri M, Dashab GR. Estimation of genetic parameters for growth traits in Baluchi sheep using Gompertz growth curve function. Indian Journal of Animal Science 2012;82:889–892.
Schulze V, Rohe R, Looft H, Kalm E. Genetic analysis of the course of individual growth and feed intake of group-penned performance tested boars. Archiv Tierzucht 2001;44:139-156.
Seber GAF, Wild CJ. Nonlinear regression. New York: John Wiley and Sons; 1989.
Soysal MI, Gurcan EK, Genc S, Aksel M. The Comparison of growth curve with different models in anatolian buffalo. Journal of Tekirdag Agricultural Faculty 2015;12(3):57-61.
Şahin A, Ulutaş Z, Karadavut U, Yıldırım A, Arslan S. Comparison of growth curve using some nonlinear models in anatolian buffaloe calves. Kafkas Üniversitesi Veteriner Fakültesi Dergisi 2014;20(3):357-362..
Şengül T, Kiraz S. Ağır Beyaz hindilerde büyüme eğrilerinin tanımlanmasında doğrusal olmayan modeller. Türkish Journal of Veterinary and Animal Science 2005;29:331–337.
Tariq MM, Bajwa MA, Waheed A, Eyduran E, Abbas F, Bokhari FA, et al.
Growth curve in Mengali sheep breed of Bachistan. Journal of Animal and Plant Science 2011;21:5–7.
Tariq, MM, Iqbal F, Eyduran E, Bajwa MA, Huma ZE, Waheed A. Comparison of Non-Linear Functions to Describe the Growth in Mengali Sheep Breed of Balochistan. Pakistan Journal of Zoology 2013;45(3):661-665.
Topal M, Ozdemir M, Aksakal V, Yıldız N, Dogru U. Determination of the best nonlinear function in order to estimate growth in Morkaramn and Awassi lambs. Small Ruminant Research 2004;55:229-232.
Torres V, Ortiz J. Application of modelling and simulation to the production and feeding farm animals. Cuban Journal of Agricultural Science 2005;39:385.
Torres V, Barbosa I, Meyer R, Noda A, Sarduy L. Criteria of goodness of fit test in the selection of non-linear models for the description of biological performances, Cuban Journal of Agricultural Science 2012;46(4):345-350.
Ünver Ö, Gamgam H, Altunkaynak B. SPSS uygulamalı temel istatistik yöntemler. Seçkin: Yayıncılık San. Ve Tic. A.Ş; 2011.
Winsor CP. The Gompertz curve as a growth curve. Proceedings of the National Academy of Science 1932;18(1):1-8