Assessment of plant water status variability by
thermography:
Comparing ground measurements with remote imaging
Irene Rodschinka
Dissertation to obtain the degree of
European Master of Science in Viticulture and Enology
Supervisor: Professor Carlos Lopes / Instituto Superior de Agronomia Lisboa
Supervisor in the hosting organisation: Professor Stefano Poni / Università Cattolica
del Sacro Cuore
Jury:
President: Jorge Manuel Rodrigues Ricardo da Silva (PhD), Full Professor, Instituto Superior de Agronomia, Universidade de Lisboa
Members: Manfred Stoll (PhD), Full Professor, Hochschule Geisenheim University Carlos Manuel Antunes Lopes (PhD), Associated Professor with habilitation, Instituto Superior de Agronomia, Universidade de Lisboa
Joaquim Miguel Rangel da Cunha Costa (PhD), Assistant Professor, Instituto Superior de Agronomia, Universidade de Lisboa
Acknowledgements
I would like to acknowledge my indebtedness and render my warmest thanks to my supervisor in the hosting organisation, Professor Stefano Poni, who suggested and realized this work. His guidance and expert advice have been invaluable throughout the stages of the work.
I would also wish to express my gratitude to Professor Matteo Gatti for extended discussions and valuable suggestions which have contributed greatly to the improvement of the thesis. The thesis has also extensively benefited from the technical support and expertise from Alessandro Matese of Italian National Research Council (CNR), Firenze, and his team. The same applies to the staff at the 'Centro di Ricerca Analisi geoSpaziale e Telerilevamento' (CRAST) in Piacenza.
This thesis has been written during my stay at Università Cattolica di Piacenza. I would like to thank the Viticulture Department for providing excellent working conditions, and Istituto Toniolo with 'Borsa Invernizzi' for its financial support.
Abstract
Remote sensing provides a fast alternative for traditional in situ water status measurement in vineyards. Canopy temperature measurements derived from aerial thermography were compared to thermal and plant physiological ground-truthing data of single vines in a low and high vigour zone. The experimental trial was carried out in a vineyard of Colli Piacentini, located in the province of Piacenza (Italy). Statistical methods were used to evaluate the correlation between acquired temperatures and plant physiological parameters. Results by simple regression showed significant correlation, with coefficient of determination (R2) higher than 0.6 for the indices studied; R2 higher than 0.7 for correlations of thermal data with vine water status' and R2 higher than 0.9 for correlations deriving from data of vines of the high vigour zone. These results propose that thermography is a good estimator for vine water status and photosynthetic activity. However, records of aerial and proximal thermal imaging are not congruent but have a similar behaviour and correlation when comparing to ground measurements. Therefore, when only using thermography, vine water stress is not only indicated by a higher canopy temperature in absolute values but is an implication of temperature variation within the field over time. Comparative measurements can improve assessing vine water status by observing changes in canopy temperature.
Síntese
O sensoriamento remoto pode fornecer uma alternativa rápida para a medição tradicional do estado da água em vinhedos. As medidas de temperatura do dossel derivadas da termografia aérea foram comparadas com os dados fisiológicos térmicos e fitossanitários da videira em uma zona de baixo e alto vigor. O experimento foi realizado em um vinhedo de Colli Piacentini, localizado na província de Piacenza (Itália). Métodos estatísticos foram utilizados para avaliar a correlação entre temperaturas adquiridas e parâmetros fisiológicos das plantas. Os resultados por regressão simples mostraram correlação significativa, com coeficiente de determinação (R2) maior que 0,6 para os índices estudados; R2 superior a 0,7 para correlações de dados térmicos com o estado da água da vinha e R2 superior a 0,9 para correlações decorrentes de dados de videiras da zona de alto vigor. Estes resultados sugerem que a termografia é um bom estimador para o estado da água e para a atividade fotossintética. No entanto, os registros de imagens térmicas aéreas e proximais não são congruentes, mas tem um comportamento e correlação semelhantes quando comparados às medições do solo. Portanto, quando se usa apenas termografia, o estresse hídrico da vinha não é indicado apenas por uma temperatura de dossel mais alta em valores absolutos, mas é uma implicação da variação de temperatura dentro do campo ao longo do tempo. Medições comparativas podem melhorar a avaliação do estado da água da vinha observando as mudanças na temperatura do dossel.
Resumo alargado
O estado da água da vinha tem implicações nos parâmetros de rendimento e de qualidade e é, portanto, essencial para a economia da gestão da vinha. O stress do défice hídrico na videira pode evocar um crescimento limitado do rebento, peso das bagas, composição da uva e qualidade geral da vindima. Assim, uma ferramenta precisa e fácil de implementar para avaliar o estado hídrico da videira pode clarificar o nível de stress das plantas e pode levar a uma adaptação da gestão adequada do copado, à redução da produção ou à implementação da irrigação deficitária. A tese seguinte trata de métodos para a detecção do stress hídrico e do estado da água e testa a sua aplicabilidade e fiabilidade. Entre os métodos existentes, o estado hídrico da vinha foi avaliado ao meio-dia e pré-dia e foram efectuadas medições do potencial hídrico das folhas e da temperatura das folhas, uma vez que a temperatura das folhas é importante como indicador de aspectos da função fisiológica, especialmente os relacionados com a taxa de evaporação e abertura estomática, com as temperaturas a diminuir à medida que os estomas se abrem e as taxas de evaporação aumentam. Aqui, dois métodos diferentes de aplicação da chamada termografia foram utilizados: Medições térmicas a partir da vizinhança imediata com uma câmera portátil e medições térmicas de maior distância por drone.
A questão foi formulada, como o stress hídrico exibido pelo estado da água da planta e sua variabilidade é reproduzido em uma variabilidade da temperatura da copa e se esta avaliação não invasiva e remota por termografia é capaz de concluir de forma confiável o estado da água da videira.
Neste estudo, as medições da temperatura do dossel derivadas da termografia aérea foram comparadas com os dados fisiológicos térmicos e fitossanitários das videiras individuais numa zona de baixo e alto vigor. O ensaio experimental foi realizado numa vinha de Colli Piacentini, localizada na província de Piacenza (Itália). Foram utilizados métodos estatísticos para avaliar a correlação entre as temperaturas adquiridas e os parâmetros fisiológicos das plantas. Os resultados por regressão simples mostraram correlação significativa, com coeficiente de determinação (R2) superior a 0,6 para os índices estudados; R2 superior a 0,7 para correlações dos dados térmicos com o estado hídrico da vinha' e R2 superior a 0,9 para correlações derivadas dos dados das videiras da zona de alto vigor. Estes resultados propõem que a termografia é um bom e rápido estimador do estado da água da vinha e da actividade fotossintética e uma valioso instrumento não invasivo na viticultura de precisão. As principais vantagens destes métodos são a facilidade de implementação, processamento e resposta imediata.
Portanto, o estabelecimento de relações entre parâmetros fisiológicos como a taxa fotossintética e o estado hídrico das videiras apresentadas fornecem uma base sólida para a determinação do estado hídrico.
Todavia, entre os métodos de termografia, os registos de imagens térmicas aéreas e proximais não são congruentes, mas têm um comportamento e correlação congruentes quando comparados com as medições do solo.
No entanto, qualquer estudo dos processos fisiológicos deve ter em conta a sensibilidade da temperatura do processo em relação à variação natural (espacial e temporal) da temperatura. O uso de um valor absoluto da temperatura da folha como indicador da condutância ou transpiração do estômago, no entanto, é pouco significativo pelo facto de a temperatura da folha ser também afectada por uma vasta gama de outras características vegetais e ambientais de acordo com o balanço energético da folha e especialmente pela variação do valor da temperatura devido à diferente imaginação óptica do dossel. Além disso, como o ambiente está em constante variação, pelo menos para as plantas no campo, torna-se também necessário considerar o comportamento dinâmico da temperatura da folha em qualquer estudo preciso da temperatura da folha. Assim, quando se utiliza apenas a termografia, o stress hídrico da vinha não é apenas indicado por uma temperatura de copa mais elevada em valores absolutos, mas é uma implicação da variação da temperatura no campo ao longo do tempo. As medições comparativas podem melhorar a avaliação do estado da água da vinha através da observação de alterações na temperatura do dossel.
Table of Contents
Acknowledgments
Abstract II
Sintese III
Resumo alargado IV
List of Figures VIII
List of Tables IX
List of Equations IX
Aim of the Research Project 1
Chapter 1: Literature Review 2
1.1 Hydraulic Architecture of Grapevines 2
1.1.1 Energetics of the Hydraulic System 3
1.1.2 Characterizing Hydraulic Parameters of Grapevines 4
1.1.2.1 Hydraulic Conductivity of Plant Stems 4
1.1.2.2 Xylem 5
1.1.2.3 The Hydraulic Regulation 6
1.1.3 Summary and Conclusions 6
1.2 Plant Responses to Water Stress 7
1.2.1 Plant Adaptation to Drought 7
1.2.2 Environmental Influences on Stomatal Resistance 9
1.2.3 Environmental Influences on CO2 Assimilation 10
1.2.4 Models of Stomatal Response to Environmental Factors 10
1.2.5 Feedback mechanisms of Stomatal control 11
1.2.6 Summary and Conclusions 12
1.3 Plant Based Indicators of Water Stress 12
1.3.1 Water Potential 12
1.3.1.1 Leaf Water Potential 12
1.3.1.2 Pre-Dawn Leaf Water Potential 13
1.3.1.3 Xylem (Stem) Water Potential 14
1.3.2 Canopy Temperature 14
1.3.3 Summary and Conclusions 15
1.4. Thermal Indices 15
1.4.1 Stress Degree Day 17
1.4.2 Crop Water Stress Index 17
1.4.3 Jones Index or Stomatal Conductance Index (Ig) 18
1.4.4 Summary and Conclusions 18
1.5 Technology in Precision Viticulture 19
1.5.1 State of the Art Review 19
1.5.2 Monitoring Technologies 19
1.5.3 Remote Sensing 20
1.5.3.1 UAV 20
1.5.4 Proximal Sensing 21
1.5.5 Thermal Imaging 21
1.5.5.1 Difficulties on Field-Scale 22
1.5.5.2 Conclusions 23
Chapter 2: Material and Methods 24
2.1 Experimental Site 24
2.2 Experimental Design 25
2.3 Plant Physiological Variables 26
2.3.1 Leaf Water Potentials 26
2.3.2 Leaf Gas Exchange 26
2.4 Soil Sampling 26
2.5 Thermal Imaging 27
2.5.1 Proximal Thermal Imaging 27
2.5.1.1 Proximal-Sensed Data Collection and Processing 27
2.5.2 Remote Thermal Imaging 28
2.5.2.1 UAV Platform and Payload 28
2.5.2.2 Flight Survey 28
2.5.2.3 Remotely-Sensed Data Collection and Processing 29
2.6 Statistical Analysis 31
Chapter 3: Results and Discussion 32
3.1 Vineyard Characterisation 32
3.1.1 Results of Soil Samples 32
3.1.2 Characterisation of Vigour Zones by Plant Physiological Variables
for the 3rd of July 2017 34
3.1.3 Characterisation of Vigour Zones by Canopy Thermography
for the 3rd of July 2017 36
3.1.4 Characterisation of Vigour Zones by Plant Physiological Variables
for the 26th of July 2017 39
3.1.5 Characterisation of Vigour Zones by Canopy Thermography
for the 26th of July 2017 42
3.2 Comparison of Thermal Data Assessment 45
Chapter 4: Conclusions 51
Reference List VIII
List of Figures
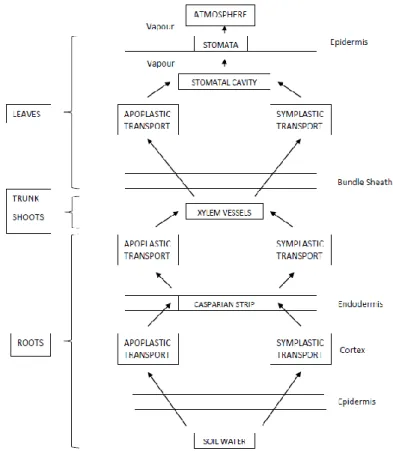
Figure 1 Summary of the Soil Plant Atmosphere Continuum (SPAC) 2
Figure 2 Resistance to water flow in the plant 3
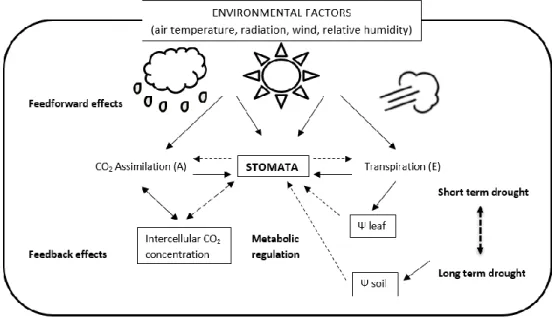
Figure 3 Summary of feed forward and feedback mechanisms of stomatal control of CO2 assimilation and water vapour losses
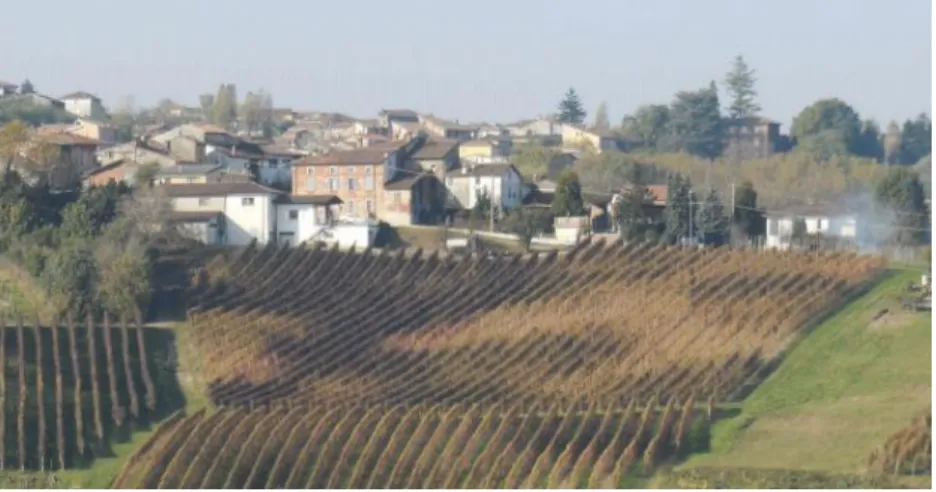
8 Figure 4 Illustration of the time course of leaf water potential over three days 13 Figure 5 Experimental site with visible spatial variability 24 Figure 6 NDVI map presenting vigour zones and area of targeted vines 25
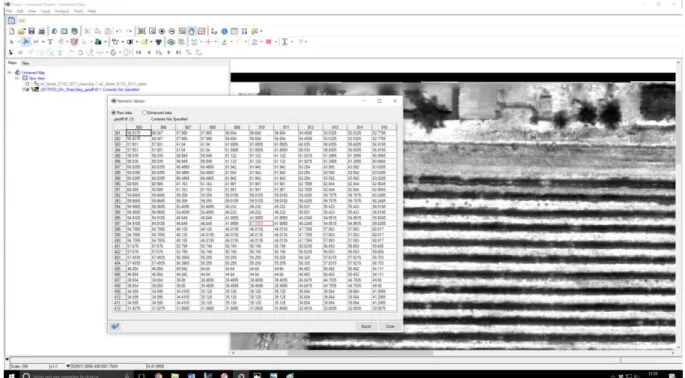
Figure 7 Numeric value extraction with Matlab 29
Figure 8 Temperature extraction of single pixels 30
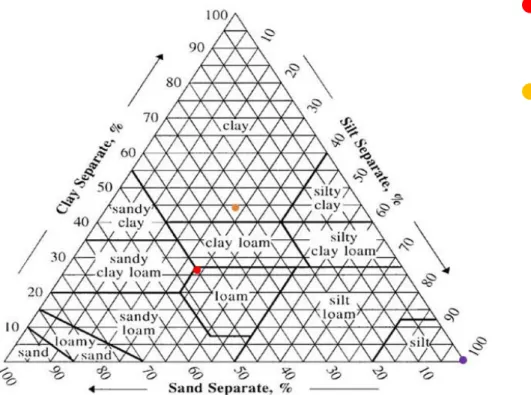
Figure 9 Soil texture triangle of the experimental site 33
Figure 10 Correlation of midday leaf water potential and stomatal conductance on 03.07.2017 for the low and high vigour zone
35 Figure 11 Correlation of midday leaf water potential and assimilation on 03.07.2017
for the low and high vigour zone
35 Figure 12 Correlation of midday leaf water potential and transpiration on
03.07.2017 for the low and high vigour zone
35 Figure 13 Correlation of vapour pressure deficit and transpiration on 03.07.2017 for
the low and high vigour zone
36 Figure 14 Correlation of midday leaf water potential and canopy temperature
acquired by the thermal handhold camera on 03.07.2017 for the low and high vigour zone
38
Figure 15 Correlation of midday leaf water potential and canopy temperature acquired by the thermal handhold camera on 03.07.2017 for the high vigour zone
38
Figure 16 Non-correlation of midday leaf water potential and canopy temperature acquired by the thermal handhold camera on 03.07.2017 for the low vigour zone
38
Figure 17 Correlation of pre-dawn leaf water potential and stomatal conductance on 26.07.2017 for the low and high vigour zone
40 Figure 18 Correlation of pre-dawn leaf water potential and net carbon assimilation
on 26.07.2017 for the low and high vigour zone
40 Figure 19 Correlation of pre-dawn leaf water potential and transpiration on
26.07.2017 for the low and high vigour zone
40 Figure 20 Correlation of midday leaf water potential and stomatal conductance on
26.07.2017 for the low and high vigour zone
41 Figure 21 Correlation of midday leaf water potential and net carbon assimilation on
26.07.2017 for the low and high vigour zone
41 Figure 22 Correlation of midday leaf water potential and transpiration on 26.07.2017
for the low and high vigour zone
42 Figure 23 Correlation of midday leaf water potential and canopy temperature
acquired by the thermal handhold camera on 26.07.2017 for the low and high vigour zone
43
Figure 24 Correlation of midday leaf water potential and canopy temperature acquired by the thermal handhold camera on 26.07.2017 for the high vigour zone
43
Figure 25 Correlation of midday leaf water potential and canopy temperature acquired by the drone on 26.07.2017 for the low and high vigour zone
43 Figure 26 Correlation of pre-dawn leaf water potential and canopy temperature by
the handhold thermal camera 26.07.2017 for the low and high vigour zone 44 Figure 27 Correlation of pre-dawn leaf water potential and canopy temperature
acquired by the drone on 26.07.2017 for the low and high vigour zone
Figure 28 Comparison of thermal measurements and vine water status in the high vigour zone for 03.07.2017
45 Figure 29 Comparison of thermal measurements and vine water status in the low
vigour zone for 03.07.2017
46 Figure 30 Comparison of thermal measurements and vine water status in the high
vigour zone for 26.07.2017
46 Figure 31 Comparison of thermal measurements and vine water status in the low
vigour zone for 26.07.2017
47
List of Tables
Table 1 Summary of the impact of drought severity on stomatal regulation 8 Table 2 Summary of thresholds for various plant water potentials 14 Table 3 Physical and chemical soil characterisation of both vigour zones 32 Table 4 Leaf water status and gas exchange data recorded on 03.07.2017 34 Table 5 Single leaf and canopy (zone) temperatures on 03.07.2017 36 Table 6 Leaf physiological traits and flux data on 26.07.2017 39 Table 7 Single leaf and canopy (zone) temperatures on 26.07.2017 42
List of Equations Equation 1 3 Equation 2 4 Equation 3 4 Equation 4 4 Equation 5 5 Equation 6 5 Equation 7 5 Equation 8 9 Equation 9 9 Equation 10 10 Equation 11 10 Equation 12 11 Equation 13 11 Equation 14 16 Equation 15 16 Equation 16 16 Equation 17 16 Equation 18 17 Equation 19 17 Equation 20 18 Equation 21 18
Aim of the Research Project
Vine water status has implications on yield and quality parameters and is therefore essential to the economics of vineyard management. Water deficit stress on grapevine can evoke limited shoot growth, berry weight, grape composition and overall vintage quality. Therefore, an accurate and easy-to implement tool for assessing vine water status can clarify the stress level of the plants and could lead into an adaption of appropriate canopy management, yield reduction or the implementation of deficit irrigation.
The following thesis deals with methods for the detection of water stress and water status and tests their applicability and reliability. Among existing methods, vine water status was assessed by midday and pre-dawn leaf water potential and leaf temperature measurements were undertaken, as leaf temperature is important as an indicator of aspects of physiological function, especially those related to evaporation rate and stomatal opening, with temperatures decreasing as stomata open and as evaporation rates increase. Here, two different methods of so called thermography application were used: Thermal measurements from the immediate vicinity with a handheld camera and thermal measurements of greater distance by drone.
The question has been formulated, how water stress displayed by plant water status and its variability is reproduced in a variability of canopy temperature and if this non-invasive and remote assessment by thermography is able to conclude reliably vine water status.
1. Literature Review
This chapter reviews the underlying physiological and technological knowledge currently supporting ground-truthing practice in vineyards which, on the other hand, are used to examine reliability of thermal data acquired by remote sensing thermography.
As an introduction plant hydraulics and the water movement through the grapevine from the soil to the atmosphere by plant vascular structures are reviewed. Known mechanisms of adaptation to water stress are reported and placed in the context of proximal and remote sensing strategies.
1.1 Hydraulic Architecture of Grapevines
Studying the water use of plants, the Soil-Plant-Atmosphere-Continuum (SPAC) is a key concept: The conception of the SPAC arises from the cohesion-tension theory (CT) of water movement through plants (Dixon & Joly, 1894) and the comprehension of water moving from soil into roots, through plants and into the atmosphere along gradients in water potential. A summary of the pathway of water transport from the soil, through the plant and to the atmosphere is presented in figure 1 and is assessed in this section in terms of plant hydraulics.
Water moves from the soil through the cortex using apoplastic (outside the cell membrane) and symplastic (inside the cell membrane) paths, across the casparian strip and enters the xylem (Salisbury & Ross, 1992). Driven by a combination of the transpiration stream and osmotic potential, the water in leaf's xylem moves towards the stomatal cavities where it diffuses into the atmospheric boundary layer located around the leaf (Guisard, 2008).
1.1.1 Energetics of the Hydraulic System
The state of a hydraulic system can be described in terms of the amount of water it contains (often termed its 'water content') and its energetic (or qualitative) component (Campbell & Norman, 1998).
The energy status within a component of the hydraulic system can be represented using the concept of water potential (Ψ) (Slatyer & Taylor, 1962). Pure water at atmospheric pressure has a solute potential of zero. As solute is added, the value for solute potential becomes more negative, but increased pressure will increase it (making it less negative). Unless hindered, water will move from an area of high to low water potential. The water potential within a plant is generally negative as defined using the simplified equation:
Ψ = Ψ0 + ΨP
(Equation 1) where ΨO is the osmotic potential
ΨP is the pressure potential
Within the Soil Plant Atmosphere Continuum (SPAC), many elements of different hydraulic conductance and capacitance such as the contribution of individual roots, shoots or leaves can be identified. Resistances placed in series are additive (R = R1 + R2 + … Rn). Resistances placed in parallel can be calculated as the reciprocal of the sum of the reciprocals of the individual resistances (figure 2) (Campbell & Norman, 1998).
R = 1 1 𝑅𝐿1+ 1 𝑅𝑙2+ 1 𝑅𝐿3+ 1 𝑅𝐹1 + 1 𝑅𝐹2
Figure 2 Resistance to water flow in the plant. R represents the equivalent resistance to the parallel petiole resistance to water flow into leaves (L1, L2, L3) and fruits (F1, F2)
1.1.2 Characterising Hydraulic Parameters of Grapevines 1.1.2.1 Hydraulic Conductivity of Plant Stems
Tyree and Ewers (1991) and Jones (1992), proposed to use the Poiseuille's law to model the hydraulic behaviour of a bundle of cylindrical xylem vessels:
kh = ( 𝜋𝜌
128ŋ) ∑ 𝑑 𝑛 𝑖=1 41
(Equation 2) where kh is the hydraulic conductivity of a bundle of pipes of various diameters (kg.s-1.MPa-1)
ρ is the density of the fluid (kg.m-3)
ŋ is the dynamic viscosity of the fluid (MPa.s-1) d is the diameter of each pipe (xylem vessel) (m) n is the number of pipes
This equation demonstrates the factorial impact of a large vessel diameter on hydraulic conductivity.
Plant leaves contain tiny openings called stomata (singular 'stoma' or 'stomate') mostly found on the underside of leaf blades (hypostomatous). Stomata open and close to allow the intake of carbon dioxide from the atmosphere and the release of oxygen and water vapour.
If well hydrated leaves have a high water potential and if evaporative demand increases through the day, the plant will need to contribute with water reserves and hydraulic conductivity for the stomata to remain open and the leaf to stay well hydrated.
The Huber Value (HV) (Huber, 1928, cited in Cruiziat et al., 2002) measures a plant's investment in stem tissue per unit of leaf area (equation adapted from Tyree & Ewers, 1991):
HV = 𝐿𝑆𝐶
𝐾𝑠
(Equation 3) where HV is dimensionless
LSC is the Leaf Specific Conductivity (kg.s-1.MPa-1.m-2) LSC and Ks can be defined by:
LSC = 𝐾ℎ
𝐴𝐿
Ks = 𝐾ℎ 𝐴𝑤
(Equation 5) where Kh is the hydraulic conductivity per unit pressure gradient as defined in (Equation 2)
and (Equation 3)
Aw is the area of the sap wood cross section (m2) AL is the leaf area fed by the sap wood cross section considered by Aw (m2)
When the evaporative flux density E (kg.s-1.m-2) is known and ignoring the water storage capacitance of a stem segment, it can be shown that:
𝑑𝑃 𝑑𝑥 =
𝐸 𝐿𝑆𝐶
(Equation 6) where dP/dx is the pressure gradient per unit length
Equation 1.6 demonstrates that for a given leaf surface area, plants with a high hydraulic conductivity can evaporate a given flux density of water using less pressure gradient per unit length than plants with low leaf surface area.
Putting together (Equation 4), (Equation 5) and (Equation 6), the Huber Value (HV) can now be solved for stem and leaf areas (Aw and AL):
HV = 𝐴𝑤
𝐴𝑙
(Equation 7) A low Huber Value (HV) would therefore indicate high stem conductivity and the capacity to transport water to a set value for AL using small stem diameters. Variability of the Huber Value was found to be high across but also within plant species (Cruiziat et al., 2002).
1.1.2.2 Xylem
A general agreement in literature prevails over the major source of xylem hydraulic resistance (regardless of the plant organ) Xylem cavitation or xylem embolism evokes a rupture of the water column and it is due to xylem vessels filling up with air or dissolved gases (Tyree & Ewers, 1991).
1.1.2.3 The Hydraulic Regulation
Reduced hydraulic conductivity is caused by sites of higher hydraulic resistance such as the root system identified by Liu (1978) as the largest cause of resistance on Vitis labrusca. Lovisolo & Schubert (1998) noted that the stem xylem vessels diameters (Kh in Poiseuille's law) contribute very much to a reduction of hydraulic conductivity as it is factorial included in the Poiseuille's law. This approach has been also suggested by the experimental work of Schultz (1983).
Sack & Holbrook (2006) argued that for most plants, leaves are a major contributor to the whole plant hydraulic resistance to water flow for several reasons:
• The resistance of stomata to water vapour flow from the stomatal cavity to the surrounding boundary layer is extremely large when compared to bulk flow, even when the stomata are fully opened.
• Leaves have the ability to control vapour diffusion rate via stomatal behaviour, further increasing resistance when stomata close in response to water stress (Guisard, 2008).
1.1.3 Summary and Conclusions
This chapter reviewed the hydraulic properties of plants with regard to conducting vessels subjected to driving forces and regulated by leaf stomata.
As defining the dominant hydraulic resistance at increasing water stress becomes more complex and variable due to the grapevines hydraulic structure, the assessment of vine water status is unlikely a simple growers' routine unless the drivers and resistances can be accurately modelled.
In the following chapter the knowledge of the mechanisms of stomatal regulation in grapevine and its adaptation to water stress is reviewed in detail.
1.2 Plant Responses to Water Stress
In this section, the general plant adaptive responses to increasing water stress will be presented followed by a detailed examination of the mechanism of stomatal control of water use.
1.2.1 Plant Adaptation to Drought
Droughts, periods of sub-maximal plant water potential, are classified in the literature as being short or long term (Chaves et al., 2003). Short droughts (ranging from hours to a day) tend to induce metabolic protective responses (usually reversible) whilst slowly induced, long term droughts (ranging from several days to months) tend to induce potentially irreversible adaptive responses (Guisard, 2008). Short term droughts provoke growth arrest as a primary response and induce genetic response for metabolic acclimation and induce osmotic adjustments. Jones (1992) reported short term droughts to be associated with potent stomatal control of stomatal behaviour.
Plant-water relations or drought resistance of C3 mesophytes can be generally divided into a drought avoiding or drought tolerating behaviour (Salisbury & Ross, 1992).
Drought avoiding plants, also termed 'pessimistic' or isohydric plants (Escalona et al., 1999), modify their anatomy (leaf shape, size and thickness) and phenology (early flower set, fruit ripening and/or leaf fall), to conserve available water resources (Cifre et al., 2005). Drought tolerant plants, also termed 'optimistic plants', use all available water in expectation of upcoming rain. This is achieved by maintaining cell turgor and favours the use of protective solutes and desiccation tolerant enzymes (Escalona et al., 1999). This behaviour is called anisohydric. In general, grapevine is considered a water stress avoidant species, with a tight stomatal control. However, some varieties have shown a more efficient stomatal control than others. This encouraged researchers to classify grapevine varieties as isohydric or anisohydric. Table 1 is a summary of the various regions of stomatal regulation as a function of drought severity.
Table 1 Summary of the impact of drought severity on stomatal regulation. From Medrano et al., (2002)
Drought severity Stomatal conductance (mmol m⁻²
s⁻¹) Type of regulation
Mild stress 0,4 - 0,15 Stomatal regulation
High stress 0,15 - 0,05 Stomatal and non-stomatal
regulation
Mild water stress in grapevines has been shown to induce a reduction in vegetative growth (Deloire, Carbonneau, Wang, & Ojeda, 2004; Galet, 1993; Schultz, 1983) and to affect reproductive growth and to reduce yields (Bravdo, Hepner, Loigner, & Tabacman, 1985; Galet, 1993; Hardie & Considine, 1976; Matthews & Anderson, 1988). Extreme water stress leads to defoliation and vine exitus (Le Clech, 1996).
From a hydraulic resistance perspective, the central role of the stomata was highlighted in the previous section. It is now highlighted in regard to optimising the balance between water loss by transpiration and CO2 uptake (Chaves et al., 2003; Chaves et al., 2002; Jones, 1998; Loveys, 2002; Guisard, 2008).
In the following Figure 3 the control mechanisms to regulate water and CO2 fluxes as a result of environmental (feed forward) and physiological (feedback) circuits are summarized.
The shown mechanisms of stomatal control are the subject of various mechanistic models that will now be presented.
Figure 3 Summary of feed forward and feedback mechanisms of stomatal control of CO2 assimilation and water
vapour losses. Plain lines indicate direct effects, and dotted lines indicate indirect effects. Adapted from Jones (1992, 1998)
1.2.2 Environmental Influences on Stomatal Resistance
The effect of air temperature on stomatal conductance in the field is usually difficult to isolate from the relative humidity effects. This difficulty can be overcome by using growth chambers, as is the case for helox based studies (Guisard, 2008).
The relationship between stomatal conductance and relative humidity has raised strong debates in the literature. The vapour pressure deficit (VPD, in kPa) is defined as the difference in vapour pressure between saturated and ambient air at air temperature (Campbell & Norman, 1998):
VPD = es(Ta) – ea = es (Ta) (1-hr)
(Equation 8) where es (Ta) is the saturated vapour pressure (kPa)
ea is the ambient air vapour pressure (kPa) Ta is the ambient temperature (°C)
hr is the relative humidity
Saturated vapour pressure at ambient temperature (es(Ta)) can be computed as a function of air temperature (Campbell & Norman, 1998):
es (T𝑎) = 0.611exp (17.502𝑇𝑎 𝑇𝑎+240.97)
(Equation 9) Equation 8 and Equation 9 demonstrate the close relationship between air temperature and VPD and the intrinsic difficulty to separate both effects in the field when ambient VPD is measured as a predictive variable.
Literature in grapevine studies reports on the negative relationship between VPD and stomatal conductance (Gomez del Campo et al., 2004; Jacobs, van den Hurk, & de Bruin, 1996; Kliewer et al., 1983; Loveys, 2002; Lu et al., 2003; Guisard, 2008).
1.2.3 Environmental Influences on CO2 Assimilation
Photosynthesis in grapevines displays a typical rectangular hyperbolic response to exposure to light intensity (Kriedemann, 1968) with a compensation point (where net photosynthesis becomes positive) at about 50 μmol.m-2.s-1 (Mullins et al., 1992).
However, adaptation to high light intensity is variable with maximum reported values ranging from 690 μmol.m-2.s-1 (cv Sultana) (Kriedemann, 1968) to 1800 μmol.m-2.s-1 (cv Tempranillo) (Baeza et al., 2005). Palliotti et al., (2000; 2001) reported an adaptation to constant low light for the shaded sides of canopies, measured as a saturation value around 200 μmol.m-2.s-1. Mullins (1992) and Kriedemann (1968) reported that air temperature ranging between 25°C to 30°C was optimal for leaf function, but outside this range photosynthesis was reduced. Ferrini et al., (1995) reported similar responses although these authors highlighted the variability of responses between cultivars.
1.2.4 Models of Stomatal Response to Environmental Factors
A model based upon the linear feed forward sensitivity of the stomata of some plants to VPD was proposed by Ball, Woodrow, and Berry (1987):
gs = g0 + kAn, leaf ℎ𝑠 𝐶𝑐𝑎
(Equation 10) where g0 is the residual stomatal conductance (mol.m-2.s-1)
k is a stomatal sensitivity factor
An, leaf is the net carbon assimilation by a leaf (mol.m-2.s-1) hs is the VPD at the leaf surface (mol.mol-1)
Cca is the ambient air CO2 concentration (mol.mol-1) (approximately 350 μmol.mol-1) Considering that stomatal aperture is also regulated as well as limited by the capacity of C3 plants to fix carbon (Campbell & Norman, 1998; Wong et al., 1979) was leading to various similar models:
An, leaf = gc (Cca – Cci)
(Equation 11) where An, leaf is the net carbon assimilation by a leaf (mol.m-2.s-1) gc is stomatal and boundary conductance (in series) (mol.m-2.s-1) for CO2 Cci is the mesophyll CO2 concentration (mol.mol-1)
Cci is reported to saturate around 280 μmol.mol-1 in C3 plants (Campbell & Norman, 1998), and was reported by Düring (2003) to saturate in Riesling leaves at 340 μmol.mol-1.
1.2.5 Feedback mechanisms of stomatal control
Various studies have proposed that stomatal conductance is regulated by the plant's hydraulic system. Jones (1992, 1998) proposed a simple linear model suggesting that stomatal conductance is regulated by leaf water potential:
gs =gm (1+ kΨleaf)
(Equation 12) where gm is the maximum stomatal conductance (mol.m-2.s-1)
Ψleaf is the leaf water potential (MPa) k = 0.4 MPa-1
However, leaf water potential control represents only part of the control mechanisms. Jones (1992, 1998) therefore proposed the use of gs as a predictor variable:
Ψleaf = Ψsoil – VPD gs Rsoil - plant
(Equation 13) where Ψsoil is the soil water potential (MPa)
Rsoil - plant is the frictional loss in the conducting pathway (MPa.m-2.s.mol-1)
Solving simultaneously Equation 12 and Equation 13 demonstrates that VPD and Ψsoil are the driving variables of the system, linked by Ψleaf. However, more recently, Jones (2007) presented a new hypothesis that water potential is unlikely to be the cause of stomatal sensitivity, but rather that changes in cell turgor pressure or cell volume that accompany changes in water potential are the direct cause.
1.2.5 Summary and Conclusions
This section has described grapevines' adaptation to increasing levels of water stress in terms of anatomical adaptations as well as biochemical regulation of stomatal function via the feed forward and feedback processes.
It has been shown that feed forward mechanisms act linearly on stomatal conductance and react with environmental factors (wind speed, air temperature, VPD and solar radiation). In the presence of water stress, feedback mechanisms predominant over direct relationships to regulate the balance between CO2 intake and water loss. Water potential is highly likely to be the mechanistic link between supply (soil water) and environmental demand (VPD), although leaf temperature was also suggested.
To assess the actual condition of the vine growers will continue to rely on measures of the expression of one or several of the processes described above as indicators of the water status of the vine. The next section describes the indicators of water stress currently used or having potential to be used for irrigation scheduling purposes.
1.3 Plant Based Indicators of Water Stress
Various plant-based indicators can be evaluated to understand vineyard's plant water status. As a consequence, winegrowers can come into action regarding irrigation purposes. The plant-based indicators will now be reviewed.
1.3.1 Water Potential
In section 1.1.1 'plant water status' got incorporated into its attributes of its water 'content' and its energy status. To indicate energy status the concept of water potential related to solute flow in the plant hydraulic system (Equation 2) was introduced. In the following water potential measures will be reviewed.
1.3.1.1 Leaf Water Potential
Leaf water potential Ψleaf is by far the most reported plant-based water stress indicator reported in the literature and is usually measured using a pressure chamber (Scholander, et al., 1965; Waring & Cleary, 1967).
The use of this plant-based indicator is also justified due to the probable involvement of Ψleaf in feedback process of stomatal regulation. Indeed, the diurnal behaviour of Ψleaf has been used to classify grapevine cultivars into isohydric and anisohydric groupings (Schultz, 2003).
On the other hand, the Ψleaf of anisohydric cultivars (e.g. Syrah) markedly decreases with increasing evaporative demand demonstrating low stomatal control over transpiration. In contrast the Ψleaf of isohydric cultivars (e.g. cultivar Grenache) remains stable with increasing evaporative demand demonstrating high stomatal regulation over transpiration (Guisard, 2008).
Typically, the diurnal course of leaf water potential shows large variability (Loveys, 2005). Jones (1990, 2007) reported on the rapid response by leaf water potential to environmental changes and therefore the difficulty of interpreting the measurements (see Figure 4).
Reported threshold Ψleaf values for inducing stomatal control range between -1MPa (Carbonneau & Costanza, 2004; Williams & Trout, 2005) and -1.6MPa (Carbonneau et al. 2004; Schultz, 2003), with most accumulated around 1.3 to -1.45MPa (Freeman et al., 1982; M. Kliewer et al., 1983; Kriedemann & Smart, 1971).
1.3.1.2 Pre-Dawn Leaf Water Potential
Consecutively to the development of the pressure chamber (Scholander et al., 1965), pre-dawn leaf water potential (ΨPD) was measured in grapevines and various fruit trees (Klepper, 1968). This measure is now commonly accepted as an indicator of water stress (Carbonneau, 2004a, 2004b; Medrano et al., 2002). During the night, hydraulic gradients at the soil/root interface decrease and stabilise at a value related to the soil water content. The vine's hydraulic system equilibrates, and pre-dawn leaf water potential can be successfully used as a representative indicator of rootzone water status (Lebon et al., 2003).
Figure 4 Illustration of the time course of leaf water potential over three days. Continuous lines represent the irrigated control; dashed lines represent a treatment where water is withheld at the start of the measurements. Smooth lines represent data smoothed using 3 hours running averages and oscillating lines represent instantaneous measurements. Reproduced from Jones (2007)
1.3.1.3 Xylem (Stem) Water Potential
The assessment of water potential in shoot xylem Ψxylem is achieved from leaf petioles after the leaves have been covered and bagged for at least one hour. This allows the xylem water potential of the leaf petiole to equalise with that of the shoot (Chone, 2001). The use of xylem water potential (also termed stem water potential, Ψstem) over leaf water potential is based on a stronger correlation with transpiration in cases of mild water stress (Guisard, 2008).
Such estimates are also less variable than those of Ψleaf (Chone et al., 2000, 2001; Lopes et al., 1999).
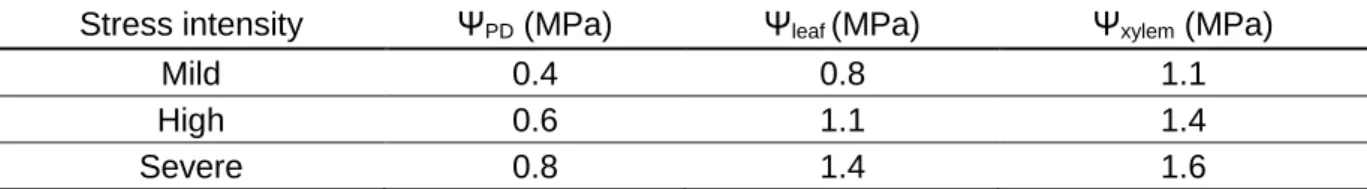
Table 2 compares the threshold values of the various expressions of energy status (ΨPD, Ψleaf and Ψxylem) as reported in the literature.
Table 2 Summary of thresholds for various plant water potentials. Modified from Ojeda (2007), Williams and Araujo (2002) and Carbonneau (2002)
Stress intensity ΨPD (MPa) Ψleaf (MPa) Ψxylem (MPa)
Mild 0.4 0.8 1.1
High 0.6 1.1 1.4
Severe 0.8 1.4 1.6
1.3.2 Canopy Temperature
Water constantly evaporates from surfaces while consuming energy depending on air temperature, air humidity and air velocity above the surface. This energy sink is used by plants to regulate the temperatures of the leaf surface via stomatal conductance of water vapour. Solving the leaf surface energy balance for leaf surface temperature has enabled researchers to formulate the hypothesis that if leaf temperature is known, the equation could be solved for stomatal conductance. In this way leaf temperature might be used as a plant-based indicator of water loss. The temperature of leaves with fully open stomata is below air temperature and increases above air temperature as stomata close (Campbell & Norman, 1998; Jones, 1992).
With the development of portable radiometer application in the field became more convenient and led to successful attempts to predict water stress and the requirement for irrigation in cereals and field crops. Technologies can vary from hand held thermometers to airborne thermography.
The increase of leaf temperature evidences a physical change in stomatal opening regardless of the cause of the change (Cifre et al., 2005), which is not the case in the leaf water potential - stomatal conductance relationship. Grant et al., (2007) showed that canopy temperature was able to differentiate between well irrigated grapevines and vines submitted to deficit irrigation. Similarly, Gonzalez-Dugo et al., (2006) showed that leaf temperature variability within the field of view may be a more sensitive indicator of water stress than leaf temperature itself.
1.3.3 Summary and Conclusions
This section has described the various plant-based indicators available to growers for assessing water stress and planning further viticultural practices. VPD was included due to its relationship with plant transpiration.
The evaluation of plant water status using leaf and pre-dawn water potential represents a large fraction of the literature reflecting its relevance in understanding plant water relationships. However, the relationship between leaf water potential and stomatal conductance reflects differences in the level of stomatal control over water vapour losses at the time of measurement. Stomatal control is itself a genetic response to drought adaptation and demonstrates the necessity to qualify the water potential measurements with some complementary information for appropriate interpretation.
Canopy temperature seems potentially to be a most convenient and useful plant-based indicator of water stress. Like other methods standardisation to remove non-stress related influences will be required. This feature of the measurement in particular makes it appropriate for remote sensing applications as well as land-based measurements. The potential to continually represent canopy conductance and hence quantify irrigation requirements is an attractive application of this technology. In order to explore the capabilities of this indicator, indices of plant stress based upon the surface temperature of leaves are now reviewed.
1.4 Thermal Indices
Tanner (1963) predicted that using portable infrared thermometers with the development of portable infrared thermometers plant temperature, when compared to a well-watered plant or when related to air temperature could be used to study moisture stress (Guisard, 2008). In addition, the observed plant temperature is available as both qualitative and quantitative indicators of plant water regimes (Tanner, 1963).
The energy balance for a crop's surface is described by various authors (Campbell & Norman, 1998; Jones, 1992):
Rn = H + λE + G
(Equation 14) where Rn is the net radiant heat flux density (W.m-2)
G is the soil heat flux density (W.m-2) H is the sensible heat flux density (W.m-2) λ is the heat of vaporisation (J.mol-1) E is the transpiration rate (mol.m-2.-s-1)
G is usually assumed to be negligible (Campbell & Norman, 1998), therefore reducing Equation 15 to:
Rn = (H+ λE)
(Equation 15) where E can be defined as:
E = gs 𝑉𝑃𝑊
𝑝𝑎
(Equation 16) and H can be defined as:
H = 2 cp gHa (Tleaf – Ta)
(Equation 17) where pa is the atmospheric pressure (kPa)
cp = 29.3 is the specific heat of air at constant pressure (J.mol-1.°C-1) gHa is the boundary layer conductance for heat (mol.m-2.s-1)
Tleaf is the surface temperature of a leaf (°C) Ta is the ambient air temperature (°C)
Equation 15 shows that the incoming radiation Rn is the driving source of energy for the leaf system, and that energy can only be lost via transpiration (λE) or sensible heat (H). λ is considered constant (44.1 kJ.mol-1 at 20°C) and E is controlled by stomatal conductance (Equation 17). Loss of energy (H) is a function of gHa and related to wind speed.
If stomata close when radiation is steady, λE is reduced resulting in an elevation of Tleaf. Although largely simplified, this analysis forms the mechanistic justification for the use of leaf temperature as an indicator of stomatal behaviour.
The following sections review various indices based upon the evaluation of canopy temperature.
1.4.1 Stress Degree Day
Irrigation scheduling based on the canopy to air temperature differential (δTc-a) and the volumetric soil water content has mostly occurred in the form of the stress degree day (SDD) method, originally proposed by Jackson, Reginato & Idso (1977):
SDD = ∑𝑁𝑛=𝑖𝑇𝑐 − 𝑇𝑎
(Equation 18) where Tc is the canopy temperature at 2 p.m. (°C)
Ta is the air temperature at 2 p.m. (°C) i is the first day after irrigation
N is the number of days required for SDD to reach a set value
Irrigation is started as soon as SDD exceeds 0. It was reported to predict successfully the onset of water stress in grapevines when δTc-Ta was larger than -2.5°C (Ezzahouani & Williams, 2007).
1.4.2 Crop Water Stress Index
Crop Water Stress Index (CWSI) is a widely used indicator that provides an estimate of crop water status with respect to minimum and maximum levels of stress that can occur due to availability or unavailability of water. CWSI can be estimated using the following equation:
CWSI = 𝑇𝑐𝑎𝑛𝑜𝑝𝑦−𝑇𝑤𝑒𝑡
𝑇𝑑𝑟𝑦−𝑇𝑤𝑒𝑡
(Equation 19) where Tcanopy is the canopy surface temperature (°C)
Twet is the leaf surface temperature of the moistened reference leaf (°C) Tdry is the leaf surface temperature of the oiled reference leaf (°C)
In grapevines, when used concurrently with infrared thermography. CWSI was able to distinguish between irrigation treatments (Grant et al., 2007; Möller et al., 2007; Walker, 1993).
1.4.3 Jones Index or Stomatal Conductance Index (Ig)
Jones (1999a) proposed to solve the energy balance equation by using reference surfaces representing a non-transpiring dry leaf (leaf coated with Vaseline) (Tdry, °C), and a 'pseudo' fully evaporating wet leaf surface (leaf sprayed with water) (Twet, °C).
Combining a relative approach with a quantitative methodology, the energy balance (Equation 15) is solved for stomatal conductance (gs) giving:
gs = Ig x G
(Equation 20) where 𝐼𝑔 = (𝑇𝑑𝑟𝑦 − 𝑇𝑙𝑒𝑎𝑓)(𝑇𝑙𝑒𝑎𝑓 − 𝑇𝑤𝑒𝑡)
(Equation 21) 1.4.4 Summary and Conclusions
This section reviewed the physiology of grapevines, in the context of water stress. It has been demonstrated that leaf and stem water potential measurements require expert interpretation with regard to providing information on stomatal and non-stomatal regulation of transpiration and CO2 accumulation. These measures and ΨPD are nevertheless useful indicators of the water status of a grapevine.
Adaptive mechanisms to water stress were reviewed from a botanical aspect, describing the mechanisms of stomatal regulation. Several plant-based indicators of water stress were reviewed, and all were found to have various levels of suitability. Water potential (as leaf, pre-dawn or xylem) is by far the most used methodology for commercial.
Canopy temperature was shown to be correlated with the physical behaviour of stomata. Various indices based upon the temperature of canopies were reviewed and only indices derived from mechanistic methodologies (CWSI and Ig) were found to appropriately represent the situation of mild water stress. So far, the literature reviewed the assessment of grapevine indicating water stress. Central to that research is an appropriate technology to measure rapidly, accurately and cost effectively the variability of stomatal behaviour and its
In the following section the literature review will examine opportunities to provide an intercomparison of technology to monitor plant water status and detect the early onset of water stress using land based remotely sensed thermal imagery whilst checking on their reliability by comparing plant physiological variables.
1.5 Technology in Precision Viticulture 1.5.1 State of the Art Review
Vineyards are characterized by a high heterogeneity due to the cultivation environment, such as soil characteristics, microclimate, seasonal weather and cropping practices.
This variability causes different vine physiological response, with direct consequences on grape quality. Therefore, vineyards require a specific and differentiated agronomic management to satisfy the real needs of the crop, in relation to the spatial variability within the vineyard.
The introduction of new technologies for supporting vineyard management allows to improve the efficiency and quality of production and. at the same time, reduces the environmental impact, such as energy, fertilizers, chemicals and labour costs. Recent technological developments have allowed useful tools helping to monitor and control of many aspects of vine growth. Remote and proximal sensing sensors become strong investigation instruments of the vineyard status, such as water and nutrient availability, plant health and pathogen attacks, or soil conditions to describe spatial variability (Matese et al., 2015).
This chapter of the literature review presents a review of technologies used in precision viticulture. It is divided in two main sections. The first one focuses on monitoring technologies, which is the basis of mapping spatial variability; the second part discusses thermography, the technology utilized to provide information on canopy temperature.
1.5.2 Monitoring Technologies
The primary objective of the monitoring process is acquisition of the maximum amount of georeferenced information within the vineyard. A wide range of sensors aiming to monitor different parameters that characterize the plant growth environment are employed in precision viticulture for remote and proximal monitoring of geolocated data. (Matese & Di Gennaro, 2015)
1.5.3 Remote Sensing
Remote sensing is the detection and monitoring of physical characteristics of an object or phenomenon without making physical contact with it but by measuring its reflected and emitted radiation at a distance from the targeted area. Thus, it is in contrast to on-site observation.
1.5.3.1 UAV
Unmanned aerial vehicles (UAV), or also commonly called 'drones' found their way into precision viticulture due to automation development. These fixed or rotary wing platforms can fly autonomously and be remote controlled at visual range by a pilot on the ground or fly autonomously to a user-defined set of programmed waypoints. These platforms can be equipped with a series of sensors, which allow a wide range of monitoring operations to be performed.
A special feature about mounted sensors on UAV is the high spatial resolution (up to centimetres), their flexibility and their monitoring speed. For these reasons, UAV are ideal in vineyards of medium to small size (1–10ha), especially in areas characterized by high fragmentation due to elevated heterogeneity. Limiting factors are the payload weight and their operating time.
1.5.3.2 Remote Sensing Sensors and Applications
Applications of remote sensing in precision viticulture are focused mainly on reflectance spectroscopy, an optical technique based on reflectance measurement of the incident electromagnetic radiation at different wavelengths, particularly in the visible region (400-700nm), near infrared (700-1.300nm), and thermal infrared (7.500-15.000nm). Different surface types such as water, bare ground and vegetation reflect radiation differently in various channels. Therefore, the spectral reflectance of a body, such as a crop or soil, is called the 'spectral signature', and is represented on an XY graph, with the reflectance value on the ordinate and the wavelength of the spectrum on the abscissa (Matese et al., 2015). Common sensors detect alterations of transpiration or photosynthetic activity on the leaf surface by measuring remotely leaf temperature, which increases when water stress conditions occur, as stomata closes reducing the water loss and at the same time interrupts the cooling effect of transpiration. In addition, alterations in photosynthetic activity are linked to the nutritional status, health, and vigour of the plants, and can be detected with multispectral and hyperspectral sensors.
Leaf reflectance is influenced by various factors in specific regions of the spectra: within the visible spectrum by the photosynthetic pigments, such as chlorophyll and carotenoids; in the near infrared spectrum by the structure of the leaves (size and distribution of air and water within the canopy); and in the infrared spectrum by the presence of water and biochemical substances, such as lignin, cellulose, starch, protein, and nitrogen.
Satellite and aerial images are used to estimate spatial patterns in crops, using vegetation indices such as the NDVI, that in turn can be related with different factors, such as the LAI (leaf area index), the presence of nutrient deficiencies, water stress status, or health status. (Matese et al., 2015)
1.5.4 Proximal Sensing
Proximal sensing or ground sensing technologies are able to outflank the problem of environmental interaction such as cloud or wind due to their close proximity to the vine canopy reducing or eliminating reflectance interference. When coupled with a differential GPS, these ground sensors are able to deliver data of high spatial resolution that can be integrated with material delivery systems to facilitate real-time and variable rate applications. In addition, many tools are available for continuous measurements carried by moving vehicles or instruments for precise ground observations made by an operator.
1.5.5. Thermal Imaging
The measurement of leaf temperature by using thermal infrared (IR) sensing is primarily used to study plant water relations, and especially stomatal conductance. A major determinant of leaf temperature is the rate of evaporation or transpiration from the leaf. The cooling effect of transpiration arises because a substantial amount of energy (the latent heat of vaporisation, λ; Jmol-1, equation 15) is required to convert each mole of liquid water to water vapour, and this energy is then taken away from the leaf in the evaporating water and, thus, cools it. (Jones, 2004)
In-field, the non-invasive assessment of grapevine water status and its variability within the vineyard is a valuable tool in precision viticulture. Correlation analyses between thermal indices and physiological parameters such as gs and leaf water potential have been carried out in the field using non-destructive portable sensors in commercial vineyards providing strong correlation levels. The main advantages these methods have, is the easy implementation and processing and immediate response.
Application on larger scale has been introduced by aerial thermal imaging, that successfully covered large extensions of vineyard or mounting automatic acquisition systems in on-work agricultural vehicles.
1.5.5.1 Difficulties on Field-Scale
Though the potential of infrared imaging for detection of hydric stress has been highlighted there are some disadvantages and specific considerations that need to be taken into account, such as
(1) The Variation of Radiation
Of particular interest for the application of thermal imaging to phenotyping and irrigation studies is the sensitivity of Tleaf (or of Ig and other indices) to changes in stomatal conductance as a function of the expected variation due to environmental variables. Here, the thermal approach will be of little value where the environmentally caused variation in temperature is greater than the ‘sensitivity’, that is the range in temperature caused by a specified variation in conductance (Jones 1994). Nevertheless, by viewing an ensemble of leaves in a canopy, it may be possible to obtain a more robust estimate of the mean temperature (Jones et al. 2002).
(2) Leaf Temperature Variation as Function of Absorbed Radiation
A critical variable in equation 16 for stomatal resistance is the net radiation absorbed by the leaf or canopy. This is because the leaf temperature increases linearly as absorbed radiant energy increases (other factors being constant). Several studies have demonstrated that the range of leaf temperatures for individual leaves in a homogeneous grapevine canopy may vary when comparing leaves directly illuminated normal to the solar beam and those in shaded parts of the canopy (Jones et al. 2002; Leinonen & Jones 2004; Grant et al. 2007). The temperature of any leaf will also depend on the position in the canopy and its orientation as a result of the local variation in irradiance, due to canopy structure and due to mutual shading.
Thus, the radiant energy absorbed by different leaves at any one time may vary by up to an order of magnitude, with consequential substantial impacts on canopy temperature. (Jones et al., 2009)
Canopy growth and architecture can affect the amount of sun-exposed leaf material: high vigour canopies will present more shading and bigger canopies low vigour canopies have a higher gap fraction, which will result in more sun-exposed leaf material. (Fuentes et al., 2012)
(3) Inclusion of Non-Leaf Material in the Analysis
The incomplete ground cover may have implications for the airborne thermography measurements through the potential aggregation of crop canopy and the background soil temperatures, which in the case of dry soil is often warmer than the crop canopy.
In such cases, a pixel is likely to comprise both soil and plant canopy temperatures, thereby resulting in 'mixed pixels'. The presence of mixed pixels is likely to affect the observed temperature toward the soil background temperature (Jones & Sirault, 2014).
(4) Data Analysis
There is a certain difficulty in the analysis of large volumes of data, since every pixel from each image is effectively a temperature reading (usually 5 megapixels per image) (Wang et al., 2010). If done manually, however, the necessary image processing can be rather labour‐ intensive and may also be dependent on subjective image interpretation.
1.5.5.2 Conclusions
The review on thermal imaging presented here shows the enormous potential for the use of thermal sensing at a field scale for detecting differences in stomatal conductance as a measure of plant response to water deficit. Although thermal imaging does not directly measure stomatal conductance, in any given environment stomatal variation is the dominant cause of changes in canopy temperature (Jones, 2004). It has also been widely suggested that thermal imaging can be used as a component of a remote sensing system for diagnosing plant stresses.
2. Materials and Methods 2.1 Experimental Sites
The study was conducted during the 2017 growing season in a 1.5-ha vineyard of a commercial winery in the Colli Piacentini area, Italy. The experimental site located near Borgonovo Val Tidone in the North West of Emilia-Romagna (44°59'22.3"N 9°22'01.8"E, 273 m above sea level) consists of the cultivar 'Barbera'. The six-year-old vineyard was planted along East-West row orientation, at a spacing of 2.5 m x 1.2 m (between row and in-the-row spacing, respectively), and with a vertical shoot positioning training system. The slope of the experimental field was around 5 - 20% in the East-West direction. The soil is mostly of clay loam texture.
The climate at the site is temperately sub continental, with warm but humid summers and cold winters. Annual minimum and maximum mean air temperatures occur in January and July, with values of 1.8°C and 23.4°C. Rainfall occurs mainly in autumn, winter and spring, with a long-term annual average of 858 mm. The driest month is July, with low rainfall during that period (for example, less than 56 mm during the 2017 season). This site is not irrigated. Meteorological data for the entire experimental period were provided by an automated weather station of project NutriVigna, located within the experimental vineyard. Observations of the respective week (7 days) before each campaign give information about prevailing water stress.
The period before the 3rd of July is characterized by a medium temperature of 21.9°C and a maximum mean temperature of 29.5°C. At the onset of the observed week, 6mm of precipitation occurred. During the flight campaign of the 3rd of July between 1pm and 2pm the medium air temperature was 30.6°C and the maximum mean temperature was 32.3°C.
The increase of medium day temperature during the week preceding the campaign date is documented and represents a rising potential of hydric stress.
The period before the 26th of July is characterized by a medium temperature of 24.9°C and a maximum mean temperature of 32.5°C. This means a respective increase of 3°C compared to the period before the 3rd of July. In the middle of that observed week also 6mm of precipitation occurred. During the flight campaign of the 26th of July between 1pm and 2pm the medium air temperature was 30.2°C and the maximum mean temperature 31.3°C. Also in the case of this observed period, the increase of mean daily temperature during the week until the campaign date is documented and represents a rising potential of hydric stress. 2.2 Experimental Design
For the assessment of plant water status variability by proximal and remote thermal imagery and its comparison to ground measurements two experimental campaigns, ground-truthing and the drone campaign to remotely sense canopy temperature, were conducted on the 3rd and 26th of July 2017. Based on a Normalized Difference Vegetation Index (NDVI) map of the experimental site's differing vigour zones, eight vines of low and eight vines of high vigour were chosen to perform ground measurements and to be targeted by remote sensing. Later, vines' performances within those 'treatments' of low vigour (LV) and high vigour (HV) were statistically analysed. With regard to water availability and individual vigour presented by the NDVI map, the behaviour towards water stress was assessed.
2.3 Plant Physiological Variables 2.3.1 Leaf Water Potentials
Vine water status by their leaf water potentials of four vines per vigour zone was evaluated on both experimental days using midday leaf water potential (ΨMD) measured by a Scholander pressure chamber (SKPM 1405, Skye Instruments Ltd, Llandrindod Wells, UK). ΨMD values were measured on two leaves per vine. The selected leaves were mature, healthy, and taken from the mid outer zone of the canopy. In addition, on the 26th of July 2017 predawn leaf water potential (ΨPD) was measured on four of eight vines per vigour zone, assumed to represent the mean soil water potential next to the roots. 2.3 Plant Physiological Variables
2.3.2 Leaf Gas Exchange
During ΨMD measurements, parameters of gas exchange, stomatal conductance (gs), transpiration (E) and assimilation (A) were also measured on all tagged plants using a portable infrared gas analyser equipped with a leaf chamber having a window (LCi T Compact Photosynthesis System Hoddesdon, Herts, UK) on four fully-expanded and sun-exposed leaves (each with a basal, medium, apical and lateral leaf). Measurements were taken at ambient air temperature. The molar air flow rate inside the leaf chamber was 500 μmol.mol−1. All measurements were taken at a reference CO
2 concentration similar to ambient (380 μmol.mol−1) and at a saturating photosynthetic photon flux, ensuring that the leaves receive over 1000 μmol.m−2.s−1 (no external light source was used in this study). The
measurements for ΨMD were repeated for same plants; gas exchange for even the same leaves within each treatment. During both experimental campaigns, the plant-based variables were measured between 12:00 p.m. and 2:00 p.m. on the same day and time that the thermal images were acquired.
2.4 Soil Sampling
After the vegetative cycle, on the 26th and 28th of September 2017 in each targeted vigour zone three soil samples in the inner row were taken. The media of values for physical and chemical properties were presented and soil texture defined.