Infrared thermometry to schedule irrigation of common bean
Francisco de Almeida Lobo(1), Marco Antonio Oliva(2), Morethson Resende(3), Nei Fernandes Lopes(4) and Moacyr Maestri(2)
(1)Universidade Federal de Mato Grosso, Fac. de Agronomia e Medicina Veterinária, Dep. de Solos e Engenharia Rural, Av. Fernando Corrêa, s/no, Coxipó, CEP 78060-900 Cuiabá, MT, Brasil. E-mail: lobo@alunos.ufv.br (2)Universidade Federal de Viçosa, Dep. de Biologia Vegetal, Av. P.H. Rolf, s/n, CEP 36571-000 Viçosa, MG, Brasil. E-mail: moliva@ufv.br (3)Embrapa Milho e Sorgo, Rod. MG 424, km 65, CEP 35701-970 Sete Lagoas, MG, Brasil. E-mail: resende@cnpms.embrapa.br (4)Universidade Federal de Pelotas, Dep. de Botânica, Caixa Postal 354, CEP 96010-900 Pelotas, RS, Brasil. E-mail: nlopes@ufpel.tche.br
Abstract – The objective of this work was to determine the critical irrigation time for common bean (Phaseolus vulgaris L. cv. Carioca) using infrared thermometry. Five treatments were analyzed. Canopy temperature differences between plants and a well-watered control about 1, 2, 3, 4, and 5±0.5ºC were tested. Physiological variables and plant growth were analyzed to establish the best time to irrigate. There was a significant linear correlation between the index and stomatal resistance, transpiration rate, and leaf water potential. Although significant linear correlation between the index and mean values of total dry matter, absolute growth rate, and leaf area index was found, no correlation was found with other growth index like relative growth rate, net assimilation rate, and leaf area ratio. Plants irrigated when their canopy temperature was 3±0.5ºC above the control had their relative growth rate mean value increased up to 59.7%, yielding 2,260.2 kg ha-1, with a reduction of 38.0% in the amount of water used. Plants irrigated when their canopy temperature was 4±0.5ºC yielded 1,907.6 kg ha-1, although their relative growth rate mean value was 4.0% below the control. These results show that the best moment to irrigate common bean is when their canopy temperature is between 3ºC and 4±0.5ºC above the control.
Index terms: irrigation scheduling, water use efficiency, growth rate.
Termometria ao infravermelho na programação da irrigação de feijoeiro
Resumo – O objetivo deste trabalho foi determinar o momento crítico para efetuar a irrigação do feijoeiro (Phaseolus vulgaris L. cv. Carioca) utilizando a termometria ao infravermelho. Foram analisados cinco tratamen-tos. As diferenças entre a temperatura foliar das plantas e a de um controle mantido bem irrigado testadas foram de 1, 2, 3, 4 e 5±0,5ºC. Foram analisadas variáveis fisiológicas e de crescimento para identificar o melhor momento de irrigação. Encontrou-se uma correlação linear significativa entre o índice empregado e a resistência estomática, a taxa transpiratória e o potencial hídrico foliar. Embora tenha-se verificado uma correlação linear significativa entre o índice empregado e os valores médios da matéria seca total, da taxa de crescimento absoluto e do índice de área foliar, não se verificou qualquer correlação significativa com os demais índices de crescimento, como a taxa de crescimento relativo, a taxa assimilatória líquida e a razão de área foliar. As plantas irrigadas a uma temperatura foliar de 3±0,5ºC acima do controle apresentaram um incremento de 59,7% no valor médio da sua taxa de crescimento relativo, produzindo 2.260,2 kg ha-1 de grãos, com uma redução de 38,0% na quantidade de água aplicada. As plantas irrigadas a uma temperatura foliar de 4±0,5ºC acima do controle produziram 1.907,6 kg ha-1 de grãos, contudo o valor médio de sua taxa de crescimento relativo foi de 4,0% inferior ao controle. Estes resulta-dos demonstram que o melhor momento de se irrigar o feijoeiro é quando apresentam temperatura foliar entre 3ºC e 4±0,5ºC acima do controle.
Termos para indexação: planejamento da irrigação, eficácia no uso da água, taxa de crescimento.
Introduction
The relationship between plant canopy temperature and water availability in the soil has been investigated by infrared thermometry (Idso et al., 1981; Jackson et al., 1981; Clawson & Blad, 1982), in search for a suitable thermal index to establish the proper irrigation
time. One of the first indices was the “stress-degree-day”, based on the relationship between the difference of the canopy and air temperature with the yield and water requirement of the crop (Jackson et al., 1977).
temperature depends on the energy balance, all the factors affecting it should be included in the elaboration of the thermal index. A new index, the “crop water stress index” (CWSI), was proposed by Idso et al. (1981), considering the energy balance of the crop canopy. The authors established critical limits for the temperature difference between the canopy and the air (Tc - Ta), especially when the canopy resistance to vapor transport assumed an infinite value (upper limit) and the zero value (lower limit). In this case, for well-watered crops under clear sky condition, a linear regression of Tc - Ta and water vapor pressure deficit was obtained and used as a baseline to define CWSI. They showed that the CWSI is equal to one minus the ratio of actual to potential evapotranspiration (1 - Ea/Ep) obtained from the Penman-Monteith equation (Monteith, 1973).
The usefulness of CWSI in arid and semi-arid environments was found by means of many studies but, as Jones (1999) pointed out, some errors can occur specially in humid or unstable climates. In those cases, wind speed, surface roughness, and the radiation balan-ce are as important in Tc - Ta variations as water vapor pressure deficit.
According to Gardner et al. (1981), the standard deviation of plant canopy temperature increases as the water availability in the soil decreases. Standard deviation values of 0.3ºC and 4.2ºC were found for well irrigated and stressed maize plants, respectively. Clawson & Blad (1982) found a difference of 0.7ºC between the maximum and minimum temperature at the ideal moment to irrigate within the same maize plots. However, Fuchs & Tanner (1966) proposed the use of a well-watered control as a reference to assess the plant water status. The difference between the canopy temperature of plants under different soil water availability and the control plants was used to establish an index of stress level. In this case, there would be no need to associate those weather factors that could affect the energy balance of the plant canopy, as they affect equally both the control and any other plot in the vicinity. This index, however, has up to now attracted little attention of researchers, probably because the presence of a well-watered plot is not always possible in a commercial crop (Jones, 1999). Considering this aspect, De Lorenzi et al. (1993) proposed a model for canopy temperature simulation for well-watered plots as function of the weather conditions. Considering the instability of the Tc - Ta values in the tropical regions, it is possible that the index proposed by Fuchs & Tanner (1966), relating Tc with the canopy
temperature of a well-watered plot, is more stable than the other relationships. It can, therefore, be used as an index to establish the critical time to irrigate commercial crops, just because there is no reason to justify any impossibility to have a well-watered plot as a control.
Common bean is a staple food crop in Brazil and its cultivation with irrigation has increased in the last few years. Water management has therefore to be considered, in addition to other practices. The objective of this work was to determine the critical irrigation time for common bean (Phaseolus vulgaris L. cv. Carioca) using infrared thermometry.
Material and Methods
The experiment was carried out at Embrapa Milho e Sorgo, Sete Lagoas, MG, Brazil (19o18' S, 45º15'8" W, 736 m altitude). The climate is Aw (Savannah climate with dry winters) according to the Köppen classification. Table 1 shows the weather conditions during the experimental period.
Common bean (Phaseolus vulgaris L. cv. Carioca) was cultivated in a Dark-Red Latosol clay texture (Typic Haplustox), pH 5.4 and a chemical composition of 2.2 mmolc dm-3 of Al; 45.3 mmolc dm-3 of Ca; 6.3 mmolc dm-3 of Mg; 61.6 mg dm-3 of K; 21.7 mg dm-3 of P; and 39.7 g kg-1 of organic matter. Fertilization was carried out at the sowing time, using 500 kg ha-1 of N:P2O5:K2O (4:14:8) and 160 kg ha-1 of K-Mag (22% S, 22% K2O and 11% Mg), according to Moraes (1988). The space between rows was 0.45 m with plant density of 13 plants per meter (289,000 plants ha-1). Mechanical weeding was done 22 days after sowing. Urea, 65 kg ha-1, was applied with irrigation as complementary fertilization, 31 days after sowing. Each plot received a specific irrigation treatment by sector sprinklers with 6.56×10⁻⁴ m3 s-1 flow rate. A total of
Table 1. Weather conditions during the experimental period(1).
Weather variables Air temperature (ºC)
Maximum air temperature (ºC) Minimum air temperature (ºC) Relative humidity (%)
Average daily solar radiation (W m-2)
Midday photosynthetic active radiation (µmol m-2 s-1)
Maximum Minimum Mean 33.6
_ _ 98.9 241.6 2,105
3.9 _ _ 43.0 76.8 3 9 2
23.4 31.3 10.1 81.3 187.3 1,305
15 water-collector cans were installed in each plot to quantify the amount of water applied.
A total of six 18x18 m plots were used, each with an eight meters border. A completely randomized design was used, with six, three, and four replications for physiological traits, growth analysis and yield, respectively.
In the first two weeks after sowing, all plots received the same amount of water. From the 10th through 29th day after emergence (DAE), the irrigation time was based on preestablished soil water potential (Ψsoil) for each treatment. This procedure was done just to provide different levels of water stress when plants had minimal leaf area to be assessed by infrared thermometer.
A previous water retention curve was performed to indicate how much to irrigate during the experiment. The plants in ∆Tc-1 and ∆Tc-2 treatments were irrigated when Ψsoil was equal to -0.05 MPa, in ∆Tc-3 treatment when Ψsoil was equal to -0.20 MPa, in ∆Tc-4 treatment when Ψsoil was equal to -0.6 MPa, and in ∆Tc-5 treatment when Ψsoil was equal to -1.00 MPa. The Ψsoil was daily measured by three tensiometers and three plaster blocks per plot (Rundel & Jarrel, 1989), which were installed at 0.05 m from the cultivation row at 0.20 m depth. Once those Ψsoil were reached, each plot was irrigated to raise the soil water content from its actual value to the field capacity, according to the water retention curve.
From the 30th DAE, irrigation time was monitored by the difference of the plant canopy temperature (∆Tc = Tc plot - Tc irrigated control). Five levels of ∆Tc were defined: ∆Tc-1, ∆Tc-2, ∆Tc-3, ∆Tc-4 and ∆Tc-5. The plants from treatments ∆Tc-1 to ∆Tc-5 were irrigated to raise the soil water content from its actual value to field capacity when the ∆Tc was 1, 2, 3, 4 and 5ºC respectively, with a tolerable variation of ±0.5ºC. The soil on the control plot (∆Tc-0) was kept at Ψsoil greater than -0.01 MPa, by daily irrigation throughout the cycle.
Canopy temperature was obtained at a variable distance of 0.1 to 0.3 m from the leaves exposed to incident radiation with a portable infrared thermometer, model AG 42 with 4º angle field of view, spectral response of 8 to 14 µm range and emissivity adjusted to 0.99. Measurements were done at 90º angle with leaf surface. Using that variable distance and due to the thermometer field of view, the maximum leaf area sampled was settled in 345 mm2, avoiding thus infrared radiation other than that emitted by leaves to be capted by the equipment.
Six Tc readings were done daily in each plot starting at 12h, to determine the actual mean ∆Tc. The measurements were done in an alternating sequence to minimize the effect of the Tc variation with the time of measuring.
When the specific ∆Tc previously established for each treatment was achieved, the leaf water potential (Ψw) was measured with a pressure chamber model 3005 Plant Water Status Console, and stomatal resistance (Rst) and transpiration rate (E) by a “steady state” porometer model LI-1600. All the variables were obtained using the same six leaves per plot whose Tc were previously taken.
Plant samples to analyze the growth, and in order to compare growth indices mean values among the different plant populations, were taken weekly from the second week after sowing until the end of the crop cycle. The dynamic of growth was analyzed by means of regression methods (Hunt, 1990). Two points distant apart at the linear phase of total dry matter were used to identify specific DAE, in order to calculate growth indices mean values by classical methods (Hunt, 1990). Three samples of plants cut off near the soil were taken from 0.3 m at the line in each treatment and packed in plastic bags for further organ separation. The roots were extracted using a 0.3 m diameter and 0.4 m long cylinder device to remove soil blocks from the same places where the plants were collected. The samples were then washed on a metal sieve to remove the adhered soil. The leaf area was measured with a photoelectric integrator model LI-300A. Dry matter was obtained after drying the plant tissues in a ventilated oven, at 75ºC for 48 hours.
The final yield was obtained by harvesting an area plot of 2.5x4.95 m. Four replications per treatment were used. The grains were weighed and their moisture content determined to correct the final grain weight to 13% moisture. Original data was submitted to ANOVA and the means was compared by Tukey test at 5% probability.
Results and Discussion
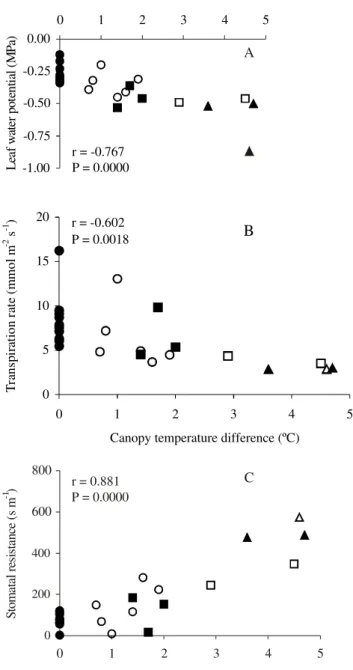
The difference between the canopy temperature of plants under certain water availability in the soil and that of control plants cultivated under field capacity was closely associated with the traditional variables of water status in plants.
Figure 1. Pearson correlation between canopy temperature differences and leaf water potential, transpiration rate, and stomatal resistance of Phaseolus vulgaris plants submitted to different irrigation scheduling, according to the canopy temperature; the treatments ∆Tc-1 (¡), ∆Tc-2 ( ), ∆Tc-3 (∆),
∆Tc-4 ( ) and ∆Tc-5 ( ) were irrigated when their plant canopy temperature were 1, 2, 3, 4, and 5±0.5ºC greater than that of the control ∆Tc-0 ( ), respectively.
were negative while those between ∆Tc and Rst were positive (Figure 1C). This indicates that the Tc increment in plants under soil water restriction responds to a
sequence of events, which begin with a fall in Ψsoil. The actual imbalance between water loss by transpiration and uptake by roots reduces Ψw and increases Rst as a plant response toward a new steady state. The reduction in water fluxes accompanying transpiration leads to Tc increases.
The weather conditions and the soil water availability are the primary factors affecting the water plants content, characterized by variables such as Ψw, Rst and E. The alterations in these variables are associated with plant adjustment mechanisms to the present stress conditions, and the reduction of water availability in the soil primarily increases Rst with a consequent reduction in E (Davies & Zhang, 1991). However, this economy in water use reduces the latent heat dissipation as part of transpiration that can cause an increase in the plant mass temperature (Nobel, 1991).
According to Pazzeti et al. (1992), the critical Ψw for Carioca cultivar is -0.60 MPa, below which the Rst increases drastically. The authors further found that plants with the same Ψw of -0.80 MPa had Rst of 150 or 800 s m-1 when the Ψ
soil reached -0.04 or -1.50 MPa, respectively. However, the correspondence that was established some time ago between Ψw and Rst was that a critical level of the first would determine variations in the second. In this sense, Begg & Turner (1976) found that values of Ψw between -0.75 and -0.90 MPa caused complete stomatal closure in common bean cultivars.
Some studies showed that the critical Ψw level to de-termine stomatal closure in field-cultivated plants was smaller than for those cultivated in pots (Jordan & Ritchie, 1971). This suggested a certain limitation of Ψw as a water deficit indicator in plants.
This becomes more evident when some literature data showed that the actual rate of plant growth and the Rst would be much more sensitive to the soil water content than the Ψw itself (Bates & Hall, 1981; Davies & Zhang, 1991). Taking that assumption it could be expected a negative correlation between the rate of plant growth and ∆Tc. Assessment of the water and temperature stress effect on the growth rates of common bean populations showed that ∆Tc did correlate linearly with the mean values of total dry matter (Wm), absolute growth rate (AGRm), and leaf area index (LAIm). However, no linear correlation was observed between the index and mean values of relative growth rate (RGRm), net assimilation rate (NARm), and leaf area ratio (LARm) (Figures 2 and 3).
0 5 10 15 20
0 1 2 3 4 5
Canopy temperature difference (ºC)
T
ra
n
sp
ir
at
ion
ra
te
(m
m
o
l
m
-2
s
-1 ) r = -0.602 B
P = 0.0018
A
-1.00 -0.75 -0.50 -0.25 0.00
0 1 2 3 4 5
L
ea
f
w
at
er
p
o
te
n
ti
al
(M
P
a)
r = -0.767 P = 0.0000
0 200 400
600 800
0 1 2 3 4 5
Canopy temperature difference (ºC)
S
to
m
at
al
re
si
st
an
ce
(s
m
) r = 0.881 C
P = 0.0000
Figure 2. Pearson correlation between canopy temperature difference and growth indices mean values of Phaseolus vulgaris plants submitted to different irrigation scheduling, according to the canopy temperature. The treatment plots were irrigated when their plant canopy temperature were 1, 2, 3, 4, and 5±0.5ºC greater than that of the control, respectively.
0 100 200 300 400 500 600 T o ta l d ry m at te r m ea n v al u es (g m -2 ) A
r = -0.819 P = 0.0459
0 5 10 15 20 25 30 A b so lu te g ro w th ra te m ea n v al u es (g m -2 d -1 ) B
r = -0.831 P = 0.0402
0.00 0.01 0.02 0.03 0.04 0.05 0.06 0.07 R el at iv e g ro w th ra te m ea n v al u es (g g -1 d -1 ) C
r = -0.051 P = 0.9234
0 1 2 3 4 5 6 L ea f ar ea in d ex m ea n v al u es (m 2 m -2 ) D
r = -0.897 P = 0.0153
0 1 2 3 4 5 6 7
0.0 0.5 1.0 1.5 2.0 2.5 3.0
Canopy temperature difference mean values (oC) Canopy temperature difference mean values (oC)
N et as si m il a ti o n ra te m ea n v al u es (g m -2 d -1 ) E
r = 0.672 P = 0.1438
0.000 0.002 0.004 0.006 0.008 0.010 0.012
0.0 0.5 1.0 1.5 2.0 2.5 3.0
L ea f a re a ra ti o m ea n v al u es (m 2 g
-1 ) F
Figure 3. Instantaneous growth indices values of Phaseolus vulgaris plants submitted to different irrigation scheduling, according to the canopy temperature. The treatments ∆Tc-1 (¡), ∆Tc-2 ( ), ∆Tc-3 (∆), ∆Tc-4 ( ) and ∆Tc-5 ( ) were irrigated when their plant canopy temperature were 1, 2, 3, 4, and 5±0.5ºC greater than that of the control ∆Tc-0 ( ), respectively.
0 200 400 600 800 1.000 1.200
T
o
ta
l
d
ry
m
at
te
r
(g
m
-2 )
A
0.000 0.025 0.050 0.075 0.100
R
el
at
iv
e
g
ro
w
th
ra
te
(g
g
-1 d -1 )
C
0 2 4 6 8 10
0 20 40 60 80 100 120
Days after emergence
N
et
ass
im
il
ati
on
ra
te
(g
m
-2 d -1 )
E
0 5 10 15 20 25 30
A
b
so
lu
te
g
ro
w
th
ra
te
(g
m
-2
d
-1 )
B
0 1 2 3 4 5 6
L
ea
f
ar
ea
in
d
ex
(m
2 m -2 )
D
0.000 0.010 0.020 0.030 0.040
0 20 40 60 80 100 120
Days after emergence
L
ea
f
ar
ea
ra
ti
o
(m
2 g -1 )
Working with wheat in this same line, Saadalla & Alderfasi (2000) found significant correlation between the canopy temperature depressions below the air (TD) and the number of spikes per square meter (r = 0.54; P<0.05), grain number per spike (r = 0.48; P<0.05), and kernel weight (r = 0.66; P<0.01). They proposed TD as a selection tool for genotypic drought adaptability in wheat.
The ∆Tc’s mean values recorded throughout the cycle were equal to 0.0, 0.60, 1.3, 1.7, 2.2 and 2.8ºC for plants under ∆Tc-0, ∆Tc-1, ∆Tc-2, ∆Tc-3, ∆Tc-4 and ∆Tc-5 treatments, respectively. These mean values were calculated from the daily ∆Tc of the plant populations and are, therefore, inferior to the critical values established to indicate the irrigation time. After irrigation, the canopy temperature of the plants decreased sharply and it took some days for them to show their critical value again.
As Tc increased, LAIm and LARm decreased, but Wm only started to decrease when a ∆Tc mean value was around 1.7ºC, corresponding to ∆Tc-3 treatment. Plants in this treatment had the higher mean values of AGRm, RGRm and NARm.
The increase in the canopy temperature up to the limit of ∆Tc-3 treatment could not be established as a stress factor based on the analysis of the AGRm, RGRm and NARm. In this range of canopy temperature, a physiological adjustment was found which enabled the plants to become more efficient in photosynthesis and water use. Plants at ∆Tc-4 treatment had 4% reduction in their relative growth rate mean value but no significant reduction in yield (Tables 2 and 3). It indicates different partitioning strategies when water availability reduction takes place. Considering these results, the association between the reduction in leaf area and the stress levels seems not to be the most correct approach to the
conceptual stress phenomena. To identify whether the water deficit is a stress factor, it is necessary to find out if less water availability in the soil determines a corresponding fall in the growth rates and yield.
In general, total dry matter were practically the same for the control and other treatments up to the limit of ∆Tc-3 (Figures 2 and 3). A drastic reduction in total dry matter was observed in the plants under higher canopy temperatures (Figures 2A and 3A). However, the leaf area index showed a tendency of reduction as the plants experienced higher canopy temperatures, indicating that the leaf development is apparently more sensitive to water availability levels in the soil than the total dry matter itself (Figures 2D and 3D).
There was a tendency to increase AGRm and RGRm in the plants irrigated when the canopy temperature was higher than the control up to the limit of ∆Tc-3 treatment, with subsequent fall in these growth indices for the other treatments (Figures 2B, 2C, 3B and 3C, Table 2). The increase in RGRm was due to the higher photosynthetic efficiency of the plants (NAR) as the LAR reduced and as the canopy temperature increased (Figures 2C, 2E, 2F, 3C, 3E and 3F, Table 2). Recent data consider that reduction in leaf area may be compensated by an increase in the stomatal conductance (Menuccini & Comstock, 1999). If this compensation is high enough to keep a balance between the losses of transpired water and liquid phase water conductance, then the same levels of CO2 fixation can be maintained considering all the active plant photosynthetic area. Although Menuccini & Comstock (1999) consider that possibility, in this experiment it was found no compensation, as Tc increased with Rst when water availability was a limit factor, suggesting that a factor other than increased gaseous interchange was maintaining the growth process.
Table 2. Mean values of total dry matter (Wm), absolute growth rate (AGRm), relative growth rate (RGRm), net assimilation rate
(NARm), leaf area ratio (LARm) and leaf area index (LAIm) in Phaseolus vulgaris plants submitted to different irrigation scheduling,
according to the canopy temperature, compared to the control kept in a soil at field capacity(1) .
∆Tc-0 ∆Tc-1 ∆Tc-2 ∆Tc-3 ∆Tc-4 ∆Tc-5
17.75 18.74 20.57 26.77 14.46 7.96
(+5.57) (+15.89) (+50.82) (-18.54) (-55.15)
3.50 3.71 4.63 6.49 3.82 4.51
(+6.0) (+32.3) (+85.4) (+9.1) (+28.8)
0.0108 0.0099 0.0094 0.0093 0.0095 0.0069
(-8.3) (-13.0) (-13.9) (-12.0) (-36.1)
5.07 5.05 4.44 4.12 3.79 1.77
(-0.4) (-12.4) (-18.7) (-25.2) (-65.1) 0.0378
0.0369 0.0436 0.0601 0.0363 0.0313
(-2.4) (+15.3) (+59.0) (-4.0) (-17.2)
Treatment
W
m(g m-2)AGR
m (g m-2 d-1)RGR
m(g g-1 d-1)NAR
m (g m-2 d-1)LAR
m (m2 g-1)LAI
m(m2 m-2)491.89 530.89 501.21 497.93 416.18 262.65
(+7.9) (+1.9) (+1.2) (-15.4) (-46.6)
(1)Treatments ∆Tc-1, ∆Tc-2, ∆Tc-3, ∆Tc-4 and ∆Tc-5 were irrigated when their plant canopy temperature were 1, 2, 3, 4 and 5±0,5ºC, greater than that of the control ∆Tc-0, respectively; yield with the same letter do not differ each other by Tukey at P<0.05.
Table 3. Amount of water applied plus accumulated rainfall and water use efficiency in Phaseolus vulgaris plants submitted to different irrigation scheduling, according to the canopy temperature(1).
Table 3 shows the final mean yield and the irrigation water consumption. Up to the ∆Tc-4 treatment, saving in water use was substantial, although the yield decreased. Another fundamental characteristic is that the total irrigation water consumption was practically the same among the plant populations that experienced the most stressing treatments. However, the differences in yield occurred basically due to the time at which irrigation was applied (Table 3). Total rainfall of 152.3 mm was included in the irrigation water values. Differences were also observed among the treatments in terms of final product quality. Grains of the control plants were variable in maturity and moisture content at harvest, with a consequent reduction of the final product quality. This did not happen in plants under other treatments.
All plant populations, except that of the control treatment, were harvested with adequate grain moisture content. Table 4 shows the number of days relative to harvest anticipation of the treatment plants compared to the control. These values would certainly be greater if the weather conditions had allowed harvest to wait until the control grains had reached the 15.0±1.0% moisture content, the preestablished standard to define harvesting time.
The results obtained in this study point towards the need to refine the technique, as well as new challenges to be solved. It must be remembered that the irrigation time was decided at the beginning of the crop cycle based on the soil water potentials. It was found that, in principle, plants irrigated by the ∆Tc-3 index values had higher
mean growth rates, high yield and water save. Beyond 4±0.5ºC canopy temperature above the control, a drastic fall in growth rates and yield was observed. It would be interesting to find out whether this same tendency con-tinues if the irrigation determined by the proposed index is applied throughout the entire crop life span, for the region of Sete Lagoas, or others with similar climatic characteristics.
The inclusion of different ∆Tc index values for the plant vegetative and reproductive development stages would be equally interesting. It is well known from plant growth studies that higher water stress levels are more tolerated at the vegetative than at the reproductive stage. The decision of when to irrigate needs to be followed by a subsequent decision about how much to irrigate. In this work, for all treatments applied, irrigation was done to raise the soil water content from its actual value to field capacity. Maintaining the soil at field capacity is not the ideal condition, especially when referring to the quality of the final cash product. For this reason, two aspects appear to be fundamental for future research: water replacement in the soil needs to be tested at different moisture content levels and quantity of water to be replaced must be based on the energy balance of the crop, as the ∆Tc index is.
Conclusion
The best moment to irrigate common bean during reproductive growth is when the plant canopy temperature reaches 3ºC to 4±0.5ºC above the well-irrigated control.
∆Tc-0 ∆Tc-1 ∆Tc-2 ∆Tc-3 ∆Tc-4 ∆Tc-5
Treatment Applied water (mm) Yield
(kg ha-1)
Water use efficiency (kg mm-1)
154.0 151.8 151.2 123.8 130.9 98.8
291.5 221.0 94.6 152.5 105.7 136.6
445.5 372.8 245.8 276.3 236.6 235.4
2,151.1a 2,150.4a 2,185.0a 2,260.2a 1,907.6a 1,390.0b
4.8 5.8 8.9 8.2 8.1 5.9 Before
flowering After
flowering Total
7 6 6 6 0
-Table 4. Grain moisture at harvest and number of days of harvest anticipation in Phaseolus vulgaris plants submitted to different irrigation scheduling, according to the canopy temperature(1).
(1)Treatments ∆Tc-1, ∆Tc-2, ∆Tc-3, ∆Tc-4 and ∆Tc-5 were irrigated when their plant canopy temperature were 1, 2, 3, 4 and 5±0,5ºC, greater than that of the control ∆Tc-0, respectively.
Treatment Harvest time Grain moisture
(%) Date Days after
emergence
Number of days previous to control harvest
∆Tc-5
∆Tc-4
∆Tc-3
∆Tc-2
∆Tc-1
∆Tc-0
July 3 July 9 July 9 July 9 July 10 July 10
87 93 93 93 94 94
Acknowledgements
To Conselho Nacional de Desenvolvimento Científi-co e TecnológiCientífi-co (CNPq) and to Coordenação de Aper-feiçoamento de Pessoal de Nível Superior (Capes) for funding the studies; to Embrapa Milho e Sorgo, for logistic support.
References
BATES, L.M.; HALL, A.E. Stomatal closure with soil moisture depletion not associated with changes in bulk water status. Oecologia,v.50, p.62-65, 1981.
BEGG, J.E.; TURNER, N.C. Crop water deficits. Advances in Agronomy, v.28, p.161-207, 1976.
CLAWSON, K.L.; BLAD, B.L. Infrared thermometry for scheduling irrigation of corn. Agronomy Journal, v.74, p.311-316, 1982.
DAVIES, W.J.; ZHANG, J. Root signals and the regulation of growth and development of plants in drying soil. Annual Review of Plant Physiology and Plant Molecular Biology, v.42, p.55-76, 1991.
DE LORENZI, F.; STANGHELLINI, C.; PITACCO, A. Water shortage sensing through infrared canopy temperature: timely detection is imperative. Acta Horticulturae, v.335, p.373-380, 1993.
EHRLER, W.L. Cotton leaf temperatures as related to soil water depletion and meteorological factor. Agronomy Journal, v.58, p.597-601, 1973.
FUCHS, M.; TANNER, C.B. Infrared thermometry of vegetation. Agronomy Journal, v.58, p.597-601, 1966.
GARDNER, B.R.; BLAD, B.L.; WATTS, D.G. Plant and air temperatures in differentially-irrigated corn. Agricultural Meteorology, v.25, p.207-217, 1981.
HUNT, R. Basic growth analysis: plant growth analysis for beginners. London: Unwin Hyman, 1990. 112p.
IDSO, S.B.; JACKSON, R.D.; PINTER JUNIOR, P.J.; REGINATO, R.J.; HATFIELD, J.L. Normalizing the stress-degree-day parameter
for environment variability. Agricultural Meteorology, v.24, p.45-55, 1981.
JACKSON, R.D.; IDSO, S.B.; REGINATO, R.J.; PINTER JUNIOR, P.J. Canopy temperature as a crop water stress indicator. Water Resource Research, v.17, p.1133-1138, 1981.
JACKSON, R.D.; REGINATO, R.J.; IDSO, S.B. Wheat canopy temperature: apractical tool for evaluating water requirements. Water Resource Research, v.13, p.651-656, 1977.
JONES, H.G. Use of infrared thermometry for estimation of stomatal conductance as a possible aid to irrigation scheduling. Agricultural and Forest Meteorology, v.95, p.139-149, 1999.
JORDAN, W.R.; RITCHIE, J.T. Influence of soil water stress on evaporation, root absorption, and internal water status of cotton. Plant Physiology, v.48, p.783-788, 1971.
MENUCCINI, M.; COMSTOCK, J. Variability in hydraulic architecture and gas exchange of common bean (Phaseolus vulgaris) cultivars under well-watered conditions: interactions with leaf size. Australian Journal of Plant Physiology, v.26, p.115-124, 1999. MONTEITH, J.L. Principles of environmental physics. London: E. Arnold, 1973. 241p.
MORAES, J.F.V. Calagem e adubação. In: ZIMMERMAN, M.J. de O.; ROCHA, M.; YAMADA, T. (Ed.). Cultura do feijoeiro. Piracicaba: Associação Brasileira para Pesquisa da Potassa e do Fosfato, 1988. p.261-301.
NOBEL, P.S. Temperature-energy budgets. In: NOBEL, P.S. Physicochemical and environmental plant physiology. San Diego: Academic, 1991. p.345-392.
PAZZETI, G.A.; OLIVA, M.A.; LOPES, N.F. Aplicação da termometria ao infravermelho à irrigação do feijoeiro (Phaseolus vulgaris L.): parâmetros fisiológicos. Revista Brasileira de Fisiologia Vegetal, v.1, p.27-31, 1992.
RUNDEL, P.W.; JARREL, W.M. Water in the environment. In: PEARCY, R.W.; EHLERINGER, J.R.; MOONEY, H.A.; RUNDEL, P.W. (Ed.). Plant physiological ecology. London: Chapman & Hall, 1989. p.29-56.
SAADALLA, M.M.; ALDERFASI, A.A. Infrared-thermal sensing as a screening criterion for drought tolerance in wheat. Annals of Agricultural Science, v.5, p.421-437, 2000.