AMTD
3, 3277–3291, 2010Possible shift of spectral response
function
B. J. Sohn et al.
Title Page
Abstract Introduction
Conclusions References
Tables Figures
◭ ◮
◭ ◮
Back Close
Full Screen / Esc
Printer-friendly Version Interactive Discussion
Discussion
P
a
per
|
Dis
cussion
P
a
per
|
Discussion
P
a
per
|
Discussio
n
P
a
per
|
Atmos. Meas. Tech. Discuss., 3, 3277–3291, 2010 www.atmos-meas-tech-discuss.net/3/3277/2010/ doi:10.5194/amtd-3-3277-2010
© Author(s) 2010. CC Attribution 3.0 License.
Atmospheric Measurement Techniques Discussions
This discussion paper is/has been under review for the journal Atmospheric Measure-ment Techniques (AMT). Please refer to the corresponding final paper in AMT
if available.
Possible shift of spectral response
function of the MODIS 6.8 µm water vapor
channel causing a cold bias up to 3 K
B. J. Sohn, B.-R. Kim, and S.-S. Lee
School of Earth and Environmental Sciences, Seoul National University, Seoul, 151–747, Korea
Received: 23 June 2010 – Accepted: 20 July 2010 – Published: 4 August 2010 Correspondence to: B. J. Sohn ([email protected])
Published by Copernicus Publications on behalf of the European Geosciences Union.
AMTD
3, 3277–3291, 2010Possible shift of spectral response
function
B. J. Sohn et al.
Title Page
Abstract Introduction
Conclusions References
Tables Figures
◭ ◮
◭ ◮
Back Close
Full Screen / Esc
Printer-friendly Version Interactive Discussion
Discussion
P
a
per
|
Dis
cussion
P
a
per
|
Discussion
P
a
per
|
Discussio
n
P
a
per
|
Abstract
The calibration of the Moderate-resolution Imaging Spectroradiometer (MODIS) 6.8 µm water vapor (WV) channel was assessed by comparing Terra/MODIS measurements with the WV channel brightness temperatures equivalent to Infrared Atmospheric Sounding Interferometer (IASI) measurements for June 2007 and December 2007.
5
IASI spectral information was transferred to the Japanese Multifunctional Transport Satellite (MTSAT)-1R WV channel and then to the MODIS WV channel. Results indi-cate that the MODIS WV channel is biased low up to 3 K, likely caused by the shift of the spectral response function by about+11 cm−1. This finding is particularly important
because the bias of−3 K can cause about+30% relative errors in the retrieval of upper
10
tropospheric humidity (UTH). In other words, the current MODIS measurements may
result in higher UTH values, showing relative errors up to+30%.
1 Introduction
Accurate measurements of meteorological/geophysical parameters from satellites rely critically on radiometric calibration of the sensors. In principle, radiometric
character-15
istics determined before launch can be used for calibration during the flight, with the use of an onboard calibration system. However, because of various undetected per-formance anomalies and sensitivity changes of the detector due to aging processes, vicarious calibrations are necessary for both monitoring and absolute calibration pur-poses.
20
With well-calibrated Moderate-resolution Imaging Spectroradiometer (MODIS) mea-surements, there has been great success in utilizing the MODIS products of various geophysical parameters to understand the global climate system. Among 36 MODIS channels, the 6.8 µm water vapor (WV) channel is of particular interest because of its relationship with the upper tropospheric humidity (UTH) (e.g., Soden and Bretherton
25
AMTD
3, 3277–3291, 2010Possible shift of spectral response
function
B. J. Sohn et al.
Title Page
Abstract Introduction
Conclusions References
Tables Figures
◭ ◮
◭ ◮
Back Close
Full Screen / Esc
Printer-friendly Version Interactive Discussion
Discussion
P
a
per
|
Dis
cussion
P
a
per
|
Discussion
P
a
per
|
Discussio
n
P
a
per
|
calibration efforts, it has been reported that onboard calibration provides 6.8 µm WV
channel measurements with the same accuracy as the prelaunch radiometric value of 0.27 K (Xiong and Barnes, 2006). The intercalibration of Terra/MODIS channel mea-surements against contemporaneous meamea-surements made by NASA ER-2 underflights have also indicated that the absolute accuracies of MODIS measurements are not
5
worse than the claimed prelaunch radiometric uncertainty (Moeller et al., 2003). Despite such expected accuracies from the presumably well-calibrated MODIS sen-sor, recent studies on comparing WV channel brightness temperatures reveal an incon-sistency in the results. Sohn et al. (2008) evaluated measurements of the Japanese Multi-functional Transport Satellite-1R (MTSAT-1R) 6.8 µm WV channel by collocating
10
with the Terra/MODIS and transforming the brightness temperature (TB) of the MODIS 6.8 µm WV channel into the MODIS-equivalent MTSAT-1R TB. Their results suggested that the MTSAT-1R WV channel has a warm bias up to 2 K.
In contrast, it has been reported that the MTSAT-1R WV channel has a few tenths of a degree of bias when compared to the equivalent channel TB from the Infrared
Atmo-15
spheric Sounding Interferometer (IASI) hyperspectral images (http://mscweb.kishou. go.jp/monitoring/gsics/ir/gsir mt1r.htm). Considering that the IASI sensor is well cali-brated to an uncertainty level below 0.2 K (Blumstein et al., 2007; Larar et al., 2010), one possible explanation of the discrepancy is that the MODIS WV channel may be bi-ased cold. Such cold bias of Aqua/MODIS WV channel has been reported by Tobin et
20
al. (2006) from the comparison with AIRS-driven MODIS-equivalent temperatures. Al-though a direct comparison between IASI and MODIS is desirable, it may be available only over the polar regions, based on the so-called Simultaneous Nadir Overpasses (SNO) method (Cao et al., 2005). The equatorial crossing time of the IASI is 09:30, whereas it is 10:30 for Terra/MODIS and 13:30 for Aqua/MODIS. However, it is thought
25
be difficult to apply the SNO technique for the water vapor channel under extremely
dry conditions such as in polar regions, because the WV channel is mostly affected
by surface signals, similar to window channels. In other words, it may be difficult to
diagnose the effect caused by any shift of the WV spectral response function using the
AMTD
3, 3277–3291, 2010Possible shift of spectral response
function
B. J. Sohn et al.
Title Page
Abstract Introduction
Conclusions References
Tables Figures
◭ ◮
◭ ◮
Back Close
Full Screen / Esc
Printer-friendly Version Interactive Discussion
Discussion
P
a
per
|
Dis
cussion
P
a
per
|
Discussion
P
a
per
|
Discussio
n
P
a
per
|
SNO technique.
In this paper, by taking the IASI observations as a reference, we have investigated the calibration status of the MODIS 6.8 µm WV channel. Because direct comparison
between IASI and MODIS is difficult, we used the MTSAT-1R WV channel as a
surro-gate IASI to intercalibrate the MODIS WV channel; that is, accurate spectral
informa-5
tion from IASI is transferred to the MODIS water vapor channel through the MTSAT-1R. Here we provide strong evidence that the Terra/MODIS 6.8 µm WV channel is biased cold up to 3 K.
2 Data used
In this investigation, WV channel images from the MTSAT-1R and Terra/MODIS and
10
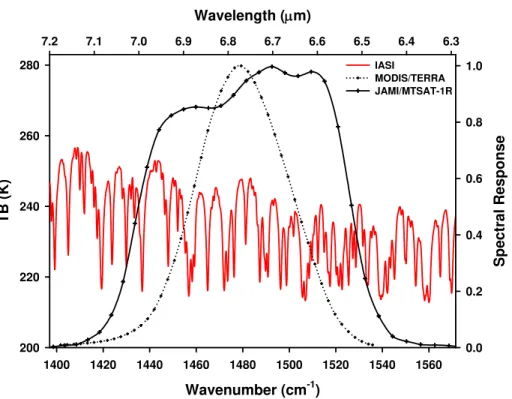
hyperspectral images from IASI over the 6.8 µm water vapor absorption band for June and December 2007 (a total of two months) are taken over the MTSAT-1R observation
area of 30◦N–30◦S and 110◦E–180◦E. Their respective spectral response functions
for the 6.8 µm strong water vapor absorption band are given in Fig. 1. Hereafter, the 6.8 µm absorption band is referred to as the WV channel.
15
IASI is a passive infrared sensing instrument based on the Michelson Interferometer onboard the Meteorological Operational Satellite/EUMETSAT (MetOp/EUMETSAT). Its
spectral coverage is from 3.63 to 15.5 µm (or 645 to 2760 cm−1) with 8461 spectral
samples at a 0.5 cm−1spectral resolution (EUMETSAT). The IASI Level 1C (IASI L1C)
data with a 12-km spatial resolution at the sub-satellite point were downloaded from the
20
NOAA/CLASS Website (http://www.nsof.class.noaa.gov/saa/products/welcome). After the launch in October 2006, IASI has shown good in-flight performance, especially regarding its radiometric and spectral accuracy, for which the calibration accuracy is claimed to be well below 0.15 K (Blumstein et al., 2007) and within about 0.1 K (Larar et al., 2010).
25
The geostationary MTSAT-1R satellite located at 140◦E carries an IR imager to
AMTD
3, 3277–3291, 2010Possible shift of spectral response
function
B. J. Sohn et al.
Title Page
Abstract Introduction
Conclusions References
Tables Figures
◭ ◮
◭ ◮
Back Close
Full Screen / Esc
Printer-friendly Version Interactive Discussion
Discussion
P
a
per
|
Dis
cussion
P
a
per
|
Discussion
P
a
per
|
Discussio
n
P
a
per
|
with a 4.0 km pixel resolution at the sub-satellite point. In this study, we used MT-SAT/High Rate Information Transmission (MTSAT/HRIT) data from the Japan Meteoro-logical Agency (JMA). The HRIT count values for the WV channel were converted into TB using the calibration table provided by the JMA Web site (http://mscweb.kishou.go. jp/operation/calibration/mt1r/HRIT/mt1r hrit.htm).
5
The MODIS sensors onboard both the Terra and Aqua platforms each have 36 chan-nels. The Terra/MODIS data set used in this study consists of channel radiances (MOD021KM), geolocation (MOD03: latitude, longitude, and satellite zenith angle), and cloud mask (MOD35 L2). The nominal spatial resolution of the MODIS data used is 1 km at the nadir.
10
3 Methodology
This examination includes the following steps: (1) development of a theoretical relation-ship of TB between the MODIS and MTSAT-1R WV channels, (2) bias correction of the MTSAT-1R WV channel TB, (3) estimation of IASI-equivalent MODIS WV channel TB from the collocated MTSAT-1R WV channel TB, and (4) comparison of IASI-equivalent
15
MODIS TBs with measured TBs. A detailed description of the method is as follows.
Because the IASI provides spectral signatures with a 0.5 cm−1 resolution, the
ex-pected relationship of TB between MTSAT-1R and MODIS can be theoretically cal-culated by applying their respective spectral response functions (SRFs). Once an IASI-based pseudo-channel corresponding to any target channel is selected (here, the
20
WV channel of the MTSAT-1R or the MODIS), the radiance measured by the pseudo-channel (NWV) can be inferred as follows:
NWV≡
ν2
Z
ν1
Φ(ν)Nνd ν.
ν2
Z
ν1
Φ(ν)d ν (1)
where Φ(ν) is the SRF of the target channel at the wave number ν, and Nν is the
AMTD
3, 3277–3291, 2010Possible shift of spectral response
function
B. J. Sohn et al.
Title Page
Abstract Introduction
Conclusions References
Tables Figures
◭ ◮
◭ ◮
Back Close
Full Screen / Esc
Printer-friendly Version Interactive Discussion
Discussion
P
a
per
|
Dis
cussion
P
a
per
|
Discussion
P
a
per
|
Discussio
n
P
a
per
|
IASI-measured radiance at the wave numberν. The calculated synthetic radiance is
then converted into TB for the WV channels of MTSAT-1R and MODIS to obtain the TB relationship between the two WV channels. The regression equation may be expressed as:
TBMODIS=a+bTBMTSAT (2)
5
In Eq. (2), TBMODIS and TBMTSAT are brightness temperatures of the MODIS and
MTSAT-1R WV channels inferred from IASI spectral measurements, referred to as
“IASI-equivalent” MODIS and MTSAT-1R WV channel TBs, respectively. The coeffi
-cients of Eq. (2) are obtained by regressing two sets of TBs only from clear-sky scenes.
Because TBMTSAT in Eq. (2) is theoretically calculated with IASI spectral signatures,
10
bias correction should be made before applying Eq. (2) to infer TBMODISfrom measured
MTSAT-1R WV TB. The bias is determined by comparing measured MTSAT-1R TB with
TBMTSAT from collocated IASI pixels. Finally, the bias-corrected MTSAT-1R WV TB is
inserted into Eq. (2) to infer “IASI-equivalent” MODIS WV channel TB (i.e., TBMODIS),
which is then compared with collocated and measured MODIS WV channel TBs.
15
Collocated match-up data are constructed using MTSAT-1R vs. IASI images as well as MTSAT-1R vs. MODIS images. Since the instruments being considered are onboard
different satellite platforms, their time–space resolutions and viewing geometries are
quite different. For example, the spatial resolution at nadir is 12 km for IASI and 4 km for
MTSAT-1R. In order to remove the effects of different spatial and temporal resolutions
20
and viewing geometry differences, we projected measurements from different sensors
onto a common reference. Images were selected when observation time differences
were within±5min. Data were further processed for the construction of match-up data
when an absolute difference in viewing angle between two observations was less than
5◦. Then, brightness temperatures from each satellite were averaged and reformatted
25
into a 0.2◦×0.2◦grid to mitigate the effects of different spatial resolutions.
Brightness temperatures were averaged only when the 0.2◦ grid was entirely filled
AMTD
3, 3277–3291, 2010Possible shift of spectral response
function
B. J. Sohn et al.
Title Page
Abstract Introduction
Conclusions References
Tables Figures
◭ ◮
◭ ◮
Back Close
Full Screen / Esc
Printer-friendly Version Interactive Discussion
Discussion
P
a
per
|
Dis
cussion
P
a
per
|
Discussion
P
a
per
|
Discussio
n
P
a
per
|
of cloud contamination in the 6.8 µm channel TB, whose weighting function is generally located in the upper troposphere. For the IASI and MTSAT-1R collocation, the pixel was considered to be cloud-free for the water vapor channel if the MTSAT-1R window channel TB (around the 11 µm band) is larger than 275 K (Sohn and Schmetz, 2004)
and the TB difference between the window and water vapor channels is larger than
5
25 K (Soden, 1998). These thresholds eliminate pixels contaminated by high or middle clouds. The grid remains if the standard deviation of TB11 within the grid is less than 0.8 K for the spatial homogeneity check.
For the MODIS and MTSAT-1R pair, the MODIS level 2 cloud mask products (MOD35 L2) were used to ensure the removal of cloud-contaminated scenes. The
10
homogeneity criterion was also applied to remove targets contaminated by clouds or coastal lines. The 0.8 K standard deviation of TB11 within a grid was also used as a criterion for the spatial homogeneity check.
4 Results
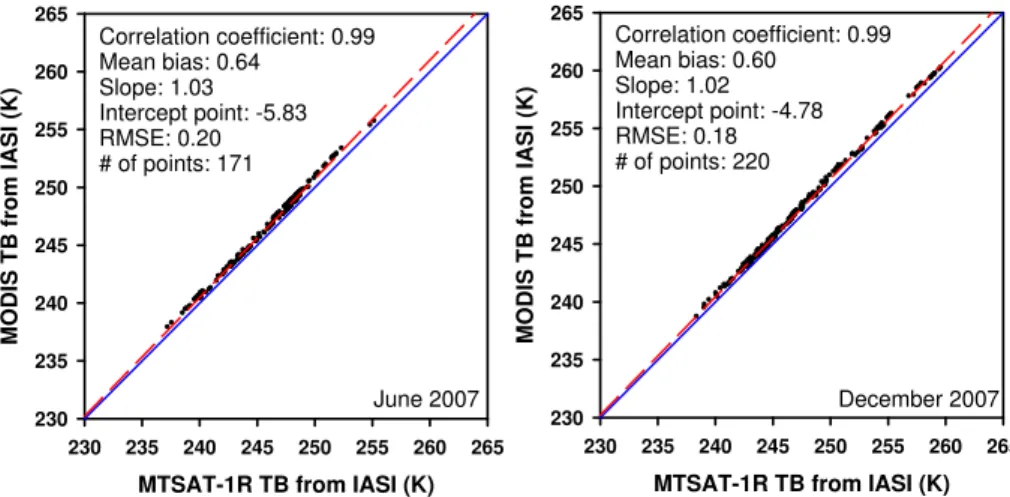
For the given IASI spectrum, the MODIS and MTSAT-1R WV TB were estimated for
15
June and December, 2007, by applying their respective SRFs. Figure 2 shows scatter plots of MTSAT-1R and MODIS WV channel TBs inferred from IASI measurements. Regression lines are represented by dashed lines, and solid diagonal lines represent one-to-one matches. These show the MODIS and MTSAT-1R WV channel
measure-ments to be well behaved, with a correlation coefficient of 0.99 for both the summer
20
month and the winter month, indicating that MODIS TB can be predicted by MTSAT-1R measurement or vice-versa, if calibrations are accurate. The regression equations obtained for June and December, 2007 were as follows:
For June 2007: TBMODIS=−5.83+1.03TBMTSAT (3)
For December 2007: TBMODIS=−4.78+1.02TBMTSAT (4)
25
AMTD
3, 3277–3291, 2010Possible shift of spectral response
function
B. J. Sohn et al.
Title Page
Abstract Introduction
Conclusions References
Tables Figures
◭ ◮
◭ ◮
Back Close
Full Screen / Esc
Printer-friendly Version Interactive Discussion
Discussion
P
a
per
|
Dis
cussion
P
a
per
|
Discussion
P
a
per
|
Discussio
n
P
a
per
|
In Eqs. (3) and (4), the IASI-equivalent MTSAT-1R TB (i.e., TBMTSAT) is used as a
pre-dictor to estimate the IASI-equivalent MODIS TB (i.e., TBMODIS). However, the
mea-sured MODIS TB is compared with the IASI-equivalent MODIS TB estimated from the
collocated MTSAT-1R TB; thus the bias between TBMTSAT and the measured
MTSAT-1R TB should be evaluated and taken into account before predicting TBMODIS.
5
In order to assess the bias, measured MTSAT-1R TBs were compared with IASI-equivalent MTSAT-1R TBs using the collocated IASI-MTSAT data – Fig. 3a,b. The scatter plots indicate an almost one-to-one correspondence between the two sets of TB data for both the winter month and the summer month. The mean biases of 0.12 K and 0.09 K appear insignificant; nevertheless, those values were taken into account for
10
correcting the bias of the measured MTSAT-1R TBs.
At the same time, the IASI-based relationship between TBMODIS and TBMTSAT
ex-pressed in Eqs. (3) and (4) can be applied to predict MTSAT-1R TBs from MODIS TB measurements. The predicted MTSAT-1R TBs (or MODIS-equivalent MTSAT-1R TBs) can be compared with collocated measured MTSAT-1R TBs, which can be used as
15
a way to assess the calibration status of MTSAT-1R WV channel measurements based on the MODIS measurements as a reference. It is similar to the approach used by Sohn et al. (2008). Comparison results given in Fig. 3c,d suggest that MTSAT-1R WV channel overestimates TBs by 2.2 to 2.5 K when MODIS measurements are used as
a reference. This overestimate is significantly different from the near agreement shown
20
between IASI-equivalent TBs and measured TBs in Fig. 3a,b, leading to a conjecture that MODIS WV channel calibration may be problematic if IASI measurements are as-sumed to be true. Taking results shown in Fig. 3 as a working hypothesis, we further proceed to assess the calibration status of MODIS WV measurements and examine possible causes of the calibration bias if any.
25
per-AMTD
3, 3277–3291, 2010Possible shift of spectral response
function
B. J. Sohn et al.
Title Page
Abstract Introduction
Conclusions References
Tables Figures
◭ ◮
◭ ◮
Back Close
Full Screen / Esc
Printer-friendly Version Interactive Discussion
Discussion
P
a
per
|
Dis
cussion
P
a
per
|
Discussion
P
a
per
|
Discussio
n
P
a
per
|
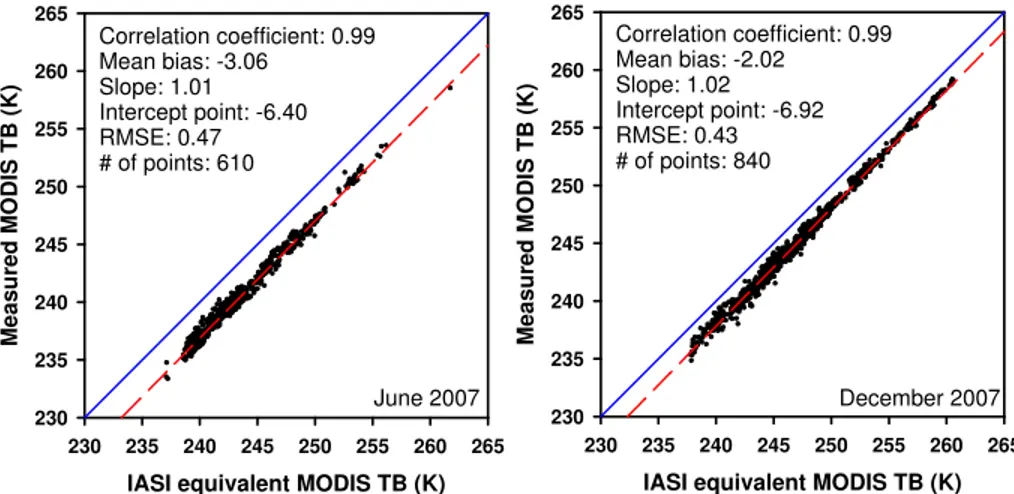
fect matches. In Fig. 4, it can be seen that the measured MODIS WV channel TBs are strongly correlated with IASI-equivalent TBs (correlation coefficient 0.99); however,
biases of−3.06 K for June 2007, and−2.02 K for December 2007, suggest that MODIS
water vapor TBs are biased low, up to about 2–3 K. The seasonal dependence of the bias appears to be related to the degree of wetness of the upper troposphere.
Con-5
sidering that the water vapor absorption signal is stronger (weaker) for moister (drier) condition, we may expect a smaller difference in TB for the drier atmosphere if all other
calibration factors remain unchanged, as also expressed in Eqs. (3) and (4). It is also of interest to note that the bias seems to be larger for the colder scenes. Again, con-sidering that higher UTH is often depicted by a colder WV channel TB, the temperature
10
dependence of bias is consistent with the seasonal dependence.
We assume that the discrepancies between measured and inferred MODIS WV channel TBs are due to the error in the MODIS SRF position. The cold bias of TB and its dependence on season and scene temperature were found to be almost cancelled by introducing a spectral shift for the MODIS 6.8 µm WV channel (not shown). The
15
analysis was repeated with convolutions of IASI spectra with an SRF of the MODIS
WV channel shifted by +11 cm−1
. This result is consistent with the suggested cold bias around 1 K in the MODIS water vapor channel, based on comparison with the brightness temperature inferred from Atmospheric Infrared Sounder (AIRS), which has previously been attributed to an SRF shift of+5.0 cm−1(Tobin et al., 2006).
Consider-20
ing that the AIRS has gaps over the 6.8 µm WV absorption band, the Tobin et al. (2006)
WV channel results should not be definite, our result of an+11 cm−1SRF shift causing
a cold bias up to 3 K should be counted as significant for MODIS data processing.
5 Conclusions
We assessed the calibration performance of the Terra/MODIS 6.8 µm WV absorption
25
channel by using collocated MTSAT-1R as a surrogate of IASI. In so doing, IASI spec-tral measurements were convolved into the brightness temperatures of 6.8 µm WV
AMTD
3, 3277–3291, 2010Possible shift of spectral response
function
B. J. Sohn et al.
Title Page
Abstract Introduction
Conclusions References
Tables Figures
◭ ◮
◭ ◮
Back Close
Full Screen / Esc
Printer-friendly Version Interactive Discussion
Discussion
P
a
per
|
Dis
cussion
P
a
per
|
Discussion
P
a
per
|
Discussio
n
P
a
per
|
sorption channels of MODIS and MTSAT-1R, and then a theoretical relationship be-tween two channels was deduced. After adjusting the mean bias bebe-tween the IASI-equivalent MTSAT-1R TBs and observed values, the IASI-IASI-equivalent MODIS WV chan-nel TB was calculated from the measured MTSAT-1R TB by applying the obtained TB relationship. For this intercomparison, spatially uniform and cloud-free IASI, MODIS
5
and MTSAT-1R WV channel data were collected for June and December 2007, over the 30◦N–30◦S, 110◦E–180◦E analysis domain.
Comparison of measured MODIS WV channel TBs with IASI-equivalent TBs strongly
indicates that MODIS WV channel TBs are biased low: −3.06 K for June 2007 and
−2.02 K for December 2007. While the causes of these differences are not conclusive,
10
the fact that the SRF spectral shift of +11 cm−1
almost cancels both the seasonally dependent and scene temperature-dependent biases strongly indicates that the shift
of SRF of the MODIS WV channel by+11 cm−1could be a major reason for the 2–3 K
low bias of TB. This bias is significant for the reason that the 3 K bias in TB can lead to relative errors of up to 30% in the retrieved UTH values (Sohn et al., 2000). The
15
MODIS water vapor channel should be recalibrated when the channel measurements are used for UTH-related studies.
Acknowledgement. This work was supported by the NSL (National Space Lab) program through the Korea Science and Engineering Foundation funded by the Ministry of Education, Science and Technology (S10801000184-08A0100-18410) and by the BK21 Project of the Ko-20
rean Government.
References
Blumstein, D., Tournier, B., Cayla, F. R., Phulpin, T., Fjortoft, R., Buil, C., and Ponce, G.: In-flight performance of the Infrared Atmospheric Sounding Interferometer (IASI) on METOP-A, Proc. SPIE, 66840H, 1–12, 2007.
25
AMTD
3, 3277–3291, 2010Possible shift of spectral response
function
B. J. Sohn et al.
Title Page
Abstract Introduction
Conclusions References
Tables Figures
◭ ◮
◭ ◮
Back Close
Full Screen / Esc
Printer-friendly Version Interactive Discussion
Discussion
P
a
per
|
Dis
cussion
P
a
per
|
Discussion
P
a
per
|
Discussio
n
P
a
per
|
EUMETSAT: IASI Level 1 product guide, EUM/OPS-EPS/MAN/04/0032, V2E. EU-METSAT, Darmstadt, Germany, (http://oiswww.eumetsat.org/WEBOPS/eps-pg/IASI-L1/ IASIL1-PG-0TOC.htm), 2008.
Larar, A. M., Smith, W. L., Zhou, D. K., Liu, X., Revercomb, H., Taylor, J. P., Newman, S. M., and Schl ¨ussel, P.: IASI spectral radiance validation inter-comparisons: case study assessment 5
from the JAIVEx field campaign, Atmos. Chem. Phys., 10, 411–430, doi:10.5194/acp-10-411-2010, 2010.
Moeller, C. C., Revercomb, H. E., Ackerman, S. A., Menzel, W. P., and Knuteson, R. O.: Eval-uation of MODIS thermal IR band L1B radiances during SAFARI 2000, J. Geophys. Res., 108(D13), 8494, doi:10.1029/2002JD002323, 2003.
10
Soden, B. J. and Bretherton, F. P.: Upper-tropospheric relative humidity from the GOES 6.7 µm channel: Method and climatology for July 1987, J. Geophys. Res., 98, 16669–16688, 1993. Soden, B. J.: Tracking upper tropospheric water vapor radiances: A satellite perspective, J.
Geophys. Res., 103, 17069–17081, 1998.
Sohn, B. J., Schmetz, J., Tjemkes, S., Koenig, M., Lutz, H., Arriage, A., and Chung, E. S.: 15
Intercalibration of the Meteosat 7 water vapor channel with SSM/T-2, J. Geophys. Res., 105, 16673–16680, 2000.
Sohn, B. J. and Schmetz, J.: Water vapor-induced OLR variations associated with high cloud changes over the tropics: A study from Meteosat-5 observations, J. Climate, 17, 1987–1996, 2004.
20
Sohn, B. J., Park, H. S., Han, H. J., and Ahn, M. H.: Evaluating the calibration of MTSAT-1R infrared channels using collocated Terra MODIS measurements, Int. J. Remote Sens., 29, 3033–3042, 2008.
Tobin, D. C., Revercomb, H. E., Moeller, C. C., and Pagano, T. S.: Use of atmospheric infrared sounder high-spectral resolution spectra to assess the calibration of moderate 25
resolution imaging spectroradiometer on EOS aqua, J. Geophys. Res., 111, D09S05, doi:10.1029/2005JD006095, 2006.
Xiong, X. and Barnes, W.: An overview of MODIS radiometric calibration and characterization, Adv. Atmos. Sci., 23, 69–79, 2006.
AMTD
3, 3277–3291, 2010Possible shift of spectral response
function
B. J. Sohn et al.
Title Page
Abstract Introduction
Conclusions References
Tables Figures
◭ ◮
◭ ◮
Back Close
Full Screen / Esc
Printer-friendly Version Interactive Discussion
Discussion
P
a
per
|
Dis
cussion
P
a
per
|
Discussion
P
a
per
|
Discussio
n
P
a
per
|
Wavenumber (cm-1)
1400 1420 1440 1460 1480 1500 1520 1540 1560
TB (K)
200 220 240 260 280
Wavelength (μm)
6.3 6.4 6.5 6.6 6.7 6.8 6.9 7.0 7.1 7.2
Spe
c
tral Response
0.0 0.2 0.4 0.6 0.8 1.0 IASI
MODIS/TERRA JAMI/MTSAT-1R
μ
°
°
AMTD
3, 3277–3291, 2010Possible shift of spectral response
function
B. J. Sohn et al.
Title Page
Abstract Introduction
Conclusions References
Tables Figures
◭ ◮
◭ ◮
Back Close
Full Screen / Esc
Printer-friendly Version Interactive Discussion
Discussion
P
a
per
|
Dis
cussion
P
a
per
|
Discussion
P
a
per
|
Discussio
n
P
a
per
|
MTSAT-1R TB from IASI (K)
230 235 240 245 250 255 260 265
M
O
DI
S
TB from IASI
(K)
230 235 240 245 250 255 260 265
Correlation coefficient: 0.99 Mean bias: 0.64
Slope: 1.03 Intercept point: -5.83 RMSE: 0.20 # of points: 171
June 2007
MTSAT-1R TB from IASI (K)
230 235 240 245 250 255 260 265
MODIS T
B
f
ro
m
IASI (K)
230 235 240 245 250 255 260 265
Correlation coefficient: 0.99 Mean bias: 0.60
Slope: 1.02 Intercept point: -4.78 RMSE: 0.18 # of points: 220
December 2007
μ
Fig. 2.Brightness temperatures inferred from IASI measurements for the MODIS and MTSAT-1R 6.8 µm water vapor channels in June 2007 (left) and December 2007 (right).
AMTD
3, 3277–3291, 2010Possible shift of spectral response
function
B. J. Sohn et al.
Title Page Abstract Introduction Conclusions References Tables Figures ◭ ◮ ◭ ◮ Back Close
Full Screen / Esc
Printer-friendly Version Interactive Discussion Discussion P a per | Dis cussion P a per | Discussion P a per | Discussio n P a per |
MTSAT-1R TB from IASI (K) 230 235 240 245 250 255 260 265
M e asu red MT SAT -1R TB (K) 230 235 240 245 250 255 260 265
Correlation coefficient: 0.98 Mean bias: 0.12 Slope: 0.99 Intercept point: 3.66 RMSE: 0.43 # of points: 171
June 2007
MTSAT-1R TB from IASI (K) 230 235 240 245 250 255 260 265
Measured MT SAT -1R TB ( K ) 230 235 240 245 250 255 260 265
Correlation coefficient: 0.99 Mean bias: 0.09 Slope: 0.99 Intercept point: 3.58 RMSE: 0.47 # of points: 220
December 2007
(a) (b)
MTSAT-1R TB from MODIS (K) 230 235 240 245 250 255 260 265
M e as u red M T S A T -1R T B ( K ) 230 235 240 245 250 255 260 265
Correlation coefficient: 0.99 Mean bias: 2.22 Slope: 0.97 Intercept point: 8.90 RMSE: 0.47 # of points: 610
June 2007
MTSAT-1R TB from MODIS (K) 230 235 240 245 250 255 260 265
Meas u red MTSAT -1 R TB (K) 230 235 240 245 250 255 260 265
Correlation coefficient: 0.99 Mean bias: 2.48 Slope: 0.98 Intercept point: 8.16 RMSE: 0.43 # of points: 840
December 2007
(c) (d)
AMTD
3, 3277–3291, 2010Possible shift of spectral response
function
B. J. Sohn et al.
Title Page
Abstract Introduction
Conclusions References
Tables Figures
◭ ◮
◭ ◮
Back Close
Full Screen / Esc
Printer-friendly Version Interactive Discussion
Discussion
P
a
per
|
Dis
cussion
P
a
per
|
Discussion
P
a
per
|
Discussio
n
P
a
per
|
IASI equivalent MODIS TB (K)
230 235 240 245 250 255 260 265
Meas
u
red
MO
DIS T
B
(K)
230 235 240 245 250 255 260 265
Correlation coefficient: 0.99 Mean bias: -3.06
Slope: 1.01 Intercept point: -6.40 RMSE: 0.47 # of points: 610
June 2007
IASI equivalent MODIS TB (K)
230 235 240 245 250 255 260 265
Measure
d
M
O
DI
S
TB (K)
230 235 240 245 250 255 260 265
Correlation coefficient: 0.99 Mean bias: -2.02
Slope: 1.02 Intercept point: -6.92 RMSE: 0.43 # of points: 840
December 2007
Fig. 4.Scatter plots of measured MODIS and IASI equivalent MODIS brightness temperatures for June 2007 (left) and December 2007 (right).