Use of mul -criteria decision analysis to classify and
regulate interstate bus services in Brazil
Hugo Alves Silva Ribeiro1, José Expedito Brandão Filho2, Paulo Henrique da Silva Costa3, Marcelo Grangeiro Quirino4
1Na onal Land Transport Agency (ANTT), Brazil, [email protected] 2Na onal Land Transport Agency (ANTT), Brazil, jose.brandao.fi[email protected] 3Na onal Land Transport Agency (ANTT), Brazil, [email protected] 4University of Brasília (UnB), Brazil, [email protected]
Recebido:
7 de junho de 2018
Aceito para publicação:
10 de junho de 2019
Publicado:
31 de dezembro de 2019
Editor de área:
Helena Beatriz Cybis
ABSTRACT
Interstate bus services in Brazil can occur between nearby or distant municipali es. In the former situa on the bus service should be classified as ‘semi-urban’; it is delegated by Federal concession that requires a bidding process and must be provided by urban buses. In the la0er situa on the bus service should be classified as ‘road’; it is directly authorized by the public authority and must be provided by coaches. Brazilian law
dis-nguishes between ‘nearby’ and ‘distant’ ci es when the service occurs with ‘urban’ or ‘regional’ characteris cs, but does not specify parameters for that dis nc on. This paper presents a mul -criteria method used to be0er classify and regulate those bus transport services. The method was applied to categorize 11 interstate markets of which 4 were considered to be ‘semi-urban’. In conclusion, the study served as a basis to support a government decision.
RESUMO
Os serviços de ônibus interestaduais no Brasil podem ocorrer entre municípios próximos ou distantes. Na primeira situação, o serviço deve ser classificado como ‘semiurbano’, delegado por permissão pelo Poder Público Federal, exigindo processo licitatório e ope-rado com ônibus urbanos. Na outra situação, o serviço deve ser classificado como ‘ro-doviário’, o qual é diretamente autorizado pela autoridade pública e deve ser operado por ônibus rodoviários. A lei brasileira diferencia cidades ‘próximas’ ou ‘distantes’ quando o serviço ocorre com caracterís cas ‘urbanas’ ou ‘regionais’, mas não especifica parâmetros para essa dis nção. Este ar go apresenta um método mul critério u lizado para melhor classificar e regular os serviços de transporte interestadual de passageiros. Como resultado, a técnica foi aplicada em 11 mercados interestaduais, dos quais 4 foram considerados ‘semiurbanos’. Em conclusão, o estudo foi u lizado para apoiar a decisão do governo.
Keywords:
Mul -criteria decision support, Transport regula on,
Bus service classifica on.
Palavras-chaves:
Análise mul critério de apoio à decisão,
Regulamentação de transporte, Classificação de serviço de ônibus. DOI:10.14295/transportes.v27i4.1724
1. INTRODUCTION
In Brazil, road passenger transport services can occur within the same Brazilian state or between different states. In the irst case, the services are under state/Federal District responsibility and, in the second, they are under Federal responsibility (Nunes, 2010). There are two types of interstate passenger transport services: ‘semi-urban’ and ‘road’. Although both of them are interregional transport services under Federal responsibility, they have several operational and regulatory differences.
The interstate ‘semi-urban’ bus service is the one which, while maintaining urban characteristics, traverses the limits of Brazilian states (in Brazil, the Federal District is treated as a state). For that, according to national regulations, it is necessary to use city buses with
controlled bus fares. The ‘semi-urban’ regulatory model is based on exclusive concessions and requires a bidding process to select a company to perform the operation (Nunes, 2010; Schiller, 2018). In such cases, the fares are usually cheaper and the frequency of buses is usually higher, both in comparison to a ‘road’ service (Brandão Filho et al., 2016).
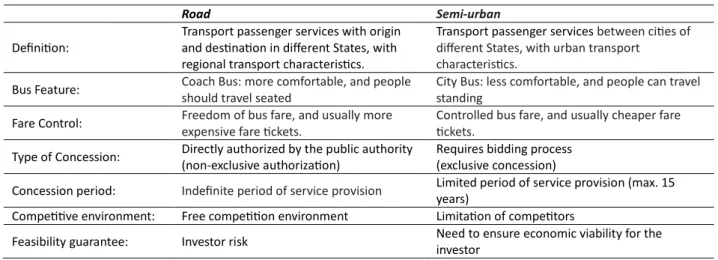
On the other hand, any company that meets certain prerequisites can operate the ‘road’ interstate bus service (Schiller, 2018). This service should be offered on interstate routes with regional transport characteristics, using coaches and charging non-regulated fares (Brazil, 2001; Schiller, 2018). The fares are usually more expensive and the frequency of buses is usually lower than ‘semi-urban’ services (Nunes, 2010). Also known as ‘long distance coach services’, the ‘road’ bus service has been delegated by a nonexclusive authorization model (free competition environment) since 2015, due to the deregulation process (Brazil, 2001; Schiller, 2018). Table 1 displays the differences between ‘road’ and ‘semi-urban’ interstate bus service.
Table 1 – Differences between ‘road’ and ‘semi-urban’ interstate bus services
Road Semi-urban
Defini on:
Transport passenger services with origin and des na on in different States, with regional transport characteris cs.
Transport passenger services between ci es of different States, with urban transport characteris cs.
Bus Feature: Coach Bus: more comfortable, and people
should travel seated
City Bus: less comfortable, and people can travel standing
Fare Control: Freedom of bus fare, and usually more
expensive fare ckets.
Controlled bus fare, and usually cheaper fare ckets.
Type of Concession: Directly authorized by the public authority (non-exclusive authoriza on)
Requires bidding process (exclusive concession)
Concession period: Indefinite period of service provision Limited period of service provision (max. 15
years)
Compe ve environment: Free compe on environment Limita on of compe tors
Feasibility guarantee: Investor risk Need to ensure economic viability for the investor
Source: Brazil (2001)
Minas Gerais State
São Paulo State Divinolândia
Poços de Caldas Goiás State Federal District Luziânia Brasília N 200 km
Figure 1. Interstate bus service between Poços de Caldas and Divinolândia (40 km apart) with coaches and between Brasília and Luziânia (60 km apart) with city buses
Before 2013, the bus services were classi ied as ‘road’ whenever the extension of the line exceeded 75 km (Brandão Filho et al., 2016). However, that distance should not be the unique criterion to determine whether the service is ‘semi-urban’ and it is also not a good parameter
for measuring the ‘urban characteristics’ (Ojima, 2007). For instance, between Poços de Caldas city (in Minas Gerais State) and Divinolândia city (in São Paulo State) there are 40 km without urban transport characteristics. Consequently the operation is currently conducted using coaches. On the other hand there is the example of the bus services between Brası́lia (in the Federal District) and Luziânia (in Goiás State), cities 60 km apart, that are served by urban buses (Figure 1).
Because of inadequate use of distance as the unique criteria, many transport services have been wrongly classi ied. As a result, some markets operated by road services have been requesting to switch to semi-urban services, and vice versa. That required studies to develop a new classi ication method that could support the decisions of the public authority. According to Brazilian Law 010.233/2001 (Brazil, 2001), the National Land Transport Agency (ANTT) is responsible for determining whether a bus service should be classi ied as ‘semi-urban’ or ‘road’.
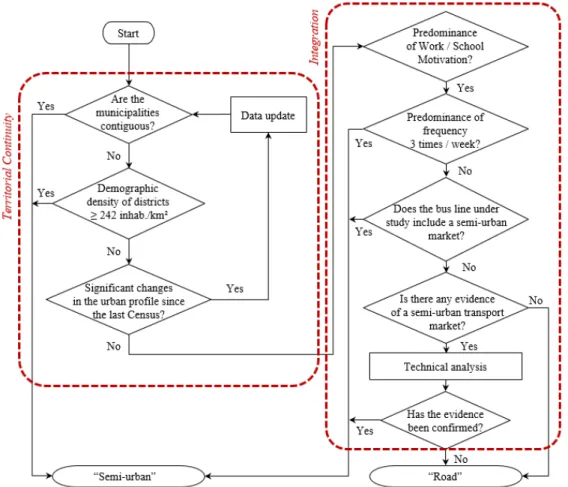
To try to solve the problem, a preliminary method was proposed by Brandão Filho et al. (2016), which considers territorial continuity and the integration of municipalities (Figure ). However, this method requires a ‘technical analysis’ that has not yet been presented. A methodological complement is needed to guide any such technical analysis.
Figure 2. Preliminary flowchart for classifying interstate passenger transportation services. Source: Brandão Filho et al. (2016)
To complement the paper presented by Brandão Filho et al. (2016), the main objective of this study is to develop a method to measure the degree of ‘urban characteristics’ in order to classify the interstate bus transport services and assist the sector regulation (Brazil, 2001). In the case of a bad classi ication, there could be serious operational and regulatory problems, such as ex-pensive bus fares or insuf icient bus frequencies (Nunes, 2010).
2. LITERATURE REVIEW
2.1. Mul>-Criteria Decision Analysis
Classic Operational Research (OR) has developed some positive paradigms in the search for good solutions to certain problems (Bortoluzzi et al., 2017). With one such paradigm, depend-ing on the complexity of the decision to be made, decision-makers can propose different values and preferences in an attempt to solve those problems (Marttunen et al., 2017). For that reason, the Multi-Criteria Decision Analysis (MCDA) approach appears as the methodological alterna-tive to be used (Marttunen et al., 2017).
In essence, the MCDA consists of a systematic evaluation of alternatives in terms of multiple and often con licting objectives (Marttunen et al., 2017). In some cases, it is necessary for deci-sion-makers to increase their degree of understanding of the decision to be made, especially when presenting their different points of view (PV), in order to ind the best solution in a ‘con-tructivist’ way. When that occurs, the technique is known as Multi-Criteria Decision Analysis – Constructivist (MCDA-C) (Costa et al., 2017).
The MCDA-C is originally constructed in four stages: (i) Decisional Context Identi ication; (ii) Problem Structuring; (iii) Multicriteria Model Structuring; and, (iv) Evaluation of Potential Ac-tions (Costa et al., 2017; Ensslin et al., 2001).
The irst stage begins the identi ication of aspects of the object to be studied. The problem structuring (second stage) seeks to de ine the title of the problem and to determine the family of Fundamental Points of View (FPV). In this paper, in order to de ine the FPV criteria it is nec-essary to search for speci ic literature on urban mobility, land-use, and spatial con iguration (Adelt et al., 2018; Banister, 2008; Da Silva et al., 2008; Davidson et al., 2007; Gouvêa, 2010; Waddell, 2011).
At the stage of Multi-criteria Model Structuring (third stage), initially, decision makers de ine the focus on which they intend to act and what aspects they consider to be essential for their analysis. Subsequently, that materializes in the form of ‘evaluation axes’, which enable the tran-sition from a cognitive map to a multicriteria model (Costa et al., 2017; Ensslin et al., 2001). In the last stage (Evaluation of Potential Actions), the performance of the actions is evaluated. For that, an additive aggregation formula is used, which makes it possible to aggregate the local performances of the actions in a global evaluation (Costa et al., 2017; Ensslin et al., 2001).
2.2. Transport with urban characteris>cs
Regarding the Problem Structuring stage (second stage) and Multicriteria Model Structuring stage (third stage), in the context of transport with urban characteristics, the structure to be developed must consider social and technological interactions, taking into account the interplay of agents’ choices and situational constraints (Adelt et al., 2018). That is because urban mobility involves relatively complex aspects, such as land-use and spatial con iguration (Da Silva et al., 2008; Davidson et al., 2007; Gouvêa, 2009; Ojima, 2007).
According to Banister (2008), considering a sustainable mobility, a multicriteria analysis must involve a demand of people, according to their interests, associated with a minimization of their travel time (such as increasing bus frequency). Moreover, supposing that demand could be based on activities, travel is generated according to the daily actions performed by families and people (Davidson et al., 2007; Ojima, 2007).
As Davidson et al. (2007) clarify, an activity-based platform implies that modeled travel is derived within a general framework of the daily activities undertaken by households and persons, such as work or school and personal maintenance (e.g., health services, food shopping). Finally, transport systems are sensitive to policy changes over time (Nunes, 2010; Waddell, 2011), so that any changes affect travel demands (Davidson et al., 2007). This means that the FPVs to be considered must deal with: (i) social aspects; (ii) political-institutional aspects, and; (iii) technical and operational aspects.
3. MATERIAL AND METHODS
To achieve the proposed objectives, researchers developed a set of measures to be applied to public management groups. The selected group was composed of specialists in transport regu-lation from the National Land Transport Agency (ANTT) of Brazil, including its managers and superintendent. In an attempt to avoid only portraying the Agency’s positions, one of the con-cerns in the choice of these participants was the need for the specialist to have experience ex-ternal to ANTT and, preferably, contact with the regulated market.
In general, this research found that the difference between ‘semi-urban’ and ‘road’ bus ser-vices depends on social, political, institutional, technical and operational aspects (Adelt et al., 2018; Banister, 2008; Davidson et al., 2007; Ojima, 2007). In that kind of complex situation, MCDA makes it feasible to evaluate several alternative models or variants based on many quan-titative/qualitative criteria (Quadros e Nassi, 2015). According to Macharis and Bernardini (2015), there are numerous Multi-Criteria Decision techniques in use in transport activities and that includes passenger and freight transportation. Other papers that have used the multi-cri-teria techniques have cited their use in transportation planning (De Luca, 2014) and mobil-ity/logistics (Macharis et al., 2010, Ferretti e Degioanni, 2017) or for ranking railway projects (Mandic et al., 2014), or to evaluate preferential options among modes of transport (Sayers et
al., 2003), or to guide a furniture industry production manager (Bortoluzzi et al., 2017).
This study used a constructivist analysis (MCDA-C), grounded in a learning pattern, such as that used by Ensslin et al. (2000) or Bortoluzzi et al. (2017). The structure proposed is multidi-mensional and integrates mental maps with the Measuring of Attractiveness by means of a Cat-egorical-Based Evaluation Technique (MACBETH) (Bana e Costa and Vansnick, 1994, 1999; Bana e Costa et al., 2012; Bortoluzzi et al., 2017). In the ield of transport, Da Silva et al. (2008) used this same method to establish the key elements of a sustainable urban mobility approach in Brazil, and Costa and Granemann (2017) developed a technique, using MCDA-C, to evaluate the quality of semi-urban interstate bus services.
Following the guidelines of Ensslin et al. (2000), the MCDA-C technique used in this paper is detailed in two main stages:
• Stage 1: Structuring
Preparation stage that develops a better communication environment among the many ac-tors involved (Ensslin et al, 2000).
(i) structuring of the Mental Map (MM) and the value tree (diagram with the hierarchical ob-jectives);
(ii) structuring of all Fundamental Points of View (FPV) and, if necessary, decomposing it into Elemental (or Elementary) Points of View (EPV);
• Stage 2: Evaluation
Step to elaborate a multidimensional and quantitative model, establishing values for each FPV depending on their contribution to the study (Ensslin et al., 2000).
(i) develop the value functions for each FPV; (ii) establish weights (compensation rates);
(iii) evaluate the system impact pro ile and verify the behavior of the model; (iv) interpret the results.
4. MULTICRITERIA CHARACTERIZATION OF INTERSTATE BUS PASSENGER TRANSPORT
SERVICES
4.1. Structuring phase
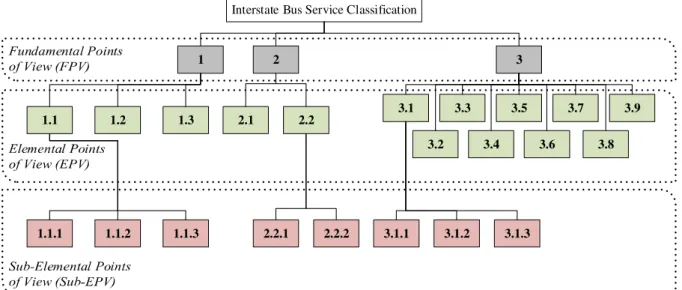
To construct the mental map and the value tree, during the structuring phase six decision makers were identi ied: four ANTT regulatory specialists with professional experience external to the Agency, one manager and one superintendent (both from ANTT but with market network experience). Although the number of decision makers may have been a limiting factor, together and based on a literature review (Adelt et al., 2018; Banister, 2008; Davidson et al., 2007; Nunes, 2010; Ojima, 2007; Waddell, 2011), they identi ied three FPV capable of in luencing interstate bus service regulation: (i) social aspects; (ii) political-institutional aspects; (iii) technical and operational aspects. Those FPV were decomposed into 14 EPV, divided into 8 Sub-Elemental Points of View (Sub-EPV), as displayed in Figure 3. Table 2 presents the full set of FPV, EPV and Sub-EPV. It is important to note that the decision makers made these subdivisions also considering the views of agents external to ANTT (such as users and entrepreneurs) obtained in work meetings and public consultations.
Table 2 – List of EPV Fundamental Points of
View (FPV) Elemental Points of View (EPV) Sub-Elemental Points of View (Sub-EPV)
1. Social Aspects
1.1. Interdependence of Health Services
1.1.1. Number of hospital beds per inhabitant 1.1.2. Existence of basic health care services 1.1.3. Existence of emergency services
1.2. School Interdependence -
1.3. Work Interdependence -
2. Political-Institutional Aspects
2.1. Availability of Public Policies for Urban
Mobility in the City -
2.2. Request from External Entity to Operate the Transport Service
2.2.1. Performed by public authority 2.2.2. Performed by private entity
3. Technical and Operational Aspects
3.1. Urban infrastructure
3.1.1. Existence of bus stop infrastructure 3.1.2. Line extension percentage on roadways 3.1.3. Line extension percentage on unpaved road.
3.2. Bus Occupancy Rate¹ -
3.3. Existence of Clandestine Transportation -
3.4. Bus Line Extension -
3.5. Fare Amount -
3.6. Frequency¹ -
3.7. Additional Services¹ -
3.8. Vehicle Features¹ -
3.9. Internal Urban Transport in the City²
Notes: ¹ EPV considered only when a regular offer of interstate bus passenger service exists. ²EPV considered only when there is no regular offer of interstate bus passenger service.
Interstate Bus Service Classification 1 2 3 1.1 1.2 1.3 2.1 2.2 3.1 3.2 3.3 3.4 3.5 3.6 3.7 3.8 3.9 2.2.1 2.2.2 3.1.1 3.1.2 3.1.3 1.1.1 1.1.2 1.1.3
Figure 3. General view of the FPV tree
4.1.1. Social aspects
As displayed in Table 2, to specify the social aspects of each city involved in the study, 3 Elemental Points of View (EPV) were considered. For this analysis, the speci ic values of each indicator were compared among the cities evaluated. This comparison aims to analyze the types of interdependence of one city with another, which are: health service interdependence, school interdependence, and work interdependence. If there is a great interdependence of these indicators between two cities, there is a tendency to have urban transport characteristics between them (Adelt et al., 2018; Davidson et al., 2007; Ojima, 2007).
4.1.2. Political-institutional aspects
For the political-institutional aspects, the study analyzed the availability (or existence) of public policies for urban mobility in the city. Whenever there are polices like these, the urban organization is better structured (Waddell, 2011).
Another way to consider the existence of ‘political-institutional aspects’ is when an external entity (such as a bus company or a municipal government) requests ANTT for a public transport operation between those cities. In this respect, there is probably an urban cluster, indicating urban characteristics in the region.
4.1.3. Technical and operational aspects
The de inition of ‘technical and operational aspects’ is not a simple task. This analysis involves factors, such as: urban infrastructure; existence of clandestine transportation (without authorization of the public authority); bus line extension; or fare prices. There are situations that indicate a trend towards ‘urban transport characteristics’, such as: the existence of clandestine urban transportation; good availability of urban infrastructure; shorter extension of the bus line or relatively low fare prices, considering inter-municipal transport characteristics.
If there is a regular offer of interstate bus passenger service in the city, it is feasible to describe the degree of urbanity using the bus occupancy rate and frequency (Banister, 2008; De Luca, 2014). In the same way, if there are additional services (i.e., package service/ transport of luggage under orders) or bigger vehicles in use (i.e., coaches with toilets) it means that the
transport should be classi ied as ‘not urban’. Supposing that there is no interstate transport service in the region, then it is relevant to observe whether urban transport (public municipal transport) is available inside the analyzed city or not.
4.2. Evalua>on Stage
The study used the Unique Synthesis Criterion Approach to construct the descriptor. This approach creates functions that combine and then maximize preferences of alternatives over attributes, constructed according to the collaborator performances (Guitouni e Martel, 1998; Ensslin et al., 2000; Ishizaka and Siraj, 2017). In this study, each transport market was represented by a function composed of all attributes that in luence ‘semi-urban’ or ‘road’ classi ication, accompanied by their respective weights. This function is analogous to that presented in Ensslin et al. (2000) and in Bortoluzzi et al. (2017), as displayed in the following equation:
= = 19 1 )) ( ( ) ( c c FPV c P m w m Pwhere M is the group of markets that will be analyzed; P(m) is the overall score of m Є M;
m is the market composed of two cities;
FPVc is the Fundamental Points of View linked to criteria c;
wc is the weight (or ‘compensation rate’) for the criterion c which impact on
each FPVc;
(PFPVc(m)) is the local score.
In this paper, wc (c = 1, … 19), which indicates each EPV or Sub-EPV analyzed. Although this
study performed the complete analysis, just the FPV 1 (social aspects) are presented in detail for better representation. The FPV 2 and 3 are treated analogously.
4.2.1. Construction of value functions
To construct the value functions MACBETH was used, as developed by Bana e Costa and Vansnick (1994). According to Ensslin et al. (2000), to use the MACBETH it is necessary to question the decision maker about the attraction difference between two elements of analysis. Usually, the answer is one of the following:
• Null;
• Very weak attraction difference;
• Weak attraction difference;
• Moderate attraction difference;
• Strong attraction difference;
• Very Strong attraction difference;
• Extreme attraction difference.
If necessary, two ordinal scales can be combined (i.e.: ‘weak-moderate’ or ‘moderate-strong’). When this happens, the MACBETH software uses diffused linear programming, according to the model requirements.
The impact level of the criterion (‘Level 1’ – high in luence – or ‘Level 3’ – low in luence) and the scales types were developed according to the decision maker’s preference. The scale values
were set to make higher values represent ‘semi-urban’ transport characteristics, while lower values represented ‘road’ bus service transport.
Regarding the EPV 1.1 (‘interdependence of health service’), when there are two relatively close cities with severe distinction between the availability of their health services, a low of people is created between those cities (Ojima, 2007; Pires et al., 2010), indicating a ‘semi-urban’ or ‘metropolitan’ transport characteristic (Gouvêa, 2009). This occurs for several reasons, such as trips for health treatment or doctor's appointments. In the context of rural residential areas, this approach is known as ‘public service facilities integrity’ and is part of ‘social equilibrium’ (Ma et al., 2019). To calculate the interdependence of health service, the numbers of hospital beds per inhabitant in each city were used as reference, compared with quartile position in the national ranking. The Brazilian Institute of Geography and Statistics (IBGE) gives the national ranking.
The criterion used to de ine the function values was the interquartile gap. The greater the interquartile gap positioning for each city, the greater the in luence of hospital services is between them. For instance, if the city ‘X’ is positioned in the irst quartile (worst health structure) and the city ‘Y’ is positioned in the fourth quartile (better health structure), there is considered to be ‘high’ in luence between both cities, because there will be a low of people from ‘Y’ to ‘X’. However, if both cities are in the fourth quartile, the in luence will be low. The value functions used for this criterion were ‘high’, ‘medium’ or ‘low’ in luence between cities, according to the Figure (the arrows indicate the positioning/gap between cities).
Q4 Q3 Q2 Q1 Better Worst High Q4 Q3 Q2 Q1 Better Worst Medium Q4 Q3 Q2 Q1 Better Worst Low Influence: Q u a rt il e o f h o sp it a l b e d /i n h a b it a n t n u m b e r
Figure 4. Value functions for ‘hospital bed/inhabitant number’. Note: the arrows indicate the positioning/gap between cities
To measure the ‘existence of basic health care services’ and the ‘existence of emergency services’: ‘yes’, was used if one city has the service and the other does not; or ‘No’, if both cities have or do not have those services.
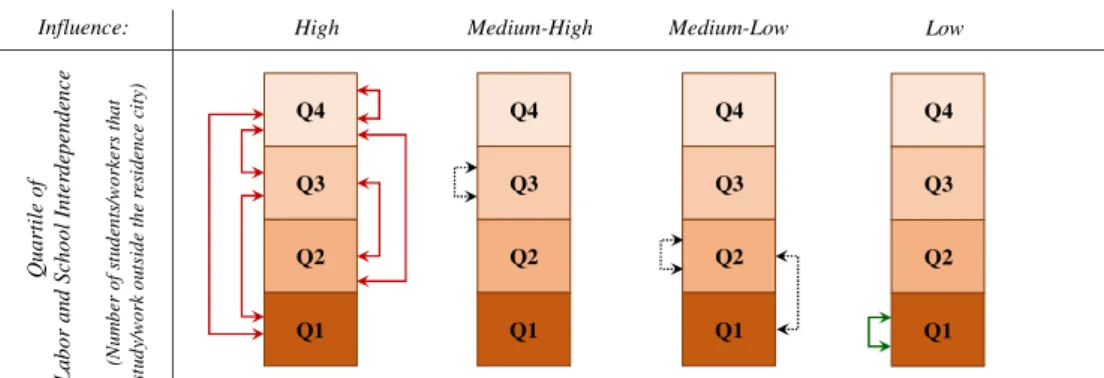
In regard to ‘school interdependence’ and ‘work interdependence’, they were structured using quartiles in a similar way to the ‘interdependence of health service’. However, in this respect, the number of students (or workers) that study (or work) outside their city of residence was used, according to IBGE classi ication (Figure). All the other value functions for the model (FPV, EPV and Sub-EPV) were determined in similar ways.
Q4 Q3 Q2 Q1 High Q4 Q3 Q2 Q1 Medium-High Q4 Q3 Q2 Q1 Influence: Q u a rt il e o f L a b o r a n d S ch o o l In te rd ep e n d en c e Q4 Q3 Q2 Q1 Low Medium-Low (N u m b er o f st u d en ts /w o rk e rs t h a t st u d y/ w o rk o u ts id e th e re si d e n ce c it y)
Figure 5. Value functions for ‘school interdependence’ and ‘work interdependence’ Note: the arrows indicate the posi-tioning/gap between cities
A matrix was developed for semantic judgments using the MACBETH software and consid-ering the value functions as reference. After the judgments, the scale value is given by the soft-ware (Bana e Costa and Vansnick, 1999). The EPV 1.1 (Sub-EPV 1.1.1, 1.1.2 and 1.1.3) are dis-played in Table 3, and the EPV 1.2/EPV 1.3 are disdis-played in Table 4. All the other matrixes (FPV 2 and 3) were determined analogously.
Table 3 – Matrix of semantic judgment for EPV 1.1 1.1.1. Number of hospital beds per inhabitant
Basis of Comparison Judgments Value Functions
Level 1 Level 2 Level 3 Current scale
Level 1 High influence Level 1 null strong extreme 100.00
Level 2 Medium
influence Level 2 null v. strong 55.56
Analogously
Level 3 Low influence Level 3 null 0.00
1.1.2. Existence of basic health care services
Basis of Comparison Judgments Value Functions
Level 1 Level 2 Current scale
Level 1 There is
influence Level 1 null extreme 100.00
Level 2 There is no
influence Level 2 null 0
1.1.3. Existence of emergency services
Basis of Comparison Judgments Value Functions
Level 1 Level 2 Current scale
Level 1 There is
influence Level 1 null moderate 100.00
Level 2 There is no
influence Level 2 null 0
Table 4 – Matrix of semantic judgment for EPV 1.2 and 1.3 1.2. School Interdependence / 1.3 Work Interdependence
Basis of Comparison Judgments
Value Functions
Level 1 Level 2 Level 3 Level 4
Current scale
Level 1
High
influence Level 1 null moderate v. strong extreme 100.00
Level 2
Med-High
influence Level 2 null wk-moderate mod-strong 40.00
Level 3
Med-Low
influence Level 3 null wk-moderate 0.00
Level 4
Low
influence Level 4 null (-)40.00
4.2.2. Establishment of weights
The weights (‘compensation rates’) were determined according to the decision makers’ choices, especially considering the relevance of each criterion according to the experts’ experience. In this case, for example, the experts considered that the political-institutional aspects have less relevance than the social or technical-operational aspects for the following reasons:
• Some existing public policies are not well de ined (Da Silva et al., 2008), while others may have been induced by speci ic interests – according to Nunes (2010), some politicians are supporters or owners of bus companies;
• Some regional public policies may not correspond to the reality of the municipality (Gouvêa, 2009).
• The mere existence of a public policy does not guarantee its effectiveness (Pires et al., 2010).
• The social aspects are treated as equally relevant to those technical-operational aspects, since they are complementary in terms of transport demand/offer (Davidson et al., 2007). The weights of each EPV and Sub-EPV were also assigned in an analogous way. Each criterion was ranked by level, assuming the given weight. Those weights were normalized to a percentage value obtained from the semantic judgment matrix. This technique followed the procedure proposed by Bana e Costa e Vansnick (1994), based on MACBETH methodology.
Table 5 – Final weight of the variables, when there is a regular offer of interstate bus passenger services
FPV EPV Sub-EPV 1 40% 1.1 20% 1.1.1 20% 1.1.2 30% 1.1.3 50% 1.2 40% 1.3 40% 2 20% 2.1 55% 2.2 45% 2.2.1 35% 2.2.2 65%
Table 5 – Final weight of the variables, when there is a regular offer of interstate bus passenger services (continue) FPV EPV Sub-EPV 3 40% 3.1 11% 3.1.1 39% 3.1.2 51% 3.1.3 10% 3.2 13% 3.3 16% 3.4 12% 3.5 12% 3.6 16% 3.7 9% 3.8 11%
Tables 5 and 6 displays the normalized compensation rates in cases where there is, and there is no, a regular offer of interstate bus passenger services. In both cases, the FPV 1 (Social Aspects) and FPV 3 (Technical and Operational Aspects) each represent 40% of all the inal weight of the model. The remaining 20% were attributed to FPV2.
Table 6 – Final weight of the variables, when there is no regular offer of interstate bus passenger services
FPV EPV Sub-EPV 1 40% 1.1 20% 1.1.1 20% 1.1.2 30% 1.1.3 50% 1.2 40% 1.3 40% 2 20% 2.1 55% 2.2 45% 2.2.1 35% 2.2.2 65% 3 40% 3.1 19% 3.1.1 39% 3.1.2 51% 3.1.3 10% 3.3 28% 3.4 22% 3.5 22% 3.9 9% 4.2.3. Threshold calibration: ‘semi-urban’ or ‘road’?
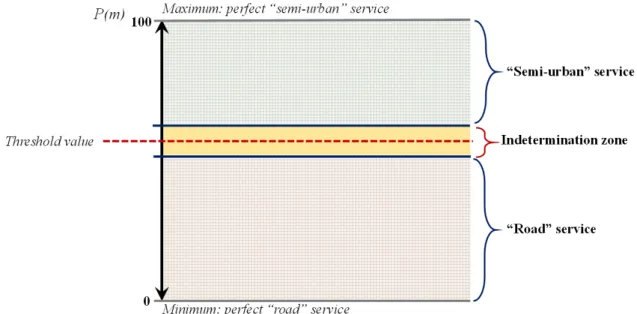
Having identi ied the weights and value functions of each variable, it was necessary to de ine a threshold value to classify the market as ‘semi-urban’ or ‘road’. The threshold value delimits the border between ‘semi-urban’ and ‘road’ transport services, according to the overall score of each market – P(m). The higher the overall score of the market, the more ‘semi-urban’ it will tend to be. So, if this overall score value is above the threshold, the market will be considered as ‘semi-urban’. There is an indeterminate zone around the threshold. If the overall score is in this zone it means that the market is not precisely classi ied and requires further study. Figure 6 illustrates that situation.
To calculate the threshold value, 10 known markets were selected, ive already operated as ‘semi-urban’ and ive already operated as ‘road’ services between cities short distances apart (less than 100 km). Those markets were chosen because there the public authority has no doubts about their classi ication in view of their social and technical-operational characteristics. Just to test the model’s behavior, the study included the market between Rio de
Janeiro city and São Paulo city which is unquestionably a ‘long distance’ market and a ‘road’ service. In other words, it is inconceivable to transport passengers between Rio de Janeiro and São Paulo (440 km apart) in urban buses. Table dispays the selected markets.
Figure 6. Representation of the MCDA-C model developed to classify the market as ‘semi-urban’ or ‘road’ Table 7 – Markets used for calibrating the threshold
‘Road’ service (Long Distance)
‘Road’ service (Short Distance)
‘Semi-urban’ service
Rio de Janeiro/RJ - São Paulo/SP
(440 km) Venceslau Braz/PR - Itararé/SP (75 km)
Floriano/PI – Barão de Grajaú/MA (6 km)
Espinosa/MG – Jacaraci /BA (85 km) Luziânia/GO - Brasília/DF (60 km) Lagarto/SE - Paripiranga/BA (40 km) Três Rios/RJ - Chiador/MG (30 km) Nanuque/MG - Ibirapuã/BA (60 km)
Ourinhos/SP - Marques dos Reis/PR (9 km)
Espírito Santo do Pinhal/SP - Jacu nga/MG (28 km)
Tagua nga/DF - Valparaiso/GO (45 km)
Legend: PR = State of Paraná; SP = State of São Paulo; PI = Stae of Piauí; MA = State of Maranhão; MG = Syate of Minas Gerais; BA = State of Bahia; GO
= State of Goias; DF = Federal District; SE = State of Sergipe; RJ = State of Rio de Janeiro;.
Table 2 – Final value function for each market
Market (cities) Overall Score
‘Road’ service (Short Distance)
Venceslau Braz/PR - Itararé/SP 40.24
Espinosa/MG - Jacaraci/BA 43.06
Lagarto/SE - Paripiranga/BA 47.41
Nanuque/MG - Ibirapuã/BA 51.65
Espírito Santo do Pinhal/SP - Jacutinga/MG 59.52
‘Semi-urban’ service
Floriano/PI - Barão de Grajaú/MA 66.37
Luziânia/GO - Brasília/DF 72.57
Três Rios/RJ - Chiador/MG 73.09
Ourinhos/SP - Marques dos Reis/PR 73.98
Taguatinga/DF - Valparaiso/GO 84.54
Threshold (average between 59.52 and 66.37 – indeterminate zone) 63 ‘Road’ service
The overall score for each market was calculated using the proposed method and the data collected. The threshold value was considered as the average value obtained between the maximum overall score for ‘road’ market and the minimum overall score for ‘semi-urban’ market. The indeterminate zone was the difference between those maximum and minimum values. Table 8 sets out the overall score for each market and the threshold values.
4.2.4. Market analysis
The public authority listed 11 interstate bus services markets that were uncertain about their current categorizations (markets operated by road services that have been requesting to switch to semi-urban services, and vice versa). Those uncertainties were generated by several causes, such as user, company or municipal requesting.
Considering the need to technically categorize these 11 unknown interstate bus services markets (which have regular offer of interstate bus passenger service), each of them was inserted in the developed model for analysis. The overall score of each of them was obtained using the proposed method (Table 3).
Table 3 – Unknown interstate bus service markets to be categorized Market (ci>es) Overall Score Distance (km)
Guaçuí/ES - Na vidade/RJ 39.95 58
S. J. da Boa Vista/SP - Poços de Caldas/MG 45.94 48
Poços de Caldas/MG - Divinolândia/SP 48.36 40
Brasília/DF - Formosa/GO 52.52 80
Espírito Santo do Pinhal/SP - Andradas/MG 53.52 25
Socorro/SP - Bueno Brandão/MG SC 60.11 38
Agudos do Sul/PR - São Bento do Sul/ 62.49 40
Andradas/MG - São João da Boa Vista/SP 67.65 38
Jacu nga/MG - Itapira/SP 70.80 34
Extrema/MG - Bragança Paulista/SP 71.38 35
Selviria/MS - Ilha Solteira/SP 78.23 18
5. RESULTS
To represent the result, all the ‘road service’, ‘unknown’, and ‘semi-urban service’ overall scores were ranked in the same table (Table 4). For better comprehension, each analyzed market was referenced by a letter (from letter ‘A’ to letter ‘V’), and displayed graphically in Figure.
According to these results, the markets ‘G’ (Guaçuı́/Natividade), ‘H’ (S. J. da Boa Vista/ Poços de Caldas), ‘I’ (Poços de Caldas/Divinolândia), ‘J’ (Brası́lia/Formosa) and ‘K’ (Espı́rito Santo do Pinhal/Andradas) could be classi ied as ‘road’ according to the proposed method. In this respect, the public authority will directly authorize them for an inde inite period with freedom to determine the bus fare. In the other situation, the markets ‘N’ (Andradas/São João da Boa Vista), ‘O’ (Jacutinga/Itapira), ‘P’ (Extrema/Bragança Paulista) and ‘Q’ (Selviria/Ilha Solteira) could be classi ied as ‘semi-urban’.
Using this methodology, the public authority has grounds on which to initiate a bidding process, aiming at a future delegation of interstate bus transport service with urban characteristics. The bidding notice must ensure the economic viability of the market, considering 15 years operation with controlled bus fare.
The markets ‘L’ and ‘M’ could be classi ied as road if the absolute threshold value is considered as a reference (63 points). However, these markets have overall score values closer to the threshold value and should not be de initively classi ied (they are displaced in the
indeterminate zone). The markets ‘L’ and ‘M’ require further studies to improve the accuracy of the model, taking into account some speci icities of each city.
Table 4 – Ranking of overall score for each bus service classification
Service classifica>on Ref. Market (ci>es) Overall Score Distance (km)
‘Road’ service
(Long Distance) A Rio de Janeiro/RJ - São Paulo/SP 7.33 440
‘Road’ service (Short Distance)
B Venceslau Braz/PR - Itararé/SP 40.24 75
C Espinosa/MG - Jacaraci/BA 43.06 85
D Lagarto/SE - Paripiranga/BA 47.41 40
E Nanuque/MG - Ibirapuã/BA 51.65 60
F Espírito Santo do Pinhal/SP - Jacu nga/MG 59.52 28
Unknown
G Guaçuí/ES - Na vidade/RJ 39.95 58
H S. J. da Boa Vista/SP - Poços de Caldas/MG 45.94 48 I Poços de Caldas/MG - Divinolândia/SP 48.36 40
J Brasília/DF - Formosa/GO 52.52 80
K Espírito Santo do Pinhal/SP - Andradas/MG 53.52 25
L Socorro/SP - Bueno Brandão/MG 60.11 38
M Agudos do Sul/PR - São Bento do Sul/SC 62.49 40 N Andradas/MG - São João da Boa Vista/SP 67.65 38
O Jacu nga/MG - Itapira/SP 70.80 34
P Extrema/MG - Bragança Paulista/SP 71.38 35
Q Selviria/MS - Ilha Solteira/SP 78.23 18
‘Semi-urban’ service
R Floriano/PI - Barão de Grajaú/MA 66.37 6
S Luziânia/GO - Brasília/DF 72.57 60
T Três Rios/RJ - Chiador/MG 73.09 30
U Ourinhos/SP - Marques dos Reis/PR 73.98 9
V Tagua nga/DF - Valparaiso/GO 84.54 45
7 40 43 47 52 60 40 46 48 53 54 60 62 68 71 71 78 66 73 73 74 85 0 10 20 30 40 50 60 70 80 90 100 A B C D E F G H I J K L M N O P Q R S T U V “Road” market “Semi-urban” market Indetermination zone (60 - 66)
Figure 7. Graphic arrangement of the results obtained.
In the end, this result makes it possible to af irm that the developed method was able to rank the markets. Through this technique, the classi ication of the markets occurred more objectively, according to the pre-established criteria of FPV, EPV and Sub-EPV.
6. DISCUSSION
The MCDA-C proved to be appropriate for the proposed goal. However, this technique requires careful de inition of criteria and choice of specialists. Even in situations where there is a restriction on the number of specialists, it is possible to take advantage of the existing literature to de ine the FPV, EPV and Sub-EPV.
In the case of this paper, de ining urban characteristics as being an agglomeration of information on social, political-institutional and technical-operational aspects proved effective. Subsequently, the weighting of the criteria and their respective allocation in the Macbeth software are also sensitive activities and must be preceded by justi ications. Once all the steps have been completed, the method becomes robust and able to substantiate the decision of the public authority.
7. CONCLUSION
This paper shows how scienti ic theory, based on a Multi-Criteria Decision Analysis-Aid – Con-structivist (MCDA-C) technique, can be useful when handling policy decision-making. As a con-structivist approach, the method opens space for discussion and brainstorming, enabling the creation of duly substantiated regulations.
The study presented a method to classify the interstate bus transport services in Brazil as ‘semi-urban’ or ‘road’. This method complements the one presented by Brandão Filho et al. (2016) and becomes useful for public authority decision-making. The ‘semi-urban’, delegated by Union concession, requires bidding process and must be provided by urban buses. The ‘road’, authorized by the public authority, needs to be provided by coaches. The model developed measures the degree of ‘urban characteristics’ using the MCDA-C technique, supported by the MACBETH software.
The study was important as a subsidy for the decision-making of National Land Transport Agency (ANTT) managers. As a result, at least four markets should be indicated to conduct bid-ding processes.
The proposed technique can help solve local problems in other countries in the same way that it has been successful inr Brazil. In order to adapt the method, some points of view can be inserted or excluded. In addition, where appropriate, the indicator weights can be changed as desired.
As a suggestion for new research, it would be possible to test new criteria to de ine urban characteristics and compare them to this study, in ways such as: using Big Data through smartphones to characterize demand and low of people between municipalities; using the So-cial Vulnerability Index (IPEA, 2015) as an element of soSo-cial and urban pro ile integration; and hierarchizing and weighting the municipalities according to their size.
As a lesson learned, it has been proven that transport policies should not be implemented with incomplete regulation; correcting their failures may require much more effort in the fu-ture.
ACKNOWLEDGEMENTS
The authors would like to thank all people involved in this study, specially Ana Claudia Silveira Torres, Everaldo Valenga Alves, and ANTT’s team. This research did not receive any speci ic grant from funding agencies in the public, commercial, or not-for-pro it sectors.
REFERENCES
Adelt, F.; J. Weyer; S. Hoffmann; and A. Ihrig (2018) Simulation of the Governance of Complex Systems (SimCo): Basic Con-cepts and Experiments on Urban Transportation. Journal of Arti icial Societies & Social Simulation, v. 21, n. 2. DOI: 10.18564/jasss.3654
Bana e Costa, C. and J. Vansnick (1994) MACBETH: An interactive path towards the construction of cardinal value functions.
International Transactions in Operational Research, v. 1, n. 4, p. 489–500. DOI: 10.1016/0969-6016(94)90010-8.
Bana e Costa, C. and J. Vansnick (1999) “Preference relations and MCDM” In T. Gál, T. Stewart, e T. Hanne (eds.), Multiple criteria
decision making: advances in MCDM models, algorithms, theory, and applications. Massachusetts: Kluwer Academic
Bana e Costa, C.; J. De Corte and J. Vansnick (2012) MACBETH. International Journal of Information Technology and Decision
Making, v. 11, n. 2, p. 359–387. DOI: 10.1142/S0219622012400068
Banister, D. (2008) The sustainable mobility paradigm. Transport Policy, v. 15, n. 2, p. 73-80. DOI: 10.1016/j.tran-pol.2007.10.005
Bortoluzzi, S. C.; S. R. Ensslin; L. Ensslin and M. O. de Almeida (2017) Multicriteria decision aid tool for the operational man-agement of an industry: a constructivist case. Brazilian Journal of Operations & Production Manman-agement, v. 14, n. 2, p. 165-182. DOI: 10.14488/BJOPM.2017.v14.n2.a4
Brandão Filho, J. E.; H. A. S. Ribeiro and C. S. de Oliveira (2016) Método para classi
icação dos mercados de transporte rodoviá-rio interestadual semiurbano de passageiros. Anais do XXX Congresso de Pesquisa e Ensino em Transportes, ANPET, Rio de
Janeiro, Brazil. http://www.anpet.org.br/xxxanpet/site/anais_busca_online/documents/6_150_AC.pdf. (Consulted on September 6, 2017)
Brazil (2001) 10,233/2001 Brazilian law, which Provides for the restructuring of water and land transport, creates the Na-tional Council for Transport Policy Integration, the NaNa-tional Land Transport Agency, the NaNa-tional Waterway Transporta-tion Agency and the NaTransporta-tional Department of Transport Infrastructure, and makes other arrangements.
http://www.planalto.gov.br/ccivil_03/leis/LEIS_2001/L10233.htm. (Consulted on September 6, 2017)
Costa, P. H. S.; M. G. Quirino and S. R. Granemann (2017) Avaliação da qualidade nos serviços de transporte rodoviário interes-tadual semiurbano de passageiros da região do Distrito Federal e dos municı́pios de seu entorno. Revista Transportes, v. 25, n. 4, p. 83-95. DOI: 10.14295/transportes.v25i4.1121
Costa, P. H. S. and S. R. Granemann (2017) Metodologia multicritério para classi icar as empresas de transporte rodoviário interestadual semiurbano de passageiros por nı́vel de serviço. Revista Transportes, v. 25, n. 3, p. 126-137. DOI: 10.14295/transportes.v25i3.1301
Da Silva, A. N. R.; M. da Silva Costa and M. H. Macedo (2008) Multiple views of sustainable urban mobility: The case of Brazil.
Transport Policy, v. 15, n. 6, p. 350-360. DOI: 10.1016/j.tranpol.2008.12.003
Davidson, W.; R. Donnelly; P. Vovsha; J. Freedman; S. Ruegg; J. Hicks; J. Castiglione; and R. Picado (2007) Synthesis of irst prac-tices and operational research approaches in activity-based travel demand modeling. Transportation Research Part A:
Pol-icy and Practice, v. 41, n. 5, p. 464-488. DOI: 10.1016/j.tra.2006.09.003
De Luca, S. (2014) Public engagement in strategic transportation planning: An analytic hierarchy process based approach.
Transport Policy, v. 33, p. 110-124. DOI: 10.1016/j.tranpol.2014.03.002
Ensslin, L.; A. Dutra and S. R. Ensslin (2000) MCDA: a constructivist approach to the management of human resources at a governmental agency. International Transactions in Operational Research, v. 7, n 1, p. 79-100. DOI:
10.1111/j.1475.3995.2000.tb00186.x
Ferretti, V. and A. Degioanni (2017) How to support the design and evaluation of redevelopment projects for disused rail-ways? A methodological proposal and key lessons learned. Transportation Research Part D: Transport and Environment, v. 52, p. 29-48. DOI: 10.1016/j.trd.2017.02.008
Gouvêa, R. G. (2009) Diretrizes para a gestão metropolitana no Brasil. Revista EURE, v. 35, n. 104, p. 47-76. DOI: 10.4067/S0250-71612009000100003
Guitouni, A. and J. Martel (1998) Tentative guidelines to help choosing an appropriate MCDA method.
European Journal of Op-erational Research, v. 109, n 2, p. 501–521. DOI: 10.1016/S0377-2217(98)00073-3
Instituto de Pesquisa Econômica Aplicada – IPEA (2015) Atlas de vulnerabilidade social nos municípios brasileiros. Brası́lia: Ipea. http://ivs.ipea.gov.br/images/publicacoes/Ivs/publicacao_atlas_ivs.pdf. (Consulted on January 22, 2019)
Ishizaka, A. and S. Siraj (2017) Are multi-criteria decision-making tools useful? An experimental comparative study of three methods. European Journal of Operational Research, v. 264, n. 2, p. 462-471. DOI: 10.1016/J.EJOR.2017.05.041
Ma, W.; G. Jiang; W. Li; T. Zhou and R. Zhang (2019) Multifunctionality assessment of the land use system in rural residential areas: Confronting land use supply with rural sustainability demand. Journal of environmental management, v. 231, n. 1, p. 73-85. DOI: 10.1016/j.jenvman.2018.09.053
Macharis, C. and A. Bernardini (2015) Reviewing the use of Multi-Criteria Decision Analysis for the evaluation of transport projects: Time for a multi-actor approach. Transport Policy, v. 37, p. 177-186. DOI: 10.1016/j.tranpol.2014.11.002 Macharis, C.; A. De Witte and L. Turcksin (2010) The Multi-Actor Multi-Criteria Analysis (MAMCA) application in the Flemish
long-term decision making process on mobility and logistics. Transport Policy, v. 17, n. 5, p. 303-311. DOI: 10.1016/j.tran-pol.2010.02.004
Mandic, D.; P. Jovanovic and M. Bugarinovic (2014) Two-phase model for multi-criteria project ranking: Serbian Railways case study. Transport Policy, v. 36, p. 88-104. DOI: 10.1016/j.tranpol.2014.08.002
Marttunen, M.; J. Lienert and V. Belton (2017) Structuring problems for Multi-Criteria Decision Analysis in practice: A litera-ture review of method combinations. European Journal of Operational Research. v. 263, n. 1, p. 1–17. DOI:
10.1016/j.ejor.2017.04.041
Nunes, N. T. R. (2010) Sistema de ônibus semiurbano: uma maneira e iciente de redução de tarifas. Revista dos Transportes
Públicos, v. 124, p. 103-110. http://
iles-server.antp.org.br/_5dotSystem/download/dcmDocu-ment/2013/01/10/5DC381D9-CEA2-400B-8BC8-CA30098F7A96.pdf. (Consulted on January 10, 2019)
Ojima, R. (2007) The dimensions of urban sprawl and a methodological proposal for comparative studies: a social-spatial ap-proach in Brazilian urban agglomerations. Revista Brasileira de Estudos de População, v. 24, n. 2, p. 277-300. DOI: 10.1590/S0102-30982007000200007
Pires, M. R. G. M.; L. B. D. Göttems; C. M. F. Martins; D. Guilhem and E. D. Alves (2010) Supply and demand of the medium-com-plexity/SUS: relation with primary health care. Ciência & Saúde Coletiva, v. 15, p. 1009-1019. DOI: 10.1590/S1413-81232010000700007
Quadros, S. G. R. and C. D. Nassi (2015) An evaluation on the criteria to prioritize transportation infrastructure investments in Brazil. Transport Policy, v. 40, p. 8-16. DOI: 10.1016/j.tranpol.2015.02.002
Sayers, T. M.; A. T. Jessop and P. J. Hills (2003) Multi-criteria evaluation of transport options— lexible, transparent and user-friendly?. Transport Policy, v. 10, n. 2, p. 95-105. DOI: 10.1016/S0967-070X(02)00049-5
Schiller, A. O. S. B. (2018) The new grant making model of authorization established by Law n. 12,996/2014 and its effects on public interstate and international passenger road transport sector. Revista Digital de Direito Administrativo, v. 5, n. 2, p. 151-179. DOI: 10.11606/issn.2319-0558.v5i2p151-179
Waddell, P. (2011) Integrated Land Use and Transportation Planning and Modelling: Addressing Challenges in Research and Practice. Transport Reviews, v. 31, n. 2, p. 209-229. DOI: 10.1080/01441647.2010.525671