Faculdade de Engenharia da Universidade do Porto
Rua Dr. Roberto Frias, s/n 4200-465 Porto PORTUGAL
VoIP/SIP: [email protected] ISN: 3599*654 Telefone: +351 22 508 14 00 Fax: +351 22 508 14 40 URL:http://www.fe.up.pt Correio Electrónico:[email protected]
MASTER IN OCCUPATIONAL
SAFETY AND HYGIENE
ENGINEERING
Dissertation presented to obtain the degree of M aster in Occupational Safety and Hygiene Engineering in Faculty of Engineering of University of Porto
ACCLIMATION EFFECTS IN MILITARY
OPERATIONAL PHYSICAL PERFORMANCE
André Fernando Fernandes Ferraz
Supervisor: Professor João Manuel Abreu dos Santos Baptista(FEUP) Co-Supervisor: Professor Joana Cristina Cardoso Guedes (FEUP) Arguent: Professor José Augusto Rodrigues dos Santos (FADEUP) President of the Jury: Professor Mário Augusto Pires Vaz(FEUP)
___________________________________ 2016
Occupational Safety and Hygiene Engineering
I
ABSTRACT
When exposed to extremely hot environment, humans are at considerable risk of experiencing changes in a variety of physiological parameters, such as increase in the heart rate, body temperature, blood pressure and sweat production, and heat related disorders, such as heat stroke, heat cramps and heat exhaustion. In addition to reducing the environmental heat load, people exposed to extremely hot environments should receive heat acclimation training under scientific instruction to guarantee their health and safety. Heat acclimation, i.e., the protective physiological responses of the human body under a repeated thermal stimulus, is beneficial for adapting to hot environments and can improve the body's heat tolerance capability. This article presents 6 case-studies of young military man in which, the effects of 14 days acclimation to dry heat (±40 ºC and ±30%rh) were studied, in order to access the influence and ability to withstand the stress, i.e., exercise in the heat. The measurements included: Core temperature, Heart rate (HR), Maximum oxygen consumption VO2, Body mass loss, and Lactate concentration. Borg’s
scale of perceived exertion (RPE) was also used. Test protocols occurred at three types of exertion: marching without additional load (MNL), marching with additional load (MWL) and running, at two different environmental conditions: Thermoneutral (±22 ºC and ±40%rh) and Thermal Stress (±40 ºC and ±30%rh).
An improvement in the individual's performance in terms of Core temperature, HR, VO2, as also for the perceived exertion were observed, mainly for the MNL and MWL protocols performed in thermoneutral condition after acclimation and in some cases, in the Running protocol at the thermoneutral and thermal stress condition.
Despite the improvement observed in the performance based on the parameters studied, future studies are needed in order to obtain strong evidences about the efficiency of the acclimation process applied in this experiment.
Keywords: Acclimation, Thermoneutral, Thermal stress, Heat Stress, Thermoregulation,
III
TABLE OF CONTENTS
1 INTRODUCTION ... 1
1.1 Scope ... 1
1.2 Effects of Acclimatization protocols in performance ... 2
1.3 Study objectives ... 3
2 MATERIAL AND METHODS ... 3
2.1 Subject/Sample ... 3
2.2 Test protocols ... 4
2.2.1 Marching Without additional load Protocol ... 5
2.2.2 Marching With Additional Load Protocol ... 6
2.2.3 Running Protocol ... 6
2.3 Acclimation Process ... 6
2.4 Physiological monitoring ... 7
2.4.1 Core temperature ... 7
2.4.2 Heart rate ... 8
2.4.3 Pulmonary gas exchange ... 8
2.4.4 Lactate concentration ... 8
2.4.5 Dehydration ... 9
2.4.6 Borg Rate of Perceived Exertion ... 9
2.4.7 Climatic Chamber ... 9 2.5 Stopping criteria ... 10 3 RESULTS ... 11 3.1 Subject M06 ... 11 3.1.1 Core temperature ... 11 3.1.2 Heart rate ... 15
3.1.3 Maximum Oxygen Uptake ... 17
3.1.4 Lactate ... 19
3.1.5 Body mass loss ... 20
3.1.6 Borg Rating of Perceived Exertion ... 22
3.2.1 Core temperature ... 26
3.2.2 Heart Rate ... 26
3.2.3 Maximum Oxygen Uptake ... 27
3.2.4 Lactate ... 28
3.2.5 Body Mass Loss ... 29
3.2.6 Borg Rating of Perceived exertion ... 30
3.3 Subject M02 ... 31
3.3.1 Core temperature ... 31
3.3.2 Heart Rate ... 31
3.3.3 Maximum Oxygen Uptake ... 32
3.3.4 Lactate ... 32
3.3.5 Body Mass Loss ... 33
3.3.6 Borg Rating of Perceived exertion ... 34
3.4 Subject M05 ... 35
3.4.1 Core temperature ... 35
3.4.2 Heart Rate ... 35
3.4.3 Maximum Oxygen Uptake ... 36
3.4.4 Lactate ... 37
3.4.5 Body Mass Loss ... 37
3.4.6 Borg Rating of Perceived exertion ... 38
3.5 Subject M07 ... 39
3.5.1 Core temperature ... 39
3.5.2 Heart Rate ... 40
3.5.3 Maximum Oxygen Uptake ... 40
3.5.4 Lactate ... 41
3.5.5 Body Mass Loss ... 42
3.5.6 Borg Rating of Perceived exertion ... 43
3.6 Subject M09 ... 44
3.6.1 Core temperature ... 44
3.6.4 Lactate ... 46
3.6.5 Body Mass Loss ... 46
3.6.6 Borg Rating of Perceived exertion ... 47
4 DISCUSSION ... 49
5 CONCLUSIONS ... 53
6 LIMITATIONS AND FUTURE WORK ... 54
7 ACKNOWLEDGMENTS ... 54
VII
LIST OF GRAPHICS
Graphic 1 - Core temperature variation during "Marching with additional Load" assay at 22ºC,
40% Hr – Study Case M06 ... 12
Graphic 2 - Heart rate and core temperature variation during MWL protocol at the Thermoneutral condition - Study Case M06 ... 16
Graphic 3 - Oxygen consumption for Running protocol at the Themoneutral condition - Study Case M06 ... 18
Graphic 4 - Body Mass Loss in liters per hour on marching protocols - Study Case M06 ... 21
Graphic 5 - Body Mass Loss in liters per hour on running protocols - Study Case M06 ... 21
Graphic 6 - RPE of Marching protocols at Thermal Stress Condition - Study Case M06 ... 24
IX
LIST OF TABLES
Table 1 - Summary of the sub-protocol conducted for this case study ... 5
Table 2 - Core Temperature Summary – Case Study M06 ... 12
Table 3 - Mathematical expressions from the obtained curves – Study Case M06 ... 13
Table 4 - Obtained Gradients in Degrees per hour – Study Case M06 ... 14
Table 5 - Mathematical simulations for the core temperature, considering the calculated gradients and initial temperatures – Study Case M06 ... 14
Table 6 - Summary of the main results of the Heart Rate parameter – Study Case M06 ... 15
Table 7 - Summary of the average and maximal VO2 consumption for each protocol – Study Case M06 ... 17
Table 8 - Identification of warm-up and recovery periods visualized in Graphic 3 - Study Case M06 ... 18
Table 9 - Summary of the Lactate concentration for each experiment – Study Case M06 ... 19
Table 10 - Summary Body Mass Loss calculated through percentage and liters per hour – Case Study M06 ... 22
Table 11 - Summary o the RPE scale for every performed test – Study Case M06 ... 25
Table 12 - Core Temperature Summary – Case Study M01 ... 26
Table 13 - Summary of the main results of the Heart Rate parameter – Study Case M01 ... 27
Table 14 - Summary of the average and maximal VO2 consumption for each protocol – Study Case M01 ... 28
Table 15 - Summary of the Lactate concentration for each experiment – Study Case M01 ... 29
Table 16 - Summary Body Mass Loss calculated through percentage and liters per hour – Case Study M01 ... 29
Table 17 - Summary o the RPE scale for every performed test – Study Case M01 ... 30
Table 18 - Core Temperature Summary – Case Study M02 ... 31
Table 19 - Summary of the main results of the Heart Rate parameter – Study Case M02 ... 31
Table 20 - Summary of the average and maximal VO2 consumption for each protocol – Study Case M02 ... 32
Table 21 - Summary of the Lactate concentration for each experiment – Study Case M02 ... 33
Table 22 - Summary Body Mass Loss calculated through percentage and liters per hour – Case Study M02 ... 33
Table 24 - Core Temperature Summary – Case Study M05 ... 35
Table 25 - Summary of the main results of the Heart Rate parameter – Study Case M05 ... 36
Table 26 - Summary of the average and maximal VO2 consumption for each protocol – Study Case M05 ... 36
Table 27 - Summary of the Lactate concentration for each experiment – Study Case M05 ... 37
Table 28 - Summary Body Mass Loss calculated through percentage and liters per hour – Case Study M05 ... 38
Table 29 - Summary o the RPE scale for every performed test – Study Case M05 ... 39
Table 30 - Core Temperature Summary – Case Study M07 ... 39
Table 31 - Summary of the main results of the Heart Rate parameter – Study Case M07 ... 40
Table 32 - Summary of the average and maximal VO2 consumption for each protocol – Study Case M07 ... 41
Table 33 - Summary of the Lactate concentration for each experiment – Study Case M07 ... 42
Table 34 - Summary Body Mass Loss calculated through percentage and liters per hour – Case Study M07 ... 42
Table 35 - Summary of the RPE scale for every performed test – Study Case M07 ... 43
Table 36 - Core Temperature Summary – Case Study M09 ... 44
Table 37 - Summary of the main results of the Heart Rate parameter – Study Case M09 ... 44
Table 38 - Summary of the average and maximal VO2 consumption for each protocol – Study Case M09 ... 45
Table 39 - Summary of the Lactate concentration for each experiment – Study Case M09 ... 46
Table 40 - Summary Body Mass Loss calculated through percentage and liters per hour – Case Study M09 ... 47
XI
NOMENCLATURE
Abbreviation Definition AA After Acclimation BA Before Acclimation HE Heat ExhaustionMNL Marching without additional load
MWL Marching with additional load
NC Thermoneutral Condition
1
1 INTRODUCTION
1.1 Scope
The aim of human temperature regulation is to protect body processes, by establishing a relative constancy of deep body temperature, in spite of external and internal influences on it (Werner, 2010).
Body heat may be transferred by 4 mechanisms: Conduction, Convection, Radiation, and Evaporation. When the body is at rest or exercising moderately in cooler temperatures, the majority of heat loss occurs through conduction, convection, and radiation. As environmental heat stress and exercise intensity increase, evaporation of sweat at the skin surface becomes the predominant mechanism for body heat dissipation. The hypothalamus triggers sweating and increased cutaneous blood flow
upon detection of an elevation in core body temperature. (Pryor, Bennett, O’Connor,
Young, & Asplund, 2015)
Problems due to heat stress may occur whenever the rate of heat production or heat gain from the environment is sufficiently large in relation to the body’s ability to dissipate heat. (Sonna, 2012) As a result, anyone subject to such condition may experience what is called “Heat exhaustion” (further ahead mentioned as HE),that is characterized by hypotension and cardiovascular insufficiency in persons who become dehydrated while exercising in conditions of high environmental heat stress. Symptoms include nausea and vomiting, tachycardia, dizziness, muscle cramps, energy depletion, central fatigue, and syncope. Core body temperature may be elevated but to no higher than 40°C. HE is often difficult to differentiate clinically from the early stages of
exertion heat stroke. (Nichols, 2014)
Extremely hot environments, i.e., temperatures above 35 ºC for living or above 32 ºC for working, are prevalent in various workplaces, such as steel mills, laundry facilities, glass and ceramic workplaces, deep mines, metallurgy manufacturing facilities, rubber foundries, and, as well in military facilities/operations that will be the focus of the entire article.(Shen & Zhu, 2015)
Most of the earth’s hot regions are inhabited, and human physiology allows people to live and work successfully in very hot climates because they are acclimatized (physiologically adjusted to an environment, in nature) to heat.
However, military operations in a hot climate must confront problems of heat stress that differ substantially from those ordinarily faced by the local inhabitants. Military operations may involve troops who were not acclimatized to heat before their
deployment, and local supplies of fresh water may be insufficient for the requirements of a large military force. Moreover, because of the demands of combat or other mission requirements, troops may have to perform physical exercise during the heat of the day, or at levels that exceed established guidelines for prevention of heat casualties. This can be aggravated by a need to perform some exercises when they do not have free access to drinking water. (Sonna, 2012)
Also, military uniform and equipment are necessary components for the survivability and success of troops, but induce additional stress to the soldier working in warm climates. (Lee et al., 2012) During physical tasks, protective clothing causes a downward shift in the temperature at which heat strain occurs, resulting in an increased body core temperature, heart rate and sweat rate.
Thus, sustained high-intensity physical exercise; excessive thermal insulation due to body armor or protective clothing; or thermoregulatory impairment due to fever, drugs, or dehydration may create the conditions for heat-impaired performance or heat illness, even during cool weather on the health and performance of troops; thus, the overall impact on military operations is probably much greater than generally appreciated.(Sonna, 2012)
1.2 Effects of Acclimatization protocols in performance
When humans are repeatedly exposed to conditions that are sufficiently stressful to elicit profuse sweating and elevate skin and core temperature, adaptations develop that reduce the deleterious effects of heat stress: heat acclimation or acclimatization. Heat acclimation refers to repeated periods of heat exposure undertaken in artificial or laboratory settings, whereas heat acclimatization results from exposure to natural environments. Although both natural and artificial hot environments elicit similar physiological adaptations (Armstrong and Pandolf, 1988; Wenger, 1988), heat acclimatization provides more specific responses due to exposure to the exact conditions that will be encountered during exposure (i.e. exercise task, solar radiation and terrain/geography) (Périard et al., 2015a).
The major physiologic adjustments that occur during heat and humidity acclimation include:
1. Plasma volume expansion; 2. Improved cutaneous blood flow;
3. Lower threshold for initiation of sweating; 4. Increased sweat output;
5. Lower salt concentration in sweat;
3
These adaptations allow for better dissipation of heat during exercise and increases temperature limits in the body, compared with subjects who have not been acclimated. (Pryor et al., 2015)
1.3 Study objectives
Many studies have measured the incidence of heat casualties among military personnel in a training environment. The reported incidence of heat injury at basic military training facilities is typically about 5 to 8 cases per 10.000 troops per week. New recruits and reservists typically have the highest rates of heat injury; reservists appear to be at particularly high risk. (Sonna, 2012) By contrast, less is known about the incidence of heat illness during actual military operations. For this reason, it is necessary to reduce the risk that they are exposed to. Whether it is in training or in a real context. And for that, acclimation may be the answer.
Accordingly to Brake, Bates, Brake, & Bates (2016) it is difficult to have a simple, practical measure of (heat) acclimation. A robust protocol needs to be provided for this.
In order to better understand how the body reacts to different thermal conditions after being acclimated, this study presents a laboratory 6 case studies experiment in which military young males were physiological monitorized inside a climatic chamber during the performance of several physical tests, where environmental settings, activities and performed tasks during military training were recreated.
The main objective of this experimental study is to evaluate the influence of acclimation in the performance of military personnel exposed to different environmental conditions (Thermoneutral and Thermal stress), based on the collected physiological data. The duration of the state of acclimation and a possible state of non-acclimation was also noted.
2 MATERIAL AND METHODS
2.1 Subject/Sample
The tested subjects are Caucasian males, working for the Portuguese Army in the north region. In order to protect individual’s identity, each of them will be referred in this study as M0X, where the “X” refers to his trial number.
From an initial sample of 9 subjects, 3 of them were excluded from the study due to different reasons: M03 did not endure the intensity of the exercise, complaining of physical pain although no medical reason was discovered, M04 contract with the military was terminated and M08 was excluded due to medical reasons.
Their ages are between 21-24 years old. They did not present cardiac, vascular, pulmonary, or any allergic medically diagnosed disease, being considered mentally healthy, without any kind of psychological disturbances by the military center of psychology. Regular medication use was not declared.
Accordingly to Helsinki Declaration, all participants gave informed consent prior to their inclusion in the study.
2.2 Test protocols
The protocols applied to the following case studies were defined together with Portuguese Army and tries to recreate the real environmental settings, activities and performed tasks during military training. It was performed inside a Climatic Chamber (Fitoclima 25000) and can be divided into three sub-protocols, occurring at two different environmental conditions:
1. A Thermo Neutral Condition test, in which air temperature was regulated to 22.0º ± 0.5ºC and relative humidity to 40 ± 2%, selected for this protocol based on the work of (Costa &Baptista, 2013).
2. A Thermal Stress Condition test, in which air temperature was regulated to 40.0 ± 0.5ºC and relative humidity to 30 ± 2% (defined to recreate the Afghanistan real environmental conditions).
For each of the conditions mentioned above, three tests (sub-protocols) were performed in a Treadmill Ergometer (General Electric T2100):
1. Marching without additional load; 2. Marching with additional load; 3. Running.
All the protocols and its subdivisions were recreated in two distinct acclimation scenarios. Initially, tests were performed in an acclimated condition of the subject to a thermal stress condition, the second when the subject was thought not to be acclimated. The acclimation process will be described further ahead.
To assure physical integrity of the subjects, some parameters were controlled before every experiment: water intake (shouldn’t be less than 1.5 l), medication (any kind of analgesics, antipyretics or sleep deprivation that took less than 6 hours before), excess of alcohol or caffeine in the 12 hours prior the tests and spice food (Pryor et al., 2015). For example, medication and drug use can put users at increased risk of developing heat
5
illness. Alcohol and some commonly used medications (diuretics, laxatives) can contribute to dehydration, increasing body temperature during exercise.
Other drugs may affect the subjects by either increasing heat production or compromising thermoregulation. (Dube, Imbeau, Dubeau, Lebel, & Kolus, 2016) (Wenger, 1997)
For a better understanding of the relationship between the variables involved, is presented a summary table (Table 1) with the sub-protocols conducted for this case study.
Table 1 - Summary of the sub-protocol conducted for this case study
The tests took place in the months of May and June 2015.
2.2.1 Marching Without additional load Protocol
This protocol, further ahead mentioned as “MNL”, consists of a sub-maximal intensity test, in which is intended to reach body overload by time exposure trough marching, without changing the effort intensity during the test.
In order to do so, the subjects, were only equipped with their uniform (consisting of a t-shirt, trousers and military boots) and would need to complete 3 stages. The first one consists of 20 minutes acclimatization to create a baseline point for the beginning of the test. After these 20 minutes, subject would perform an initial 3 minutes warm-up in the treadmill, set up for 4km.h-1, only then, the subjects would perform the actual experiment with a maximum duration of 20 minutes at 6 km.h-1.
State of Acclimation Sub-protocol Thermal Condition
After Acclimation
Marching Without Additional Load 22ºC 40% Hr
Marching Without Additional Load 40ºC 30% Hr
Marching With Additional Load 22ºC 40% Hr
Marching With Additional Load 40ºC 30% Hr
Running 22ºC 40% Hr
Running 40ºC 30% Hr
Before Acclimation
Marching Without Additional Load 22ºC 40% Hr
Marching Without Additional Load 40ºC 30% Hr
Marching With Additional Load 22ºC 40% Hr
Marching With Additional Load 40ºC 30% Hr
Running 22ºC 40% Hr
To simulate real ground conditions, treadmill was adjusted to have 1% of inclination.
The perceived effort was estimated every 5 minutes using Borg’s Scale.
2.2.2 Marching With Additional Load Protocol
The “Marching With Load” protocol, further ahead mentioned as “MWL”, is in all similar to the previous sub protocol (MNL), but in this case, subjects would be equipped just like they would be on a field day or in a combat day. Besides the normal uniform they would be carrying a backpack (with the following items: tent, sleeping bag, alternative uniforms, meals, etc.) as well as belt with canteen, chargers and his weapon, creating a total load of about 29.20kg.
2.2.3 Running Protocol
This is an incremental protocol that intends to access the maximum oxygen uptake (VO2 max), which, as described in the literature, is an indicator of aerobic power
and physical condition of a given person.
Based on the studies of (Boulay, Simoneau, Lortie, & Bouchard, 1997), subjects would perform 3 different stages. First, a 5 minute warm-up at 8 km.h-1, then, after a recovery period of 5 minutes walking at 4 km.h-1 subjects would start the progressive continuous test on the treadmill until exhaustion. Starting from an initial 10 km.h-1, with increments of 1 km.h-1 every 2 minutes during the whole period of the test.
In this test protocol, treadmill was programmed to have 0% of inclination.
Contrarily to the previous protocols, this assay does not have a maximum length defined, and as mentioned above, subjects would perform the exercise until exhaustion, providing the indication to stop the test.
The perceived effort was estimated for each stage using Borg’s Scale.
2.3 Acclimation Process
Heat acclimation refers to the gradual advancement of physiological adaptations
to exercise in conditions of high environmental heat stress. The process occurs optimally over10–14 days of heat stress exposure exercise sessions that last at least 60–
90 minutes per day (Nichols, 2014).
The acclimation process of the subjects for this protocol took place for 14 consecutive days. During this period, subjects remained in the climatic chamber at the
7
Thermal Stress Condition (40.0 ± 0.5ºC) and relative humidity (30 ± 2%) designed for this study for 3 hours per day without performing any physical effort.
Throughout the article, the acclimation condition of the subjects will be referred to as “After Acclimation”, and its opposite as “Before acclimation”, both mentioned further ahead as “AA” and “BA” respectively.
2.4 Physiological monitoring
During all experimental protocols subjects were monitored in real time through the parameters that are set out in the following points:
2.4.1 Core temperature
One of the best performance/fatigue identifiers is the core temperature, in particular, when the individuals are exposed to high temperatures. So, the monitorization of this parameter is one of the best methods to minimize the risk of heat damage (Goodman et al., 2009, Byrne & Lim 2007). This kind of monitorization has been applied in different studies either in the laboratory or in the real world, especially among athletes, students and military forces.
Core Temperature (Mentioned Further ahead as “CT”) was monitored with resource to core temperature-sensing pills (8.7 mm diameter by 23 mm length.) (EQ-01, Respironics Inc., Murrysville, PA, USA). It travels along the digestive track harmlessly and leaves the body naturally within 24 to 72 hours.
Each pill is individually calibrated during manufacture and can be set, in the field, to transmit within 15-second intervals, one minute after being activated externally by a specific device(EQ-01 Core Pill Activator, Hidalgo, Cambridgeshire, UK). Data are sent by telemetry, with a precision of 0.01ºC for the recording system through the Equivital EQ02 Life monitor—Sensor Electronics Module (SEM), (EquivitalTM Life monitor, EQ02-SEM, Hidalgo, Cambridgeshire, UK) in real time, via Bluetooth.
These pills had to be swallowed 10 hours before the beginning of the experiment, and are not recovered.
After the activation of the pill, it begins to transmit a signal in which an ID code is generated. All ID of the administered pills were recorded for further identification and connection with protocols made by the subjects.
Gastrointestinal temperature is considered to be more closely related to rectal temperature than to esophageal temperature and, therefore, is likely to be about 0.5ºC
below the temperature of blood leaving the heart and defusing through the body core.(Low et al., 2007) The rectum is well insulated from the environment, so rectal temperature is independent of environmental temperature and is the most reliable clinical index of body temperature, and has also the advantage of being directly comparable with numerous historical studies, which invariably measured core temperatures rectally.(Wenger, 1997)
2.4.2 Heart rate
Heart rate (Mentioned Further ahead as “HR”) is a very cost effective non-invasive measure that can be easily and safely obtained over long working periods, and can be used as a replacement of VO2 to estimate metabolic rate. (Dube et al., 2016) HR
also provides an index of the degree of circulatory strain during exercise. (Golbabaei et al., 2014)
In this protocol, HR was obtained through the cardio pulmonary equipment K4-b2 (Cosmed, Rome Italy).
2.4.3 Pulmonary gas exchange
The maximal rate of oxygen consumption (VO2max), also maximal oxygen
consumption, maximal oxygen uptake, peak oxygen uptake, or maximal aerobic capacity, is one of the most commonly measured parameters in the basic and applied physiological sciences. The measure has a history dating back to 1923. VO2max is the
maximum capacity of an individual's body to transport through circulatory system and use oxygen in motor muscles. Nowadays, scientists believe that the ability to perform physical exercise should be determined using the aerobic capacity.(Habibi, Dehghan, Moghiseh, & Hasanzadeh, 2014), (BYUNG-KON YOON, LEN KRAVITZ, 1983)
In this protocol, pulmonary Gas Exchange was measurement with a breath-by-breath analysis (VO2, VCO2) obtained using the cardio pulmonary equipment from
K4-b2 (Cosmed, Rome Italy).
2.4.4 Lactate concentration
The concentration of Lactate in capillary blood was measured by collecting a sample (approximately 0.3µl) from subject’s right earlobe right after the ceasing of exercise, at 3rd, 5th and 7th minutes. At the 10th minute, another sample would be
9
collected if the values had not decrease by then. To accomplish that, Lactate Pro (Lactate Pro, Arkray, Kyoto, Japan) was used.
The lactate as a physiological marker has been used as an important tool to control the intensity of aerobic exercise. It is not that the lactate molecule by itself that causes fatigue, but its accumulation in the blood reflects an increase in the anaerobic metabolism and/or a decrease in the mechanisms responsible for lactate removal, causing the loss of an equilibrium state in the body.(Caputo, Fernandes, Oliveira, & Greco, 2009)
2.4.5 Dehydration
When exposed to heat stress, the maintenance of an individual’s hydration status
is essential to preserve exercise capacity and reduce the risk of heat illness, because fluid loss is associated with a core body temperature increase, and therefore a less
efficient thermoregulation.(Nichols, 2014)
Dehydration due to water mass loss was calculated through the weight difference before and after each test, using a 50g precision scale from SECA (Hamburg, Deutschland).
2.4.6 Borg Rate of Perceived Exertion
In order to measure the level of subjective physical workload, the RPE scale proposed by Borg is very useful, which is a rating scale, and rating scales are important supplemental measures of psycho - physical performance and work capacity. (Habibi et al., 2014)
2.4.7 Climatic Chamber
As previously stated, the tests were performed inside a Climatic Chamber, (FITOCLIMA 25000EC20), built according EC standards and directives relating to health and safety requirements. This chamber allows simulating the exposure to thermal environments of very different workplaces.
The temperature inside the chamber can be controlled between –20 °C to 50 °C and the humidity from 30% to 98%. The chamber is also equipped with O2 and CO2
2.5 Stopping criteria
In order to ensure the physical integrity of the subjects, stopping criteria were created for all protocols, and, during real-time monitoring, if only one of these were achieved, the test would be stopped immediately.
These were:
1. Core temperature above 38.5ºC (Costa et al., 2012) (Richmond, Davey, Griggs, & Havenith, 2015), the need for a heat stress index led to the development of the thermal work limit (TWL). Defined as the limiting (or maximum) sustainable metabolic rate that euhydrated, acclimatized individuals can maintain in a specifict hermal environment within safe limits of body core temperature.(Brake et al., 2016)
2. Heart rate beyond a value, given by a formula (HRmax = 220 – age of them
subject) commonly used in sports experimental protocols, which in this case, was 196 bpm (HRmax = 220 – 24). (Bruijns, Guly, Bouamra, Lecky, & Lee,
2013)
3. Respiratory coefficient higher than 1.10. (Teixeira, Grossl, Lucas, Guilherme, & Guglielmo, 1980)
11
3 RESULTS
The subject M06 was considered separately from the others because of a huge mass loss that he put himself through from one year of experiment to another. Bearing this in mind, all of his tests were performed again, during May-June, 2015. However, due to calendar limitations, he went through the acclimation process and less than one month later he performed the “before acclimation” tests, this fact will be taken into account later in the discussion of the results.
Due to the repetition of all the data related to subject M06, all this investigation will focus on the data obtained for this military. For all the others, only the main results obtained will be presented and discussed.
3.1 Subject M06
3.1.1 Core temperature
In order to draw conclusions from the obtained data by monitoring the internal temperature, all available data recorded from the core pills were exported and treated. The results (as it can be seen in the example below – Graphic 1) were drawn in the graphic form, in which, for each protocol, the results of Before and After Acclimation were put together for a better comparison of his evolution.
As mentioned before, all the protocols applied in this case study presented several steps that had to be supplemented in order to perform the desired exercise. Once the equipment registered all activity performed during these steps, it became necessary to identify the actual exercise period. To do this, the curves were synchronized after the identification of the basal state of the subject (experiment beginning) and the highest temperature reached during the test, knowing that this was not indicative of the end of the test, but the moment immediately after the end of it. For each one of the curves, those selected data were identified with a distinct color.
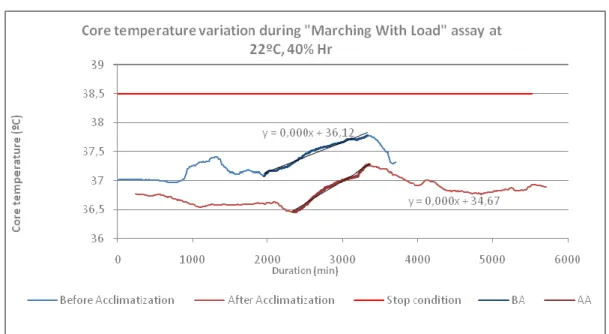
In the Graphic 1 is presented the behavior of the core temperature variation during the Marching With additional Load (MWL) protocol on a Thermoneutral Condition, Before and After the Acclimation.
Graphic 1 - Core temperature variation during "Marching with additional Load" assay at 22ºC, 40% Hr – Study Case M06
It is possible to observe that there is a distinct evolution of the subject core temperature during the protocols performed before and after acclimation. Before the acclimation (BA), temperatures were always higher than the temperatures obtained on the AA condition, for the same test period. In the same graphic it is also possible to observe the indicator line for the stopping criteria of this type of monitoring (38.5ºC).
On Table 2, a summary of each test performed is presented. Due to equipment failure, initial temperature data could not be retrieved from the “Running” Protocol in the Thermoneutral Condition, After Acclimation.
Table 2 - Core Temperature Summary – Case Study M06
Thermoneutral Condition Thermal Stress Condition
Initial Core Temperature (ºC) Maximum Core Temperature (ºC) Initial Core Temperature (ºC) Maximum Core Temperature (ºC)
Marching Without Additional Load BA 36,98 37,54 36,58 37,66
AA 36,76 37,39 37,24 37,89
Marching With Additional Load BA 37,08 37,78 36,72 38,16
AA 36,46 37,27 36,88 38,04
Running BA 36,85 38,02 37,16 38,42
AA --- 38,06 37,32 39,01
13
By analyzing the mentioned table, from a general point of view of the obtained data, it is possible to state that temperatures reached higher values for Thermal Stress Condition tests, than they did in Thermoneutral Condition ones.
Maximum temperatures for Marching protocols were never below 37°C and in the Running protocols, never below 38ºC, showing only minor differences between Before and After the Acclimation.
In general, throughout the tests, it is possible to observe a decrease of the maximum temperature achieved, when compared the same sub protocols, performed Before or After Acclimation, observing lower maximum temperatures in the tests performed in the AA state, with the exception of the running protocol on both temperature conditions, wherein the maximum temperature reached was higher AA. Thus there has been an improvement in performance after adaptation, once the subject was able to perform the same test with lower internal temperature.
The protocol that had showed higher maximum temperatures was the running protocol for both temperature conditions. It also presented a greater variation between the initial and maximum temperature for stress condition, having reached a maximum temperature of 39.01ºC. This value was not obtained during the course of the test, but after its ceasing. As mentioned earlier, one of the safety criteria for the protocols was that the internal temperature would not exceed 38.5ºC. In this particular case, the test was aborted when this value has been reached, and the maximum value shown was obtained at rest as a body response to the exercise performed.
However, in all the observed cases, the differences in the temperatures are very low.
In order to understand how the subject´s organism would react if exposed to the same conditions for longer periods of time, from each test, obtained curves were adjusted to linear models, as it can be seen on Table 3.
From these mathematical expressions, gradients were calculated and converted from degrees per second to degrees per hour. (Table 4)
Table 3 - Mathematical expressions from the obtained curves – Study Case M06
Thermoneutral Condition Thermal Stress Condition Marching Without Additional
Load
BA y = 0.0005x + 35.931 y = 0.0008x + 34.977
AA y = 0.0006x + 34.163 y = 0.0005x + 35.251
Marching With Additional Load
BA y = 0.0005x + 35.945 y = 0.0011x + 34.061
AA y = 0.0008x + 34.561 y = 0.0008x + 35.093
Running BA y = 0.001 x + 34.667 y = 0.001x + 35.066
AA y = 0.0009x + 35.48 y = 0.0009x + 34.595
Table 4 - Obtained Gradients in Degrees per hour – Study Case M06
Gradient (ºC / hour)
Thermoneutral Condition Thermal Stress Condition
Marching Without Additional Load BA 1,8 2,88
AA 2,16 1,8
Marching With Additional Load BA 1,8 3,96
AA 2,88 2,88
Running BA 3,6 3,6
AA 3,24 3,24
BA - Before Acclimation; AA - After Acclimation
Running protocols presented higher values, as well as the protocols performed in the Thermal Stress Conditions, where the highest gradient was observed (MWL - BA).
Through the data, mathematical simulations were performed for one and two hours of exposure to the same conditions. The results are shown in the table 5.
Table 5 - Mathematical simulations for the core temperature, considering the calculated gradients and initial temperatures – Study Case M06
Thermoneutral Condition Thermal Stress Condition
Initial Core Temperature (ºC) 1st Hour 2nd Hour Initial Core Temperature (ºC) 1st Hour 2nd Hour
Marching Without Additional Load BA 36,98 38,78 40,58 36,58 39,46 42,34
AA 36,76 38,92 41,08 37,24 39,04 40,84
Marching With Additional Load BA 37,08 38,88 40,68 36,72 40,68 44,64
AA 36,46 39,34 42,22 36,88 39,76 42,64
Running BA 36,85 40,45 44,05 37,16 40,76 44,36
AA --- --- --- 37,32 40,56 43,8
BA - Before Acclimation; AA - After Acclimation
Once again, Thermal Stress Condition showed the highest core temperature values, as well as the running protocol at this thermal condition.
However, the projections shown that in the Thermal Stress Condition temperatures reached After the Acclimation were below those achieved Before the Acclimation.
15
Although these calculations are merely assumptions, at no given moment a body should be subjected to such conditions, once human body could not even handle many of the temperatures achieved at the end of the first hour of exposure.
3.1.2 Heart rate
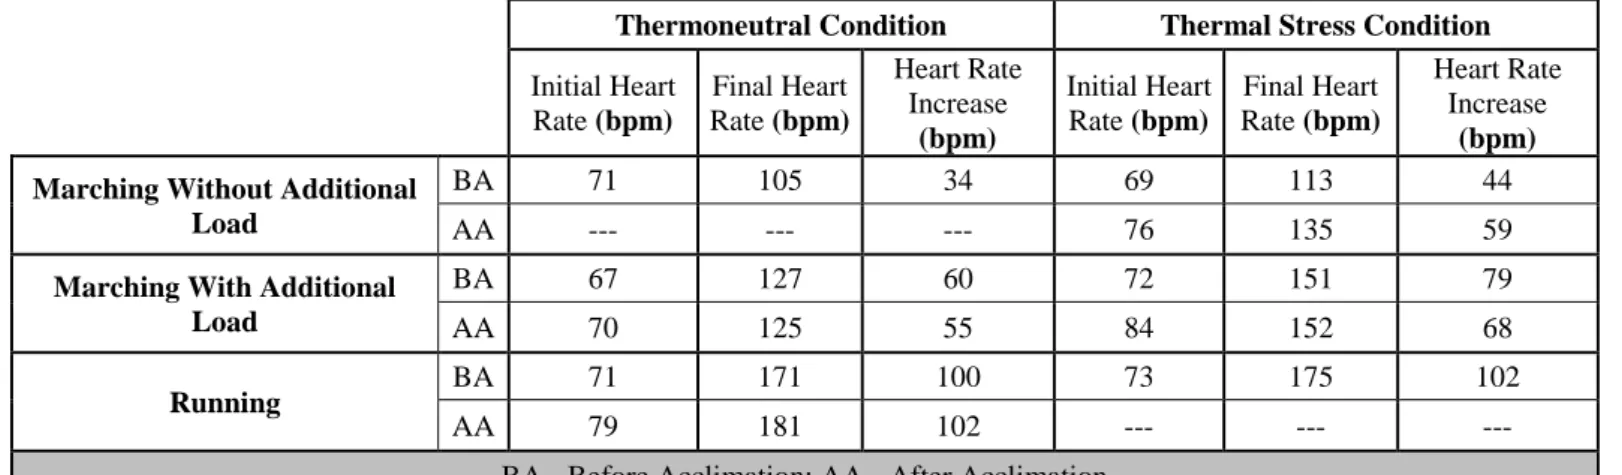
The table 6 presents a summary for the heart rate data obtained in the different tests performed. Displayed values are the result of the average of every minute of exercise performed. The gradient value is a mean value, a result of the difference between the heart rhythm that occurred at the beginning of the test and the average of the last minute of exercise.
Table 6 - Summary of the main results of the Heart Rate parameter – Study Case M06
Thermoneutral Condition Thermal Stress Condition
Initial Heart Rate (bpm) Final Heart Rate (bpm) Heart Rate Increase (bpm) Initial Heart Rate (bpm) Final Heart Rate (bpm) Heart Rate Increase (bpm) Marching Without Additional
Load
BA 71 105 34 69 113 44
AA --- --- --- 76 135 59
Marching With Additional Load
BA 67 127 60 72 151 79
AA 70 125 55 84 152 68
Running BA 71 171 100 73 175 102
AA 79 181 102 --- --- ---
BA - Before Acclimation; AA - After Acclimation
Due to equipment malfunctioning no data were obtained from the MNL AA test performed at the Thermoneutral condition, as well as the Running AA test performed at the Thermal Stress condition.
Through a table analysis, it is noted that the heart rate react differently between different temperature conditions, with higher values for the tests performed at the Thermal Stress Condition.
In terms of acclimation there was a reduction of the gradient for the MWL protocol in the tests carried out AA, however, the analysis performed to the remaining available data, shown that the same was not verified, particularly for “Running” protocol at the Thermoneutral condition, and MNL at Thermal stress Condition, in which, there was an increase in the gradient to the AA condition
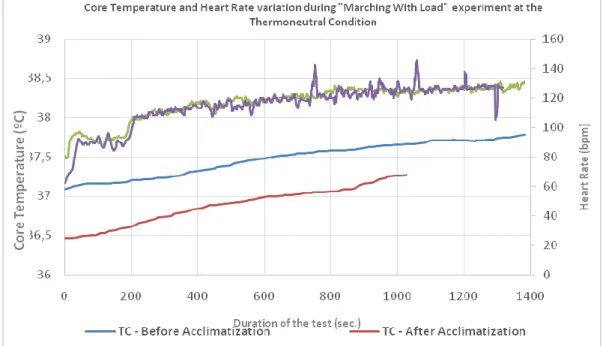
In order to evaluate a possible relationship between the variation of temperature with the variation in the cardiac rhythm, the data related to these were placed side by side with the data obtained for the core temperature.
The treatment given to the mentioned data was transversal to all tests. An example can be seen in Graphic 2.
The graphic 2 is relative to the MWL protocol for Thermoneutral condition (the same as presented in this article for the CT data).
In this, it is possible to observe that the variation of heart rate followed the variation of the temperature. Tests performed BA began with higher values of TC and HR when compared to the initial values of the AA condition, having increased throughout the performance of the exercise.
However, only there is a very slight difference in heart rhythm reached in the tests.
It is also possible to observe that for the AA condition, the test started at a lower HR value and despite being less constant throughout the test time, accompanied by some variations (possible higher effort), in general, the rate heart was lower than that observed for BA condition.
Graphic 2 - Heart rate and core temperature variation during MWL protocol at the Thermoneutral condition - Study Case M06
17
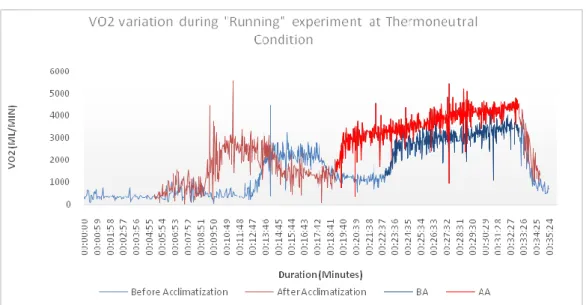
3.1.3 Maximum Oxygen Uptake
The following graphic (Graphic 3) is related with Oxygen Consumption, measured during the course of the experimental sub-protocol “Running”, at the Thermo neutral Condition.
In the mentioned graphic it is apparent that oxygen consumption was greater in the test carried out AA. However it is noteworthy that despite being conducted at the same temperature, the duration of the test was not the same. In this example, there was a performance improvement, explained by the decrease in O2 consumption. On top of
that, there was also an improvement concerning test duration, once for the same conditions, the subject withstood the exercise for a longer period of time. It is noted that for the “Running” protocol did not exist a predefined duration of the exercise. The subject would stop the test whenever he felt exhausted.
This graphic was chosen as an example amongst others, since it is possible to observe with some clarity the body's response to the different steps of the "Running" protocol designed for this project. As mentioned above, 5 minutes heating were considered at 8 km h-1, followed by a recovery period of about 5 minutes. For a better visualization in the graph, are indicated in the Table 8 the minutes in which each step was performed.
Just like for the parameters discussed in the preceding paragraphs, the data of all protocols performed regarding the oxygen consumption were synthesized in the table 7.
Table 7 - Summary of the average and maximal VO2 consumption for each protocol – Study Case M06
Thermoneutral Condition Thermal Stress Condition
Average VO2 (ml/min/Kg) Average VO2 (ml/min/Kg)
Marching Without Additional Load BA 19,445 19,496
AA 19,113 22,408
Marching With Additional Load BA 24,990 27,485
AA 20,734 30,728
VO2 Max. (ml/min/kg) VO2 Max. (ml/min/Kg)
Running BA 41,937 44,331
AA 52,995 50,902
Graphic 3 - Oxygen consumption for Running protocol at the Themoneutral condition - Study Case M06
Table 8 - Identification of warm-up and recovery periods visualized in Graphic 3 - Study Case M06
Warm-up (minutes) Recovery (minutes)
BA 12:57-17:53 17:53-22:00
AA 09:04-14:44 14:44-19:16
For the running protocols, the data related with the initial value of oxygen consumption have been identified, as well as the average of all the O2 consumption
values obtained during the test period. For the "Running" protocol the initial value of VO2 has been identified and the VO2max was calculated. To do this, and according to
Edwards (2013), the data collected for this trial period were divided into intervals of 1 minute, for which the respective averages were calculate, extracting the higher value among these.
For the “Marching” protocols at the Thermoneutral Condition is observed a decrease in the average O2 consumption in the test performed AA. The same is not
observable in the Thermal stress Condition in which the mean values increased for AA. Overall it is evident the difference between the initial values and average consumption of O2 for the “Marching” protocols when the Themoneutral condition is
compared with the Thermal stress Condition, showing this last one higher values. For the VO2max, when viewed separately for each temperature condition, it is
observed for AA condition values higher than BA, meaning therefore that the VO2
19
However, when comparing the “Running” protocol between different temperature conditions, it is observed that the value of VO2max at the Thermal Stress condition is
higher for the BA condition, and lower relatively to the AA condition.
3.1.4 Lactate
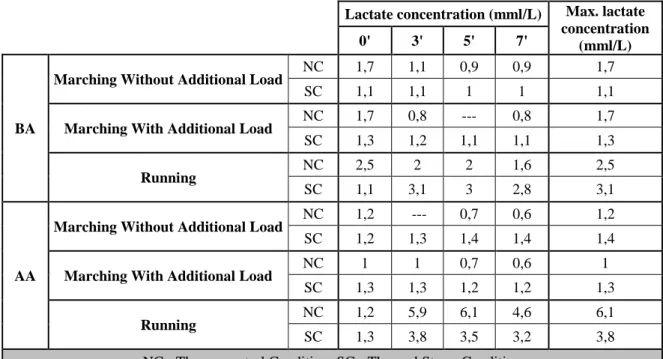
In the Table 9 are presented in a summary form the lactate values obtained in accordance with the procedure mentioned earlier. The peak value for each test was also identified, as well as the time it was obtained.
Table 9 - Summary of the Lactate concentration for each experiment – Study Case M06
Lactate concentration (mml/L) Max. lactate concentration
(mml/L)
0' 3' 5' 7'
BA
Marching Without Additional Load NC 1,7 1,1 0,9 0,9 1,7
SC 1,1 1,1 1 1 1,1
Marching With Additional Load NC 1,7 0,8 --- 0,8 1,7
SC 1,3 1,2 1,1 1,1 1,3
Running NC 2,5 2 2 1,6 2,5
SC 1,1 3,1 3 2,8 3,1
AA
Marching Without Additional Load NC 1,2 --- 0,7 0,6 1,2
SC 1,2 1,3 1,4 1,4 1,4
Marching With Additional Load NC 1 1 0,7 0,6 1
SC 1,3 1,3 1,2 1,2 1,3
Running NC 1,2 5,9 6,1 4,6 6,1
SC 1,3 3,8 3,5 3,2 3,8
NC - Thermoneutral Condition; SC - Thermal Stress Condition
By analyzing the results, it is possible to observe lower lactate values in AA Marching protocols in relation to BA Marching protocols for the Thermo neutral Condition. With the exception of the “Running” protocol, in which the values were higher for the AA condition regarding the BA condition.
For the Thermal Stress Condition the opposite is observed, since that the lactate values obtained were always higher in the AA tests performed, both in the “Marching" protocols as in the “Running” protocol.
By comparison of the temperature condition it is possible to observe a general increase of the lactate concentration in the “Marching” protocols for the Thermal Stress Condition.
The highest blood lactate values were always measured in running protocols, being the AA values greater than BA.
In general, the peak values were obtained in the first 3 minutes after the end of the exercise, not being necessary to perform a lactate measurement within the 10th min. after the end of exercise at any of the performed tests.
For the 3rd minute of sampling, of the MNL at the Thermo neutral condition performed AA no value is available
3.1.5 Body mass loss
As mentioned before, a weighing of individuals was performed at the beginning and end of the test. With this data, body mass loss was calculated by 2 different methods (liters / hour and percentage of body mass loss), in order to obtain comparable data with the guidance provided by ISO 9886-2004.
In the referred normative reference there are recommended values of body mass loss for a normal operation of 8 hours per day / 40 hours per week. The sweat rate should be limited to 1.0 l/h for non-acclimatized subjects and to 1.25 l/h for acclimatized subjects. Taking this into consideration, the obtained results are showed in the charts (Graphic 4 and 5).
Graphic 4 shows body weight loss obtained in “Marching” protocols. It is evident a greater loss of mass in the protocols performed in the Thermal Stress Condition. However, the greater body weight loss was observed in tests of the MNL in both environmental condition, when an increased loss in the MWL protocol for this same temperature condition would be expected.
In terms of acclimatization, the weight loss was higher in all tests performed AA. In relation to recommended values, only for the MNL protocol at the thermal stress condition performed AA the recommended value was exceeded (AA limit = 1.25).
21
Graphic 4 - Body Mass Loss in liters per hour on marching protocols - Study Case M06
Graphic 5 - Body Mass Loss in liters per hour on running protocols - Study Case M06
For “Running” protocols it no changes were observed in body mass loss in AA tests at the Thermoneutral condition regarding the BA condition. For the Thermal Stress Condition the mass lost AA exceeded the BA value.
For this protocol the recommended values were not exceeded.
0,40 1,00 0,40 0,80 0,45 1,40 0,55 1,40 0,00 0,20 0,40 0,60 0,80 1,00 1,20 1,40 1,60 MNL 22 ºC 40% rh MNL 40 ºC 30% rh MWL 22 ºC 40% rh MWL 40 ºC 30% rh Bod y M ass Lo ss (l/ h )
Body Mass Loss (l/h) on Marching Protocols - Before and
After Acclimation
BA AA BA Limit = 1.0 AA Limit = 1.25 0,55 0,80 0,55 1,05 0,00 0,20 0,40 0,60 0,80 1,00 1,20 1,40 Running 22 ºC 40% rh Running 40 ºC 30% rh Bod y M ass Lo ss (l/ h )Body Mass Loss (l/h) on Running Protocol - Before and
After Acclimation
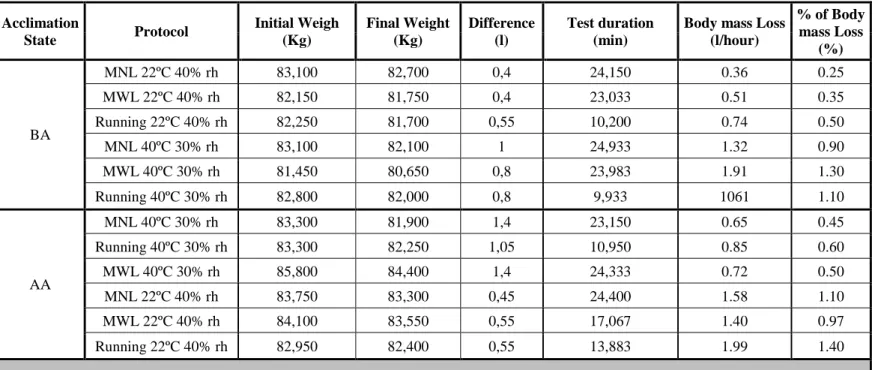
Table 10 shows a summary of body mass loss in all performed sub-protocols.
Table 10 - Summary Body Mass Loss calculated through percentage and liters per hour – Case Study M06 Acclimation State Protocol Initial Weigh (Kg) Final Weight (Kg) Difference (l) Test duration (min)
Body mass Loss (l/hour) % of Body mass Loss (%) BA MNL 22ºC 40% rh 83,100 82,700 0,4 24,150 0.36 0.25 MWL 22ºC 40% rh 82,150 81,750 0,4 23,033 0.51 0.35 Running 22ºC 40% rh 82,250 81,700 0,55 10,200 0.74 0.50 MNL 40ºC 30% rh 83,100 82,100 1 24,933 1.32 0.90 MWL 40ºC 30% rh 81,450 80,650 0,8 23,983 1.91 1.30 Running 40ºC 30% rh 82,800 82,000 0,8 9,933 1061 1.10 AA MNL 40ºC 30% rh 83,300 81,900 1,4 23,150 0.65 0.45 Running 40ºC 30% rh 83,300 82,250 1,05 10,950 0.85 0.60 MWL 40ºC 30% rh 85,800 84,400 1,4 24,333 0.72 0.50 MNL 22ºC 40% rh 83,750 83,300 0,45 24,400 1.58 1.10 MWL 22ºC 40% rh 84,100 83,550 0,55 17,067 1.40 0.97 Running 22ºC 40% rh 82,950 82,400 0,55 13,883 1.99 1.40
BA - Before Acclimation; AA - After Acclimation
3.1.6 Borg Rating of Perceived Exertion
As shown in the following chart (Graphic 6), for the "Marching With no Load" protocol at the Termoneutral condition, subject haven't reported any increase in perception of effort throughout the stages at different conditions of acclimation.
23
Graphic 6 - RPE of Marching protocols at Thermoneutral Condition - Study Case M06
He only reported differences in effort perception for the sub protocol "Marching with Load", and, according to the Borg’s scale, the individual felt more effort at the BA test. However, it only occurred an increase from Stage 1 till Stage 2, having remained constant in the following steps for both conditions of acclimation.
In the "Running" protocol, the perception of effort for tests carried out before and after acclimation was similar (level 1) till Stage 2. From there on, the perception of effort increased in a progressive manner. Also in this case there was a greater perception of effort for the test performed BA.
It was also noted that in the “Running Protocol” at the Termoneutral Condition after the Acclimation (AA), subject had performed more steps (has achieved an longer duration of the test) when compared with all conducted sub-protocols (Graphic 7).
Graphic 7 – RPE of Running protocols at the Thermoneutral Condition - Study Case M06
The following graphics (Graphics 8 and 9) are related to the heat stress condition. For the Thermal Stress condition of “Marching with no load” protocols, the perception was the same (Borg = 1) for tests carried out before and after acclimatization until step 2. From there, the perception increased for the test conducted before acclimatization
In the last step performed, there was a decrease in the perception of effort in the test performed AA, comparatively to the test performed BA.
For the “Marching With Load” protocol performed BA, the perception of effort have increased from the first stage, increasing gradually and steadily from Stage 2. For MWL AA test, despite having increased perception in Stage 2, it remained constant
0 1 2 3 4 5 6 7
Warm up Stage 1 Stage 2 Stage 3 Stage 4
Exe rtio n lev el Experiment stage
Borg rating of perceived exertion on Marching
Protocols at Thermal Stress Condition
BA/MNL 40ºC 30% rh AA/MNL 40ºC 30% rh BA/MWL 40ºC 30% rh AA/MWL 40ºC 30% rh 0 1 2 3 4 5 6 7 8
Warm up Stage 1 Stage 2 Stage 3 Stage 4 Stage 5 Stage 6
Exe rtio n lev el Experiment stage
Borg rating of perceived exertion on Running
Protocols at Thermal Stress Condition
BA/Running 40ºC 30% rh AA/Running 40ºC 30% rh
Graphic 6 - RPE of Marching protocols at Thermal Stress Condition - Study Case M06
25
until the end of the test and always below the perception obtained for the same test condition on the BA test.
At the “Running” protocol, the perception of effort was in all similar to the Thermoneutral condition, verifying a higher perception of effort for the test performed BA.
Table 11 shows a summary of Borg´s perceived effort results for all the performed sub-protocols.
Table 11 - Summary o the RPE scale for every performed test – Study Case M06
Aclimation State Protocol Borg Scale Perception
Warm up Stage 1 Stage 2 Stage 3 Stage 4 Stage 5 Stage 6 Stage 7
BA MNL 22ºC 40% rh 1 1 1 1 1 --- --- --- MWL 22ºC 40% rh 1 2 3 3 3 --- --- --- Running 22ºC 40% rh 1 1 1 2 4 6 8 --- MNL 40ºC 30% rh 1 1 1 2 3 --- --- --- MWL 40ºC 30% rh 1 2 4 5 6 --- --- --- Running 40ºC 30% rh 1 1 1 3 5 7 4 --- AA MNL 40ºC 30% rh 1 1 1 2 2 --- --- --- Running 40ºC 30% rh 1 1 1 2 3 4 6 --- MWL 40ºC 30% rh 1 2 3 3 3 --- --- --- MNL 22ºC 40% rh 1 1 1 1 1 --- --- --- MWL 22ºC 40% rh 1 1 2 2 2 --- --- --- Running 22ºC 40% rh 1 1 1 1 2 3 5 9
3.2 Subject M01
3.2.1 Core temperature
Accordingly to the procedures that were applied in the data treatment for M06, core temperature graphics were elaborated, using all available data. Then, for each test, a range of temperatures was identified, from basal state (experiment beginning) to maximum temperature (a little after test conclusion), in order to draw conclusions.
Table 12 summaries the main results for this parameter.
It is not possible to draw conclusions regarding the MWL protocols performed in both Thermal conditions, as well as for the MWL at the Thermoneutral condition.
In all other protocols, the maximum temperature reached was higher in the tests performed before acclimatization.
A peak of 39.03ºC at the Running protocol performed after the acclimation at the thermal stress condition was observed, which lead to the interruption of the test.
Table 12 - Core Temperature Summary – Case Study M01
Thermoneutral Condition Thermal Stress Condition
Initial Core Temperature (ºC) Maximum Core Temperature (ºC) Initial Core Temperature (ºC) Maximum Core Temperature (ºC)
Marching Without Additional Load BA --- --- --- ---
AA --- --- 37,44 38,03
Marching With Additional Load BA 37,39 38,12 36,96 38,17
AA --- --- 37,14 38,17
Running BA 36,73 37,70 37,42 38,52
AA --- --- 37,22 39,03
BA - Before Acclimation; AA - After Acclimation
3.2.2 Heart Rate
Table 13 presents a summary of the heart rate behavior of this military.
It is not possible to draw conclusions regarding the MNL protocol performed at the Thermoneutral condition, as well as for the MWL protocol performed at the thermal stress condition.
27
In terms of performance, subject showed an improvement in the heart rate increase at the MWL an running protocols performed at the thermoneutral condition, as in the MNL protocol performed ate the thermal stress condition. In witch, for these cases, the heart rate increase was lower at the tests performed after the acclimation process.
In the MWL protocol performed after the acclimation process at the thermal stress condition, the heart rate of the subject hit a 210 bpm peak, which was high above the considered maximum. In addition to the core temperature maximum, the test was stopped.
Table 13 - Summary of the main results of the Heart Rate parameter – Study Case M01
Thermoneutral Condition Thermal Stress Condition
Initial Heart Rate (bpm) Final Heart Rate (bpm) Heart rate increase during experiment (bpm) Initial Heart Rate (bpm) Final Heart Rate (bpm) Heart rate increase during experiment (bpm)
Marching Without Additional Load BA 69 119 50 --- --- ---
AA --- --- --- 96 152 56
Marching With Additional Load BA 88 163 75 76 191 115
AA 70 139 69 106 188 82
Running BA 117 199 82 81 198 117
AA 65 199 134 84 210 126
BA - Before Acclimation; AA - After Acclimation
3.2.3 Maximum Oxygen Uptake
As well as for the M06, in order to analyze the maximum oxygen consumption of the subject, marching and running protocols had to be examined separately, as they have different calculation methodologies. Table 14 summarizes the main results for each experiment.
Table 14 - Summary of the average and maximal VO2 consumption for each protocol – Study Case M01
Average VO2 (ml/min/Kg)
Thermoneutral Condition
Thermal Stress Condition
Marching Without Additional Load BA 24,033 22,287
AA 22,564 25,649
Marching With Additional Load BA 34,953 22,675
AA 22,675 34,904
BA - Before Acclimation; AA - After Acclimation
VO2 Max. (ml/min/Kg)
Thermoneutral Condition Thermal Stress Condition Running BA 43,16 42,693 AA 51,868 59,011
BA - Before Acclimation; AA - After Acclimation
An improvement in performance was only observed in the MNL protocol in the the thermal stress condition and at the MWL protocol performed in the thermoneutral condition.
3.2.4 Lactate
Lactate concentration values obtained for each experiment were put together in Table 15.
The peak lactate value increased for all protocols performed AA in the exception of the MWL protocol in the condition of thermal stress.
29 Table 15 - Summary of the Lactate concentration for each experiment – Study Case M01
Lactate concentration (mml/L) Max. lactate concentration
(mml/L)
0' 3' 5' 7'
Thermoneutral Condition
Marching Without Additional Load BA 1,1 --- --- --- 1,1
AA 1,3 0,7 0,6 0,6 1,3
Marching With Additional Load BA 1,3 --- 1,3 1,4 1,4
AA 0,9 1,5 1,4 1,2 1,5
Running BA 0,9 6,78 6,7 6,6 6,78
AA 0,9 6,3 7,6 6,9 7,6
Thermal Stress Condition
Marching Without Additional Load BA 0,9 1,6 1,3 --- 1,6
AA 3,1 1,6 2,5 1,4 3,1
Marching With Additional Load BA 0,8 2,4 2,2 2,1
2,4
AA 1,3 1,7 1,9 1,6 1,9
Running BA 1,1 6,2 6 5,7 6,2
AA 1,1 11,6 7,9 6,1 11,6
BA - Before Acclimation; AA - After Acclimation
3.2.5 Body Mass Loss
The main results for each experiment, concerning the different calculations: body mass loss through percentage and liters per hour are sown at Table 16.
With the exceptions of the MWL protocol in the thermoneutral condition, and Running protocol athe Thermoneutral condition in all the ther protocols, BML (l/hour) was superior in the AA condition.
Table 16 - Summary Body Mass Loss calculated through percentage and liters per hour – Case Study M01
Thermoneutral Condition Thermal Stress Condition Body mass Loss (l/hour) Body mass Loss (l/hour) Marching Without Additional Load BA 0,25 0,90 AA 0,45 1,10 Marching With Additional Load BA 0,35 1,30 AA 0,60 0,97 Running BA 0,50 1,10 AA 0,50 1,40
3.2.6 Borg Rating of Perceived exertion
Table 17 - Summary o the RPE scale for every performed test – Study Case M01
Borg's Scale of perceived exertion
Warm up Stage 3 Stage 4 Stage 5 Stage 6 Stage 7
Thermoneutral Condition
Marching Without Additional Load BA 1 3 3 --- --- ---
AA 1 2 2 --- --- ---
Marching With Additional Load BA 1 --- --- --- --- ---
AA 1 3 3 --- --- ---
Running BA 2 3 5 7 --- ---
AA 1 2 3 5 7 ---
Thermal Stress Condition
Marching Without Additional Load BA 1 2 2 --- --- ---
AA 4 3 3 --- --- ---
Marching With Additional Load BA 2 5 5 --- --- ---
AA 3 7 7 --- --- ---
Running BA 1 3 5 7 --- ---
AA 1 4 5 6 8 ---
BA - Before Acclimation; AA - After Acclimation
In all the performed protocols in the thermoneutral condition, the perception of effort was lower in the AA condition, and an extra step was reached for the running protocol in condition AA.
For the thermal stress condition in the Marching protocols, the perception was equal before and after acclimation and constant (= 1) during all steps. For the MWL protocol the effort perception was higher in the AA condition.
For running in the Thermal stress condition the perception of effort was lower in condition AA, having reached an extra step for the protocol of race in condition AA
31
3.3 Subject M02
3.3.1 Core temperature
Table 18 summarizes the main core temperature results obtained for the M02 subject.
Table 18 - Core Temperature Summary – Case Study M02
Thermoneutral Condition Thermal Stress Condition
Initial Core Temperature (ºC) Maximum Core Temperature (ºC) Initial Core Temperature (ºC) Maximum Core Temperature (ºC)
Marching Without Additional Load BA --- --- --- ---
AA --- --- --- ---
Marching With Additional Load BA --- --- --- ---
AA 36,88 37,92 36,97 38,84
Running BA --- --- --- ---
AA 37,22 38,71 37,42 39,13
BA - Before Acclimation; AA - After Acclimation
Due to lack of data, it is not possible to draw conclusions for any of the protocols performed. Because the subject met the stopping criterion at the MWL and running protocols performed AA, those tests were aborted.
3.3.2 Heart Rate
For the MNL and Running protocols at both environmental conditions, the HR increase was lower at the AA condition. For all the others, the increase was higher at the AA condition.
Table 19 - Summaryof the main results of the Heart Rate parameter – Study Case M02
Thermoneutral Condition Thermal Stress Condition
Initial Heart Rate (bpm)
Final Heart Rate (bpm)
Heart rate increase during experiment (bpm) Initial Heart Rate (bpm) Final Heart Rate (bpm)
Heart rate increase during experiment (bpm) Marching Without Additional Load BA 79 125 46 85 132 47 AA 73 105 32 85 128 43 Marching With Additional Load BA 95 156 61 82 172 90 AA 60 145 85 82 181 99 Running BA 61 193 132 83 199 116 AA 67 191 124 95 187 92
BA - Before Acclimation; AA - After Acclimation
3.3.3 Maximum Oxygen Uptake
In all protocols performed AA at the thermoneutral condition, the VO2 was lower. For the thermal stress condition was higher in all protocols performed AA
Table 20 - Summary of the average and maximal VO2 consumption for each protocol – Study Case M02
Average VO2 (ml/min/Kg)
Thermoneutral Condition Thermal Stress Condition Marching Without Additional Load BA 28,854 24,230 AA 23,238 25,786 Marching With Additional Load BA 39,112 30,073 AA 31,503 32,995
BA - Before Acclimation; AA - After Acclimation
VO2 Max. (ml/min/Kg)
Thermoneutral
Condition Thermal Stress Condition
Running BA 66,897 64,421
AA 62,321 67,878
BA - Before Acclimation; AA - After Acclimation
3.3.4 Lactate
Running protocols in the thermoneutral condition had lower peak values in the AA condition. In the running protocol the peak value was higher in AA.
For the thermal stress condition, the MNL and Running protocol presented a decrease of the peak value in the AA condition. MWL showed an increase for this condition